python を用いたブラックホールの時間変動解析の例
ここでは、python を用いた時間変動解析,特にX線で観測したブラックホールの光子の強度の時系列データ(ライトカーブと呼ぶ)を例としてあつかう.ファイル形式だけ揃えれば,どんな時系列データの解析にも使える.自分でコーディングしなくても,XRONOSというNASAが出しているツールを使えば大体のことができる.ただし,細かいことや,新しい時間変動解析のためには自分で書いた方が勉強にもなるので,そういう人向けです.動作環境は,anaconda python3系で,mac のターミナル上です.ls が使えることが前提になってます.linuxは大丈夫ですが,windowsの方は微調整必要かもしれません.
(version = 1.2 で,2020.04.24にpython3向けにアップデート,2020-05-12 ver 1.3 で, unwrap phase の計算も入れました.)
サンプルファイルとコードのダウンロード方法は,
- 一式ダウンロード
- コード
- 一次元のスペクトルとライトカーブの作成 Ana_Timing_do_FFT.py
- 2次元のパワースペクトルを生成 Ana_Timing_plot2d_FFT.py
パワースペクトルに関して
パワースペクトル(PSD) の 規格化因子(norm) は、全周波数で積分すると、
RMS^2になる規格化にしてください。これが最も使われていると思います.確認したい人は,
matplotlibとscipyのフーリエ変換(FFT)を用いてパーシバルの定理を確認する方法を参照ください.
一回のパワースペクトルを適用する時間の切り出し方は、
- 一回のFFTの長さ T(sec) (周波数分解能は 1/T(Hz)になる)
- 時間ビン dT (sec) (ナイキスト周波数は 1/dT * 2[Hz]になる)
- 平均回数 N (揺らぎが、sqrt(N)で小さくなる)
の3つのパラメータを考えて、最適なものを用います。
例えばですが,数c/s程度の明るさであれば,
- 一回のFFTの長さ T = 256sec から 8096sec
- 時間ビン dT = 1 sec から 64 sec
- 平均回数 N = 1から5 回くらい
が妥当なレベルかと思います。オーダで一回のFFTに数100発のX線で,統計揺らぎが数%から10%程度という概算.これは目的とするサイエンスや物理によって異なります.
実行例
一番簡単な例
ライトカーブのテキストファイルを生成する
ファイル(xis3_src_0p1sec_6000.qdp)は、ブラックホールのライトカーブの一部.
fits ファイルを flc2ascii でテキストにし、6000行だけ抜き出したもの.
$cat xis3_src_0p1sec_6000.qdp
  7.05204864025116e+02  3.20020450000000e+01  1.60010220000000e+01  1.00000010000000e+00
  7.05329855978489e+02  8.00051120000000e+00  8.00051120000000e+00  1.00000010000000e+00
  7.05454847991467e+02  8.00051120000000e+00  8.00051120000000e+00  1.00000010000000e+00
....
のように,4行x時間の長さの分のデータが書かれている.4行の中身はそれぞれ,
- 時間(sec)
- カウントレート(c/s)
- カウントレートのエラー(c/s)
- fractional exposure (1ビンあたりにデータが詰まっている割合)が詰まっている.1.0で100%が有効,つまり GTIや window option など実行観測時間がカットされることがない,という意味で,dead time を考えるときや,window option などで実行時間が削減されてるときにそれを考慮するときに使う.
である.これに限らず,簡単なコードは,小さいデータ量で debug 効率が上がるように準備しよう.
ライトカーブのファイル名が書かれたファイルを作成する
/bin/ls xis3_src_0p1sec_6000.qdp > test1lc.list
ファイル名が書かれたファイルを用意する.これは,複数のファイルを一挙に処理したい場合に,ファイル名の書かれたファイルを渡すというfoolsの使用に準じている.
ライトカーブのプロットとパワースペクトルの計算
Ana_Timing_do_FFT.py を実行する.
python Ana_Timing_do_FFT.py test1lc.list -a 10 -l 128
ここでは,
「python Ana_Timing_do_FFT.py test1lc.list -a 平均回数 -l 一回のFFTに用いるビン数」という使い方をした.
オプションは他にもある.
$python Ana_Timing_do_FFT.py -h
Usage: Ana_Timing_do_FFT.py fileList [-d] [-p] [-e 1] [-c 4] [-a 12] [-l 512]

Options:
  --version             show program's version number and exit
  -h, --help            show this help message and exit
  -d, --debug           The flag to show detailed information (Flag)
  -p, --pltflag         to plot time-series data
  -m HLEN, --hlen=HLEN  Header length
  -c CLEN, --clen=CLEN  Column length
  -a ANUM, --anum=ANUM  Average number
  -l LENGTH, --length=LENGTH
                        FFT bin number (e.g., 1024, 2048, ..)
  -t TCOL, --tcol=TCOL  column number for time
  -s VCOL, --vcol=VCOL  column number for value
  -e VECOL, --vecol=VECOL
                        column number for value error (if negative, it skips
                        error column)
オプションの中で,-p をつけると一回ごとのFFTの結果の図を保存するようになる.平均化する前のFFTの様子を見たい場合は -p のオプションをつけて実行してください.
実行してうまくいくと,
fig_fft/       パワースペクトルのプロット
fig_phase/       パワースペクトルのunwrap phase
fig_lc/       ライトカーブのプロット
text_fft/     パワースペクトルをテキストダンプしたもの(Time vs. Power^2 [rms^2/Hz])
のディレクトリが生成され,図が生成される.
2次元ヒストグラムの作成
生成された1次元のパワースペクトルは,text_fft に保存されており,そのファイル名を test1fft.list に入れる.Ana_Timing_plot2d_FFT.py はそのファイルリストを引数に2次元のパワースペクトルを生成する.
$ /bin/ls text_fft/xis3_src_0p1sec_6000_l128_a10_fft_00000* > test1fft.list
$ python Ana_Timing_plot2d_FFT.py test1fft.list
とすると,2次元ヒストグラムが生成される.
ブラックホールのQPOが見える例
実行例
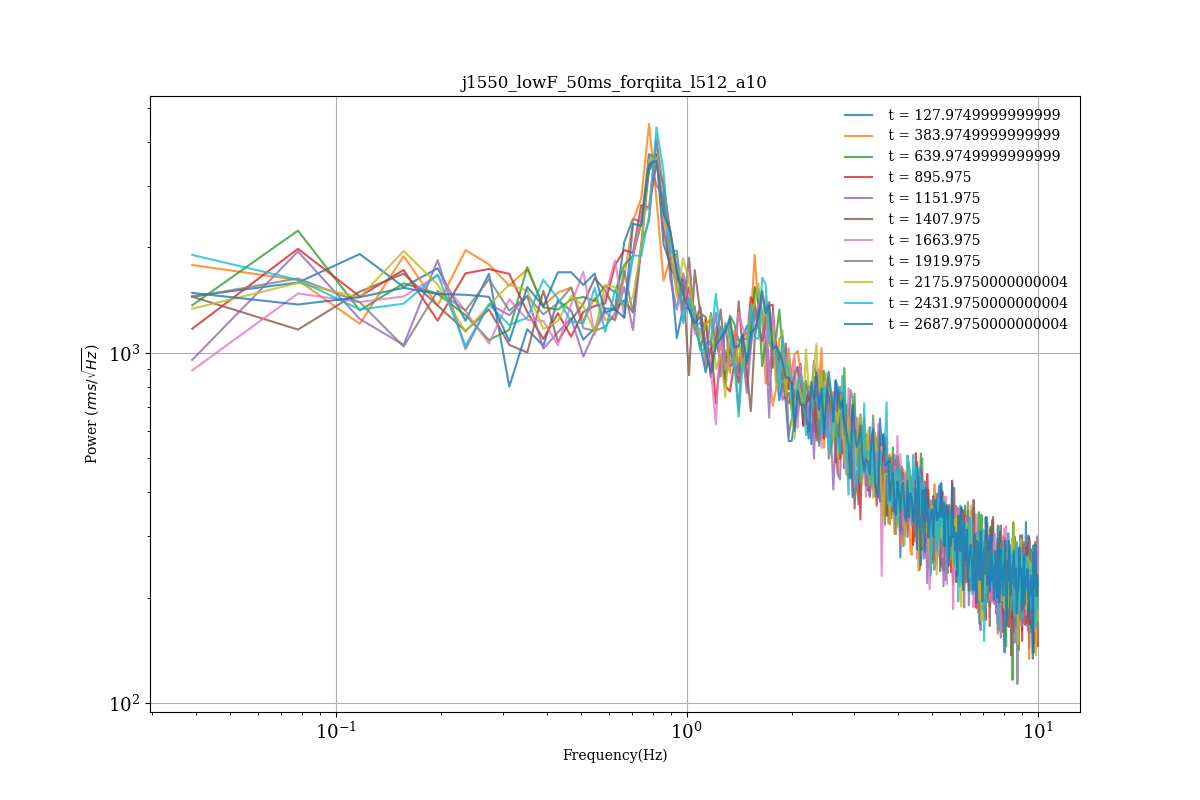
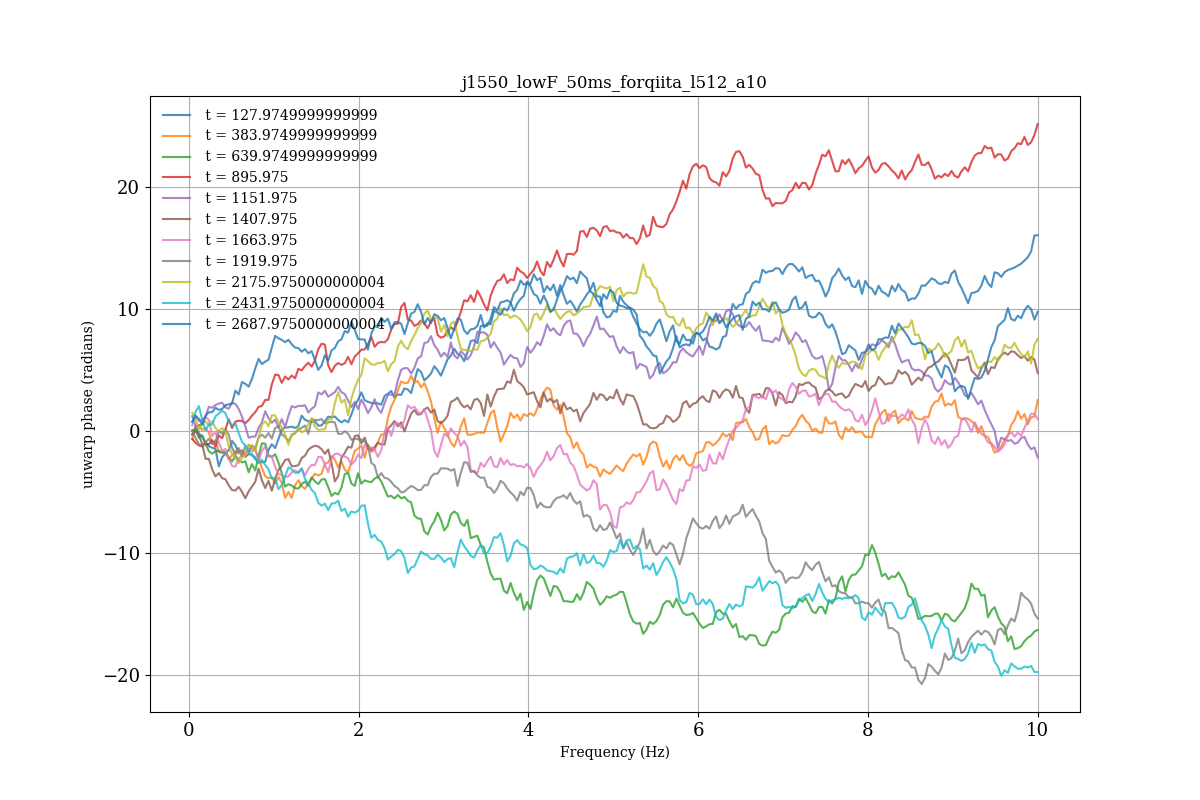
次に,RXTEという大有効面積の衛星で取得されたJ1550というブラックホール連星のデータ [j1550_lowF_50ms_forqiita.txt] (http://www-x.phys.se.tmu.ac.jp/%7Esyamada/qiita/v1_python3/j1550_lowF_50ms_forqiita.txt) を使って,ブラックホールの準周期的変動(QPO)がよく見える例で試してみよう.
/bin/ls j1550_lowF_50ms_forqiita.txt > rxtelc.list
python Ana_Timing_do_FFT.py rxtelc.list -a 10 -l 512 -d
/bin/ls text_fft/j1550_lowF_50ms_forqiita_l512_a10_fft_0000* > rxtefft.list
python Ana_Timing_plot2d_FFT.py rxtefft.list
実行結果
- ライトカーブ

- パワースペクトル
- unwrap した phase スペクトル
- 2次元のパワースペクトル
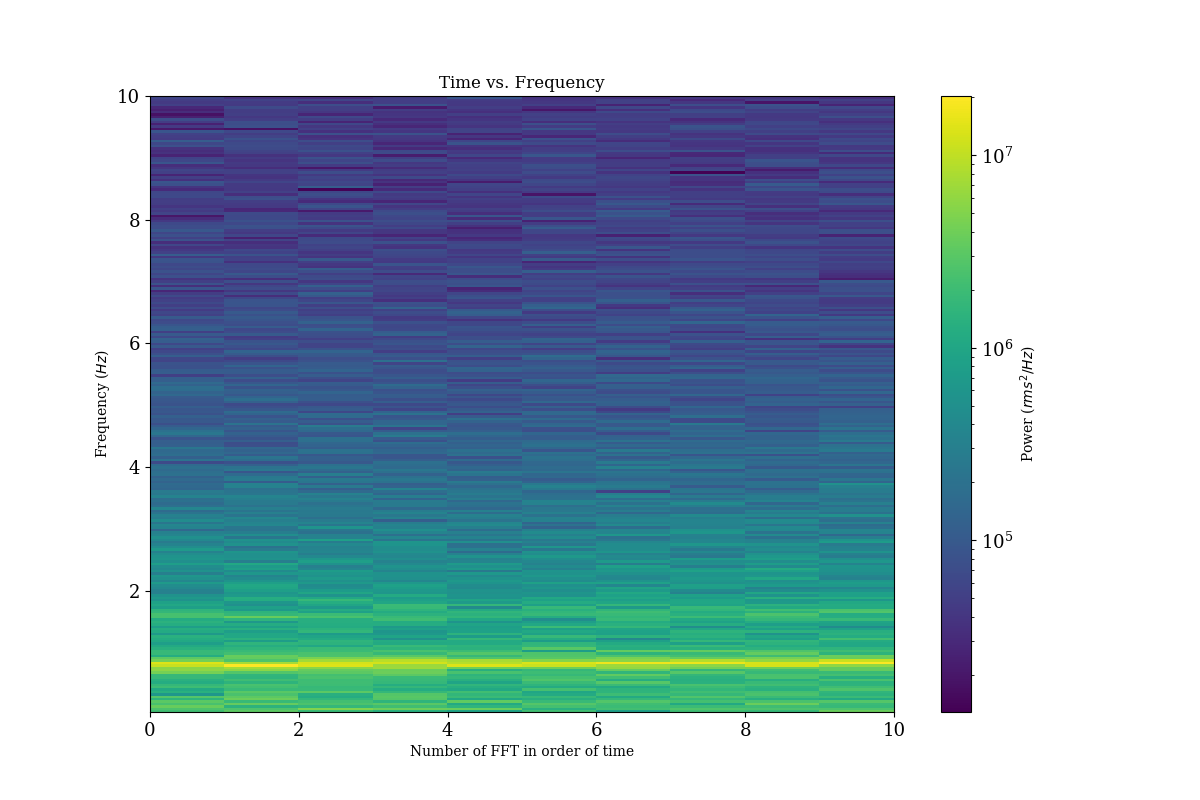
この ~ 0.5 Hz 付近に見えるのが,ブラックホールの準周期的変動というものである.
- 一回のFFTごとの結果
-p のオプションをつけると,一回ごとのFFTの結果をプロットして,scipy_fft_check というディレクトリの中に入れてくれる.
python Ana_Timing_do_FFT.py rxtelc.list -a 10 -l 512 -d -p
convert というコマンドを使って,gif アニメに変換すると,
convert -delay 50 -loop 5 *.png j1550_fftcheck.gif
のように,一回のインターバルあたりの時系列とPSDと位相がプロットされる.
fits ファイルからスタートする場合(より一般的な場合)
拡張子が,.lc か .fits の場合は,FITS format だと認識して,自動的に astropy でファイルを読む.
/bin/ls ae905005010hxd_0_pinno_cl_pha25-160.lc > xislc.list
python Ana_Timing_do_FFT.py xislc.list -a 400 -l 64
/bin/ls text_fft/ae905005010hxd_0_pinno_cl_pha25-160_l64_a400_fft_0000* > xisfft.list
python Ana_Timing_plot2d_FFT.py xisfft.list
実行結果
- ライトカーブ
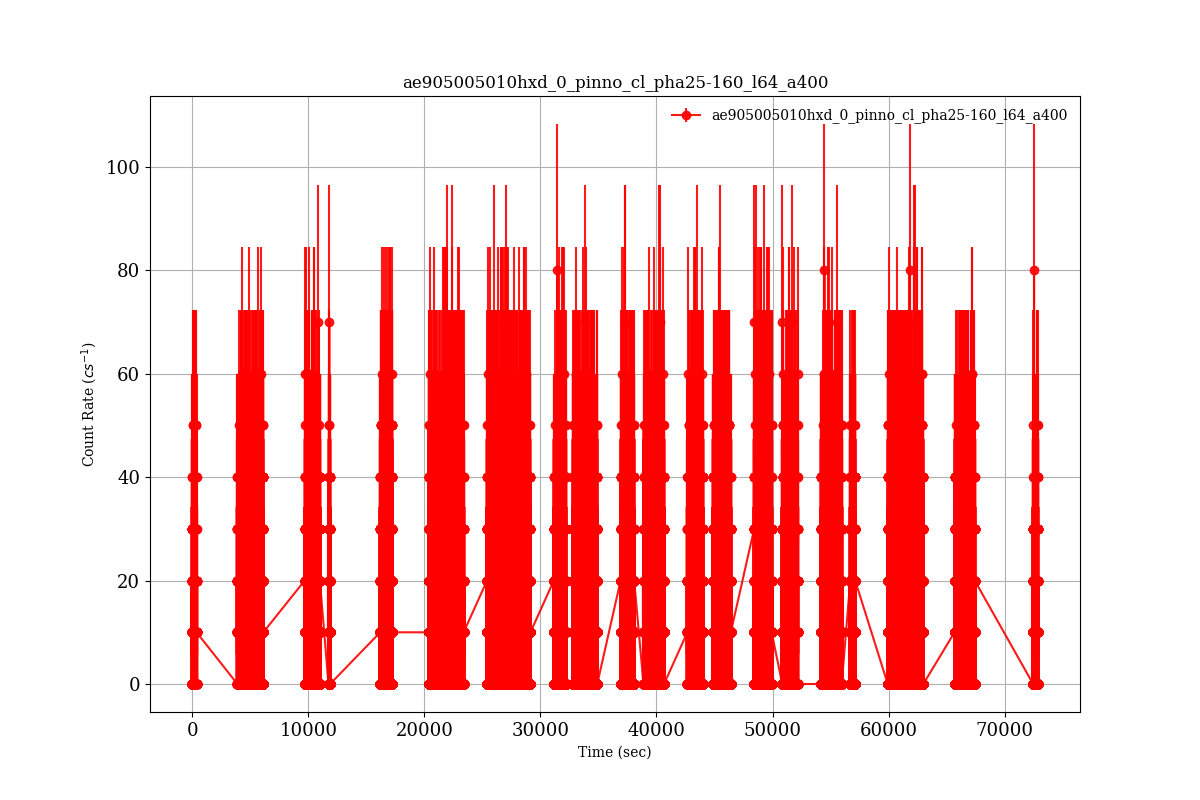
観測時間は,~ 70ks 程度あるが,実際には地球の裏側や,太陽角制限などのために,その半分程度した有効な観測時間がない.地球周回衛星の場合はほとんどがこのような状況になる.このプログラムでは,一回のFFTをするために十分なデータがない場合は飛ばすことにしている.xronosでは,window ファイルという設定ファイルを使って,複数の条件をクリアした時間帯のみ計算に使う仕様になっている.
- パワースペクトル
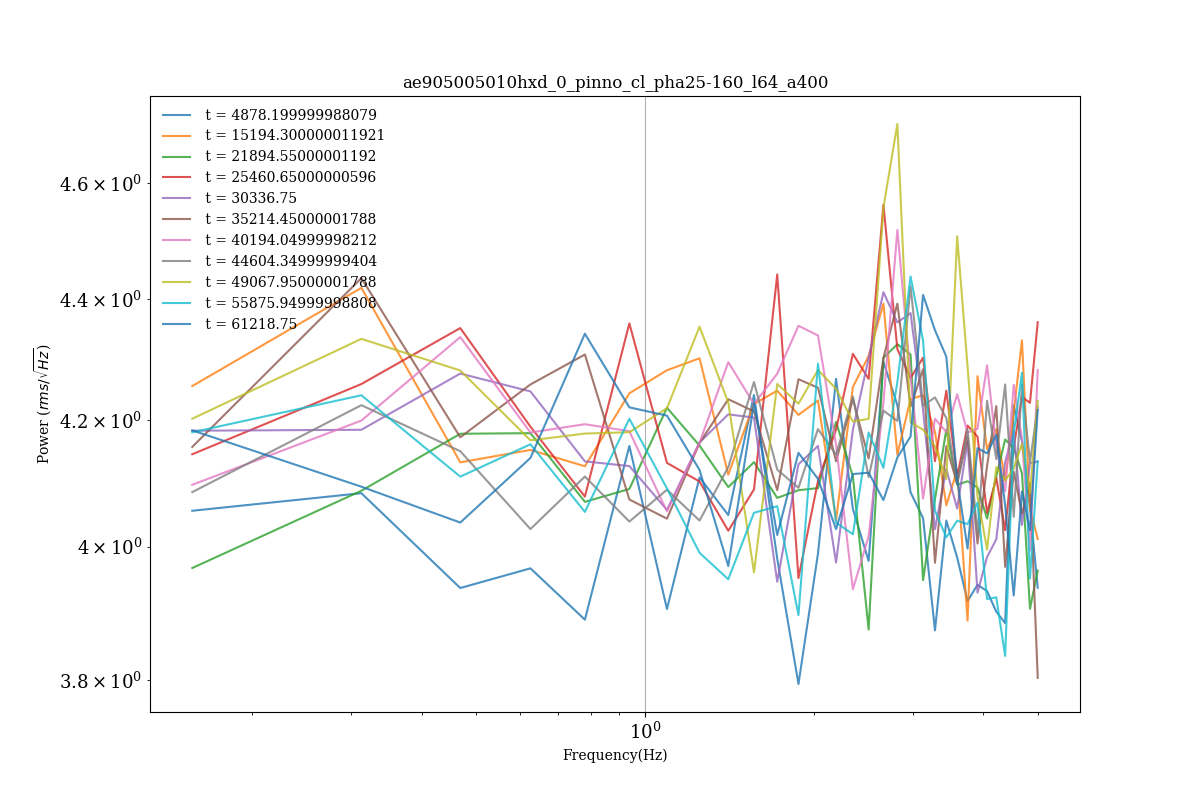
~ 3Hzあたりに見えるのがブラックホールのQPOである.このように弱いことも多く,精度よくパラメータを得るには統計と解析の工夫が必要になる.
コードの解説
概要
必要なのは,
- 一次元のスペクトルとライトカーブの作成 Ana_Timing_do_FFT.py
- 2次元のパワースペクトルを生成 Ana_Timing_plot2d_FFT.py
の2つだけでOKである.python3系に対応している.fits を入力する場合は,astropy が必要.
google Colab 上での実行方法
python 環境がない,あるいは環境構築が面倒な人でも,google Colab を使えば,google アカウントさえ持っていれば実行できる.google Colab の使い方は,
を参照ください.
まず,ファイル一式を google drive に置きましょう.それで,google Colab から google drive のファイルにアクセスできるように,マウントしましょう.
from google import colab
colab.drive.mount('/content/gdrive')
一時パスワードを取得して,コピペします.そうすると,
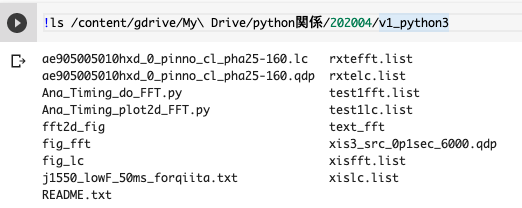
のように,google Colab から,google drive に置いたファイルが閲覧できます.
次に,ファイル一式を google drive にコピーしてしまいましょう.
!cp -rf /content/gdrive/My\ Drive/python関係/202004/v1_python3 .
これでファイル一式を google Colab にコピーできました.熟練者はスキップで構いませんが,ここで必ず,自分がどこにいて,ちゃんとファイルが見れているかを確認しましょう.
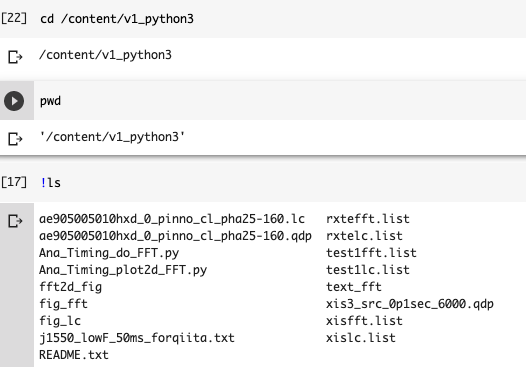
cd で移動して,pwd で自分の今いる場所を確認し,ls で今いる場所のファイル一覧を表示します.
あと,この記事の記載の通りで動くはずです.(python3 系を使ってますし,基本的なモジュールしか使ってないはずなので.動かなかったらご報告ください.)

/bin/ls と ls は同じはずです.ですが,環境によっては ls でファイル名以外の情報を出す設定もあるので,ここでは様にオプションなしで /bin/ls を呼ぶ書き方をしています.
一次元のスペクトルとライトカーブの作成
#!/usr/bin/env python
#-*- coding: utf-8 -*-

""" Ana_Timing_do_FFT.py is to plot lightcurves.

This is a python script for timing analysis.
History:
2016-09-13 ; ver 1.0; first draft from scratch
2020-04-24 ; ver 1.2; updated for python3
2020-05-12 ; ver 1.3; unwrap phase included
"""

__author__ =  'Shinya Yamada (syamada(at)tmu.ac.jp'
__version__=  '1.2'

############# scipy ############################################################
import scipy as sp # scipy : 数値演算に必携のモジュール
import scipy.fftpack as sf # FFTモジュール。fortanのFFTライブラリを使用。
################################################################################

############# numpy ############################################################
import numpy as np # numpy : 配列計算に必携のモジュール
from numpy import linalg as LA
################################################################################

############# matplotlib #######################################################
import matplotlib.pylab as plab
import matplotlib.pyplot as plt
from matplotlib.font_manager import fontManager, FontProperties
import matplotlib.colors as colors
import matplotlib.cm as cm
import matplotlib.mlab as mlab
from matplotlib.ticker import MultipleLocator, FormatStrFormatter, FixedLocator
# For 3D plot
from mpl_toolkits.mplot3d import Axes3D
from matplotlib.collections import PolyCollection
from matplotlib.colors import colorConverter
# ラベルのサイズ調整
params = {'xtick.labelsize': 13, # x ticks
          'ytick.labelsize': 13, # y ticks
          'legend.fontsize': 10
                    }
plt.rcParams['font.family'] = 'serif' # フォントを指定。(serif はどの環境にもある。)
plt.rcParams.update(params)
#################################################################################


import random # 乱数発生用モジュール (no use)
import array  # (no use)
import os # OS 関係のモジュール
import sys # system 関係のモジュール
import math # 数学関数モジュール
#import commands # shell のコマンドを使うためのモジュール for python2
import subprocess # shell のコマンドを使うためのモジュール for python3
# import pyfits # fits モジュール
import optparse # オプション関係
#import yaml
import re # 正規表現サポート
import csv # csv ファイル
import datetime # 時刻サポート
import pytz # timezoze
# jst = pytz.timezone('Asia/Tokyo')

# PyROOT
#import ROOT
#ROOT.gROOT.SetBatch(1)


def average_scipy_fft( allinputarray, dt, filtname=None, pltflag=False, outname = "default", anum = 10, length = 'default', debug = False):
    """
    時系列データを受け取り、指定された回数分の平均化をおこない、周波数、実部^2、虚部^2、実部^2+虚部^2、平均回数を戻す。

    [入力パラメータ]
    allinputarray : FFTする時系列データの一次元配列
    dt : allinputarray に入力したデータの時間間隔(sec)
    filtname=None : フィルターの有無。default は None。hanning のみサポート。
    pltflag=False : FFTされる時系列データをプロットするかどうかのフラグ。default は False
    outname = "default" : 出力ファイルを区別するための名前。default は "default"。
    anum = 10 : 平均する回数。default は 10回。
    length = 'default': 一回のFFTに用いるデータの長さ。default は "default"で、その場合は、length = 入力した配列の長さ/anum で計算される。
    debug = False : デバッグ用のフラグ。

    [出力パラメータ]
    周波数(Hz)、実部^2、虚部^2、実部^2+虚部^2、平均回数
    """

    alllen = len(allinputarray) # 配列の長さを取得
    print("..... length of all array = ", alllen)

    if length == 'default': # 一回のFFTの長さを自動で取得する。
        print("..... averaging is done with the number of the cycle. = ", cnum)
        length = int (alllen / anum)
        print("..... length = ", length)
    else: # 一回のFFTの長さを、length から取得する。
        print("..... averaging is done with the length of the record = ", length)
        print("..... the number of average = ", anum)

    averagenum = 0 # 平均した回数を保存するための変数。データが完璧に埋まっていれば、anum に一致する。

    # FFTした後の配列数を計算
    if (length%2==0):
        num_of_fftoutput = int(length/2) + 1 # 偶数の場合は、2で割って1を足す。
    else:
        print("[ERROR] Please choose even number for length ", length)
        sys.exit() # length が奇数は、通常は使わないので、エラーを吐いて終了する。

    # 空の配列を取得する。numpy で2次元配列として append するために、2次元配列のから配列を用意する。
    reals = np.empty((0, num_of_fftoutput), float)
    imags = np.empty((0, num_of_fftoutput), float)
    psds =  np.empty((0, num_of_fftoutput), float)
    unwrap_phases =  np.empty((0, num_of_fftoutput), float)

    for num in np.arange( 0, anum, 1): # 平均回数 anum 回、FFT を実行する。
        onerecord = allinputarray[num * length : (num + 1 ) * length]
        oneoutname = outname + str(num)
        if debug : print("..... ..... num = ", num, " len(onerecord) = ", len(onerecord))
        freq, spreal, spimag, sppower, spunwrap_phases = scipy_fft(onerecord - np.mean(onerecord), dt, filtname=filtname, pltflag=pltflag, outname = oneoutname, debug = debug)
        reals = np.append(reals, [spreal], axis=0) # add power^2/Hz
        imags = np.append(imags, [spimag], axis=0) # add power^2/Hz
        psds =  np.append(psds, [sppower], axis=0) # add power^2/Hz
        unwrap_phases = np.append(unwrap_phases, [spunwrap_phases], axis=0) # add radians
        averagenum = averagenum + 1

    real2 = np.mean(reals, axis=0)
    # sum(power^2 + power^2 + .....), and then sqrt{sum(power^2 + power^2 + .....)} --> power/sqrt(Hz)

    imag2 = np.mean(imags, axis=0)
    # sum(power^2 + power^2 + .....), and then sqrt{sum(power^2 + power^2 + .....)} --> power/sqrt(Hz)

    psd2 = np.mean(psds, axis=0)
    # sum(power^2 + power^2 + .....), and then sqrt{sum(power^2 + power^2 + .....)} --> power/sqrt(Hz)

    phase = np.mean(unwrap_phases, axis=0)
    # sum(power^2 + power^2 + .....), and then sqrt{sum(power^2 + power^2 + .....)} --> power/sqrt(Hz)


    return(freq,real2,imag2,psd2,averagenum,phase)


def scipy_fft(inputarray,dt,filtname=None, pltflag=False, outname = "default", debug = False):
    # updated, 2015/01/25, freq is adjusted to PSP output.
    # FFTを実行する。

    bin = len(inputarray) # 時系列データの長さを取得。1024 (default)
    # フィルターの設定
    if filtname == None:
        filt = np.ones(len(inputarray))
        cornorm = 1.0
    elif filtname == 'hanning':
        filt = sp.hanning(len(inputarray))
        # print "filt =" +  str(filt)
        cornorm = 8./3. # ハニングフィルターで減衰したパワーを補正する項。
    else:
        print('No support for filtname=%s' % filtname)
        exit()

    ###########################################################
    #    freq = np.arange(0, nyquist, nyquist/adclength)
    #   This means freq = [12.2, .. 6250.], len(freq) = 512
    #   because PSP discard 0 freq component.

    #    freq = sf.fftfreq(bin,dt)[0:bin/2 +1]
    #   scipy fftfreq return [0, 12.2 .... , -6250, ...], Nyquist is negative.
    nyquist = 0.5/dt
    adclength = int(0.5 * bin) # 512 (default)
    #    freq = np.linspace(0, nyquist, adclength + 1)[1:] # this is only for PSP
    freq = np.linspace(0, nyquist, adclength + 1)[0:]
    ############################################################
    df = freq[1]-freq[0]
    #    fft = sf.fft(inputarray*filt,bin)[1:bin/2+1] # this is only for PSP
    fft = sf.fft(inputarray*filt,bin)[0:int(bin/2+1)]
    #   scipy fftfreq return [0, 12.2 .... , -6250, ...], Nyquist is negative.
    #   so [1:bin/2 + 1] = [1:513] = [12.2 ,,, -6250]
    ###########################################################################
    real = fft.real
    imag = fft.imag
    #    psd = np.abs(fft)
    ############ this is used for to adjust PSP unit.
    #    psd2 = np.abs(fft) * np.abs(fft) * cornorm

    ############ this is used for to adjust matplotlib norm = rms definition.
    #    psd = np.abs(fft)/np.sqrt(df)/(bin/np.sqrt(2.))
    fftnorm = (np.sqrt(df) * bin) / np.sqrt(2.) # 周波数積分がRMSになるために必要な項。
    psd = np.abs(fft) * np.sqrt(cornorm) / fftnorm
    psd2 = psd * psd # Power^2
    rms_from_ft = np.sqrt(np.sum(psd2) * df) # 周波数空間で積分した量。時空間のRMSに一致する。
    phase = np.arctan2(np.array(real),np.array(imag)) # radians,   * 180. / np.pi # dig
    phase_unwrap = np.unwrap(phase)

    if pltflag: # 時系列データを確認のためにプロットする。
        binarray = np.arange(0,bin,1) * dt
        F = plt.figure(figsize=(10,8.))
        plt.subplots_adjust(wspace = 0.1, hspace = 0.3, top=0.9, bottom = 0.08, right=0.92, left = 0.1)

        ax = plt.subplot(3,1,1)
        plt.title("check scipy_fft")
        plt.xscale('linear')
        plt.grid(True)
        plt.xlabel(r'Time (s)')
        plt.ylabel('FFT input')
        plt.errorbar(binarray, inputarray, fmt='r', label="Raw data")
        fnorm = np.abs(np.amax(inputarray))
        plt.errorbar(binarray, fnorm * filt, fmt='b--', label="Filter")
        plt.errorbar(binarray, inputarray * filt, fmt='g', label="Filtered Raw data")
        plt.legend(numpoints=1, frameon=False, loc=1)

        ax = plt.subplot(3,1,2)
        plt.xscale('linear')
        plt.yscale('linear')
        plt.grid(True)
        plt.xlabel(r'Frequency (Hz)')
        plt.ylabel(r'Power ($rms/\sqrt{Hz}$)')
        plt.errorbar(freq, psd, fmt='r', label="PSD")
        plt.legend(numpoints=1, frameon=False, loc=1)

        ax = plt.subplot(3,1,3)
        plt.xscale('linear')
        plt.grid(True)
        plt.xlabel(r'Frequency (Hz)')
        plt.ylabel('UnWrap Phase (radians)')
        plt.errorbar(freq, phase_unwrap, fmt='r', label="phase")
        plt.legend(numpoints=1, frameon=False, loc=1)

#        plt.show()
        outputfiguredir = "scipy_fft_check"
        subprocess.getoutput('mkdir -p ' + outputfiguredir)

        outfile = outputfiguredir + "/" + "scipy_fftcheck" + "_t" + str(dt).replace(".","p") + "_" + outname + ".png"

        plt.savefig(outfile)
        if os.path.isfile(outfile):
            print("saved as ", outfile)
        else:
            print("[ERROR] couldn't save as ", outfile)


    if debug:
        print("=====> please make sure the three RMSs below are almost same. ")
        print(". . . . [check RMS] std(input), np.std(input * filt), rms_from_ft = "  + str(np.std(inputarray)) + " " + str(np.std(inputarray * filt)) +" " + str(rms_from_ft))

    return(freq,real,imag,psd2,phase_unwrap)


class lcfile():
    """
    一つのライトカーブに対して、一つのクラス。
    """
    def __init__ (self, eventfile, debug, hlen = -1, clen = 4, anum = 10, length = 'default', pltflag = False, tcol = 0, vcol = 1, vecol = 2):
        """ このクラスの初期化関数 init で、ファイルの中身を読み込む。"""

        eventfile = eventfile.strip() # 改行コードを除く。
        self.eventfilename = eventfile
        self.ext = eventfile.split(".")[-1]
        self.filenametag = os.path.basename(self.eventfilename).replace(".txt","").replace(".text","").replace(".csv","").replace(".qdp","").replace(".lc","").replace(".fits","")
        self.filenametag = self.filenametag + "_l" + str(length) + "_a" + str(anum)
        self.debug = debug

        #extract header information
        if os.path.isfile(eventfile):
            self.file = open(eventfile)

            if self.ext == "lc" or self.ext == "fits":
                print(".... file is considered as FITS format ", self.ext)
                from astropy.io import fits
                hdu = fits.open(eventfile)
                self.t = hdu[1].data["TIME"]
                self.v = hdu[1].data["RATE"]
                self.ve = hdu[1].data["ERROR"]

            else:
                print(".... file is considered as text format ", self.ext)

                self.t = np.array([])  # 時間
                self.v = np.array([])  # 値、e.g., count/sec
                self.ve = np.array([]) # エラー

                for i, oneline in enumerate(self.file):
                    if i > (hlen - 1) : # skip header
                        list = oneline.split()
                        if list[0][0] is not "!": # skip a line starting with !
                            if len(list) == clen: # check column number of the input file
                                self.t  = np.append(self.t,  float(list[tcol]))
                                self.v  = np.append(self.v,  float(list[vcol]))
                                if vecol > 0:
                                    self.ve = np.append(self.ve, float(list[vecol]))
                                else:
                                    self.ve = np.append(self.ve, float(0.)) # padding 0.

            if debug : print(len(self.t), len(self.v), len(self.ve))

            if len(self.t) < 1:
                print("[ERROR] no data are stored, ", self.t)
                print("Please check the length of column: column of your data = ", len(list), " input param of clen = ", clen)
                print("Both should be the same.")
                sys.exit()

            self.tstart = self.t[0]
            self.tstop = self.t[-1]
            self.timebin = self.t[1] - self.t[0]

            # created dt = t[i+1] - t[i], and add 0 to make it have the same array length as t.
            self.dt = self.t[1:] - self.t[0:-1]
            self.dt_minus_timebin = self.dt - self.timebin # 時間の飛びを判定する。飛びがなければゼロになる。
            np.append(self.dt_minus_timebin,0)

            print("timebin (sec) = ", self.timebin)
            print("start (sec) = ", self.tstart)
            print("stop (sec) = ", self.tstop)
            print("expected maxinum number of bins = ", int((self.tstop - self.tstart)/self.timebin))

        else:
            print("ERROR : file does not exist. ", eventfile)


    def plot_lc_entire(self):
        """
        plot entire lightcurves
        """
        F = plt.figure(figsize=(12,8.))
#        plt.subplots_adjust(wspace = 0.1, hspace = 0.3, top=0.9, bottom = 0.08, right=0.92, left = 0.1)
        ax = plt.subplot(1,1,1)
        plt.title(self.filenametag)
        plt.xscale('linear')
        plt.yscale('linear')
        plt.grid(True)
        plt.xlabel(r'Time (sec)')
        plt.ylabel(r'Count Rate ($cs^{-1}$)')
        plt.errorbar(self.t, self.v, self.ve, fmt='ro-', label=self.filenametag, alpha = 0.9)
        plt.legend(numpoints=1, frameon=False, loc="best")
        outputfiguredir = "fig_lc"
        subprocess.getoutput('mkdir -p ' + outputfiguredir)
        outfile = outputfiguredir + "/" + self.filenametag + "_lc_entire.png"

        plt.savefig(outfile)
        if os.path.isfile(outfile):
            print("saved as ", outfile)
        else:
            print("[ERROR] couldn't save as ", outfile)


    def create_good_lc(self, anum = 5, length = 512, debug = False):
        """
        length の間に、データ抜けが一つもなければ、good と判定する。
        もし、データに飛びがあれば、そこまでのデータは破棄し、データの飛びが
        終わったところから、新しく length 分のデータを集める。
        """
        self.good_lc_t = np.array([])  # good 判定された時間
        self.good_lc_v = np.array([])  # good 判定された値
        self.good_lc_ve = np.array([]) # good 判定されたエラー

        tmp_t = []
        tmp_v = []
        tmp_ve = []
        num_of_good_interval = 0    # good と判定されたインターバルの数。
        num_of_discarded_events = 0 # good と判定されなかったイベントの数。


        for i, (t, v, ve, tdiff) in enumerate(zip(self.t, self.v, self.ve, self.dt_minus_timebin)):


            if np.abs(tdiff) > 0.5 * self.timebin: # 0.5 is not important. very small number in tdiff means time is contineous.
                """ データに飛びを検出。ここまでに集めたデータを破棄する。 """
                print(".-.-.-.-.-. time jump has occurred. ", i, t, v, tdiff)
                num_of_discarded_events = num_of_discarded_events + len(tmp_t)
                # initialize buffer arrays
                tmp_t = []
                tmp_v = []
                tmp_ve = []

            else:
                tmp_t.append(t)
                tmp_v.append(v)
                tmp_ve.append(ve)

                if len(tmp_t) == length:
                    """ データに飛びがなく、length 分の集積ができたので、配列に保存する。"""
                    # store data
                    self.good_lc_t  = np.append(self.good_lc_t, tmp_t)
                    self.good_lc_v  = np.append(self.good_lc_v, tmp_v)
                    self.good_lc_ve = np.append(self.good_lc_ve, tmp_ve)

                    num_of_good_interval = num_of_good_interval + 1
                    # initialize buffer arrays
                    tmp_t = []
                    tmp_v = []
                    tmp_ve = []

        # print status
        print("def create_good_lc() ")
        print("num_of_good_interval (event x length) = ", num_of_good_interval)
        print("num_of_discarded_events (event) = ", num_of_discarded_events, "\n")

        if debug:
            print("self.good_lc_t",  len(self.good_lc_t))
            print("self.good_lc_v",  len(self.good_lc_v))
            print("self.good_lc_ve", len(self.good_lc_ve))

        if num_of_good_interval < anum:
            print("[ERROR] number of good interval", num_of_good_interval, " is smaller than one average number ", anum )
            sys.exit()

    def calc_fft(self, filtname=None, pltflag = False, anum = 5, length = 512, dccut = True, debug = False):

        print("start : in calc_fft()")
        # FFT を lehgth の長さの時系列に対して、anum 回行い、平均をとる。

        # 平均に必要な配列を貯めるためのバッファ用の1次元配列。
        tmp_tlist = np.array([])
        tmp_vlist = np.array([])

        num_of_averaged_fft = 0 # 平均化に成功した回数をカウントする

        # FFTした後の配列数を計算 (DCカットした後)
        if (length%2==0):
            num_of_fftoutput = int(length/2) # 偶数の場合は、2で割る。
        else:
            print("[ERROR] Please choose even number for length ", length)
            sys.exit() # length が奇数は、通常は使わないので、エラーを吐いて終了する。

        # 空の配列を取得する。numpy で2次元配列として append するために、2次元配列のから配列を用意する。
        self.freq_ave     = np.empty((0, num_of_fftoutput), float)
        self.real_ave     = np.empty((0, num_of_fftoutput), float)
        self.imag_ave     = np.empty((0, num_of_fftoutput), float)
        self.power_ave    = np.empty((0, num_of_fftoutput), float)
        self.phase_ave    = np.empty((0, num_of_fftoutput), float)
        self.power_avenum = np.array([])
        self.time_ave     = np.array([])


        for i, (tlist, vlist) in enumerate(zip(self.good_lc_t, self.good_lc_v)):

            # 配列を、length 分足しこむ。
            tmp_tlist = np.append(tmp_tlist, tlist)
            tmp_vlist = np.append(tmp_vlist, vlist)

            # 長さが1以上で、平均回数 x length で割り切れる要素数の場合
            if len(tmp_tlist) > 0 and (len(tmp_tlist)%(anum*length) == 0):

                # FFT の計算を行う。
                # freq_ave 周波数(Hz) real_ave (実部の2乗), imag_ave(虚部の2乗), power_ave(絶対値の2乗), avenum(平均回数)
                freq_ave, real_ave, imag_ave, power_ave, avenum, phase_ave = \
                     average_scipy_fft( tmp_vlist, self.timebin, filtname=filtname, \
                        pltflag=pltflag, outname = self.filenametag, anum = anum, length = length, debug = debug)

                if dccut: # 通常はDC成分は不要なので、カットする。
                    freq_ave = freq_ave[1:]
                    real_ave = real_ave[1:]
                    imag_ave = imag_ave[1:]
                    power_ave = power_ave[1:]
                    phase_ave = phase_ave[1:]

                num_of_averaged_fft = num_of_averaged_fft + 1 # 平均回数を足しこむ

                self.time_ave     = np.append(self.time_ave, 0.5 * (tmp_tlist[0] + tmp_tlist[-1]) ) # 時間の中心地を計算
                self.power_avenum = np.append(self.power_avenum, avenum) # 平均回数を保存

                self.freq_ave  = np.append(self.freq_ave,  [freq_ave], axis=0)
                self.real_ave  = np.append(self.real_ave,  [real_ave], axis=0)
                self.imag_ave  = np.append(self.imag_ave,  [imag_ave], axis=0)
                self.power_ave = np.append(self.power_ave, [power_ave], axis=0)
                self.phase_ave = np.append(self.phase_ave, [phase_ave], axis=0)

                # init buffer arrays
                tmp_tlist = np.array([])
                tmp_vlist = np.array([])
            else:
                pass # 平均するには要素数がまだ足りない。

        # print status
        print("num_of_averaged_fft = ", num_of_averaged_fft)
        print("finish : in calc_fft()")

    def plot_fft(self):
        """
        plot fft
        """
        F = plt.figure(figsize=(12,8.))
#        plt.subplots_adjust(wspace = 0.1, hspace = 0.3, top=0.9, bottom = 0.08, right=0.92, left = 0.1)
        ax = plt.subplot(1,1,1)
        plt.title(self.filenametag)
        plt.xscale('log')
        plt.yscale('log')
        plt.grid(True)
        plt.xlabel(r'Frequency(Hz)')
        plt.ylabel(r'Power ($rms/\sqrt{Hz}$)')

        for fre, power, time in zip(self.freq_ave, self.power_ave, self.time_ave):
            plt.errorbar(fre, np.sqrt(power), fmt='-', label=" t = " + str(time) + "" , alpha = 0.8) # power はパワーの2乗、ルートをとって表示。
        plt.legend(numpoints=1, frameon=False, loc="best")
        outputfiguredir = "fig_fft"
        subprocess.getoutput('mkdir -p ' + outputfiguredir)

        outfile = outputfiguredir + "/" + self.filenametag + "_fft.png"
        plt.savefig(outfile)
        if os.path.isfile(outfile):
            print("saved as ", outfile)
        else:
            print("[ERROR] couldn't save as ", outfile)


    def plot_phase(self):
        """
        plot phase
        """
        F = plt.figure(figsize=(12,8.))
        ax = plt.subplot(1,1,1)
        plt.title(self.filenametag)
        plt.xscale('linear')
        plt.yscale('linear')
        plt.grid(True)
        plt.xlabel(r'Frequency (Hz)')
        plt.ylabel(r'unwarp phase (radians)')

        for fre, phase, time in zip(self.freq_ave, self.phase_ave, self.time_ave):
            plt.errorbar(fre, phase, fmt='-', label=" t = " + str(time) + "" , alpha = 0.8) # power はパワーの2乗、ルートをとって表示。
        plt.legend(numpoints=1, frameon=False, loc="best")
        outputfiguredir = "fig_phase"
        subprocess.getoutput('mkdir -p ' + outputfiguredir)

        outfile = outputfiguredir + "/" + self.filenametag + "_phase.png"
        plt.savefig(outfile)
        if os.path.isfile(outfile):
            print("saved as ", outfile)
        else:
            print("[ERROR] couldn't save as ", outfile)


    def dump_text_fft(self):
        """
        dump fft data into text file
        """
        odir = "text_fft"
        subprocess.getoutput('mkdir -p ' + odir)
        for i, (fre, power, time) in enumerate(zip(self.freq_ave, self.power_ave, self.time_ave)):

            outfile = odir + "/" + self.filenametag + "_fft_" + str("%06d" % i) + "_" + str(time) + ".txt"
            fout = open(outfile, "w")
            for f, p in zip(fre,power):
                outstr=str(f) + " " + str(p) + "\n" # 周波数、パワーの2乗
                fout.write(outstr)
            fout.close()

            if os.path.isfile(outfile):
                print("saved as ", outfile)
            else:
                print("[ERROR] couldn't save as ", outfile)


def main():

    """ スクリプトを実行すると、ここから始まる。 """

    curdir = os.getcwd() # 現在のディレクトリを取得

    """ オプションの設定 """
    # optparse の設定
    usage = u'%prog fileList [-d] [-p] [-e 1] [-c 4] [-a 12] [-l 512]'
    version = __version__
    parser = optparse.OptionParser(usage=usage, version=version)
    # オプションの設定。-- の後の文字が、options の変数になる。
    parser.add_option('-d', '--debug', action='store_true', help='The flag to show detailed information (Flag)', metavar='DEBUG', default=False)
    parser.add_option('-p', '--pltflag', action='store_true', help='to plot time-series data', metavar='PLTFLAG', default=False)
    parser.add_option('-m', '--hlen', action='store', type='int', help='Header length', metavar='HLEN', default=-1)
    parser.add_option('-c', '--clen', action='store', type='int', help='Column length', metavar='CLEN', default=4)
    parser.add_option('-a', '--anum', action='store', type='int', help='Average number', metavar='ANUM', default=12)
    parser.add_option('-l', '--length', action='store', type='int', help='FFT bin number (e.g., 1024, 2048, ..)', metavar='LENGTH', default=256)
    # for setting column number for time, value, and error of value
    parser.add_option('-t', '--tcol', action='store', type='int', help='column number for time', metavar='TCOL', default=0)
    parser.add_option('-s', '--vcol', action='store', type='int', help='column number for value', metavar='VCOL', default=1)
    parser.add_option('-e', '--vecol', action='store', type='int', help='column number for value error (if negative, it skips error column)', metavar='VECOL', default=2)


    options, args = parser.parse_args() # 引数、オプションの取得

    print("=========================================================================")
    print("Start " + __file__ + " " + version )
    print("=========================================================================")

    debug = options.debug
    pltflag = options.pltflag
    hlen = options.hlen
    clen = options.clen
    anum = options.anum
    length = options.length
    # for setting column number for time, value, and error of value
    tcol = options.tcol
    vcol = options.vcol
    vecol = options.vecol;

    print("   (OPTIONS)")
    print("--  debug                            ", debug)
    print("--  pltflag                          ", pltflag)
    print("--  hlen (header number)             ", hlen)
    print("--  clen (column number)             ", clen)
    print("--  anum (average number)            ", anum)
    print("--  length (FFT bin number)          ", length)
    # for setting column number for time, value, and error of value
    print("--  column number for time           ", tcol)
    print("--  column number for value          ", vcol)
    print("--  column number for value error    ", vecol, " (if negative, it skips.)")
    print("do FFT for one length of ", length, " by averaging ", anum, " times" )
    print("========================================================================="  )

    # 引数が1でない場合は、エラーを吐いて終了。
    argc = len(args)
    if (argc < 1):
        print('| STATUS : ERROR ')
        print(parser.print_help())
        quit()

    listname = args[0] # get a file name which contains file names
    filelistfile=open(listname, 'r')

    """ ファイルリストを作成 """
    filelist = []
    for i, filename in enumerate(filelistfile):
        print("\n...... reading a file (", i, ") ", filename )
        filelist.append(filename)

    """ クラスリストを作成 """
    evelist = []
    for i, filename in enumerate(filelist):
        print("\n...... creating a class for a file (", i, ") ", filename)
        eve = lcfile(filename, debug, hlen = hlen, clen = clen, anum = anum, length = length, pltflag = pltflag,\
        	                        tcol = tcol, vcol = vcol, vecol = vecol)
        evelist.append(eve)

    """ 入力データの全ライトカーブをプロットする。(確認用なので飛ばしてもよい。) """
    for i, eve in enumerate(evelist):
        print("...... creating an entire lightcurve (", i, ") ", eve.eventfilename)
        eve.plot_lc_entire()

    """ Create good interval. ひとつの length (xronosのインターバル) が満たされたデータだけを集める。 """
    for i, eve in enumerate(evelist):
        print("\n...... creating good interval (", i, ") ", eve.eventfilename)
        eve.create_good_lc(anum = anum, length = length, debug = debug)

    """ Create calc fft. FFE を実行する。  """
    for i, eve in enumerate(evelist):
        print("\n...... calculating fft (", i, ") ", eve.eventfilename)
        eve.calc_fft(filtname=None, pltflag = pltflag, anum = anum, length = length, debug=debug)

    """ Create plot fft. パワースペクトルをプロットする。 """
    for i, eve in enumerate(evelist):
        print("\n...... calculating fft (", i, ") ", eve.eventfilename)
        eve.plot_fft()

    """ Create plot unwrap phase"""
    for i, eve in enumerate(evelist):
        print("\n...... calculating phase (", i, ") ", eve.eventfilename)
        eve.plot_phase()


    """ Dump FFT results into text files . テキストファイルにダンプする。 """
    for i, eve in enumerate(evelist):
        print("\n...... text dump of fft (", i, ") ", eve.eventfilename)
        eve.dump_text_fft()

    print("=================== Finish ==========================")


if __name__ == '__main__':
    main()
2次元のパワースペクトルを生成
#!/usr/bin/env python
#-*- coding: utf-8 -*-

""" Ana_Timing_plot2d_FFT.py is to plot lightcurves.

This is a python script for timing analysis.
History:
2016-09-13 ; ver 1.0; first draft from scratch
2020-04-24 ; ver 1.2; updated for python3
"""

__author__ =  'Shinya Yamada (syamada(at)tmu.ac.jp'
__version__=  '1.2'

############# scipy ############################################################
import scipy as sp # scipy : 数値演算に必携のモジュール
import scipy.fftpack as sf # FFTモジュール。fortanのFFTライブラリを使用。
################################################################################

############# numpy ############################################################
import numpy as np # numpy : 配列計算に必携のモジュール
from numpy import linalg as LA
################################################################################

############# matplotlib #######################################################
import matplotlib.pylab as plab
import matplotlib.pyplot as plt
from matplotlib.font_manager import fontManager, FontProperties
import matplotlib.colors as colors
import matplotlib.cm as cm
import matplotlib.mlab as mlab
from matplotlib.ticker import MultipleLocator, FormatStrFormatter, FixedLocator
from mpl_toolkits.axes_grid import AxesGrid
# For 3D plot
from mpl_toolkits.mplot3d import Axes3D
from matplotlib.collections import PolyCollection
from matplotlib.colors import colorConverter
# ラベルのサイズ調整
params = {'xtick.labelsize': 13, # x ticks
          'ytick.labelsize': 13, # y ticks
          'legend.fontsize': 10
                    }
plt.rcParams['font.family'] = 'serif' # フォントを指定。(serif はどの環境にもある。)
plt.rcParams.update(params)
from matplotlib.colors import LogNorm
#################################################################################


import random # 乱数発生用モジュール (no use)
import array  # (no use)
import os # OS 関係のモジュール
import sys # system 関係のモジュール
import math # 数学関数モジュール
#import commands # shell のコマンドを使うためのモジュール for python2
import subprocess # shell のコマンドを使うためのモジュール  for python3
# import pyfits # fits モジュール
import optparse # オプション関係
#import yaml
import re # 正規表現サポート
import csv # csv ファイル
import datetime # 時刻サポート
import pytz # timezoze
# jst = pytz.timezone('Asia/Tokyo')

# PyROOT
#import ROOT
#ROOT.gROOT.SetBatch(1)

class fftfile():
    """
    一つのFFTに対して、一つのクラス。
    """
    def __init__ (self, eventfile, debug, hlen = -1, clen = 2):
        """ このクラスの初期化関数 init で、ファイルの中身を読み込む。"""

        eventfile = eventfile.strip() # 改行コードを除く。
        self.eventfilename = eventfile
        self.filenametag_full = eventfile.replace(".txt","")
        self.filenametag = os.path.basename(self.filenametag_full).replace(".txt","").replace(".text","").replace(".csv","").replace(".qdp","")
        self.filenametag = self.filenametag
        self.debug = debug

        #extract header information
        if os.path.isfile(eventfile):
            self.file = open(eventfile)
            self.f = np.array([]) # 周波数(Hz)
            self.v = np.array([]) # パワーの2乗(rms^2/Hz)

            for i, oneline in enumerate(self.file):
                if i > hlen: # skip header
                    list = oneline.split()
                    if list[0][0] is not "!": # skip a line starting with !
                        if len(list) == clen: # check column number of the input file
                            self.f = np.append(self.f, float(list[0]))
                            self.v = np.append(self.v, float(list[1]))

            if debug : print(len(self.f), len(self.v))

            self.df = self.f[1] - self.f[0]
            self.rms_from_ft = np.sqrt(np.sum(self.v) * self.df) # 周波数空間で積分した量。時空間のRMSに一致する。
            self.nbin = len(self.f)

            print("Maximum frequency (Hz) = ", self.f[-1] )
            print("frequency bin (Hz) = ", self.df)
            print("Number of bins = ", self.nbin)
            print("RMS over all frequency = ", self.rms_from_ft)
            self.file.close()

        else:
            print("ERROR : file does not exist. ", eventfile)
            exit

def plot_2d_FFT(evelist, outname = "defaultoutname", pltflag = False):
    """
    plot 2d plot

    fftfile クラスのリストを引数にとり、まとめた結果をプロットする。

    """

    power2d = []
    for eve in evelist:
        power2d.append(eve.v)
    power2d = np.array(power2d)

    x = range(len(evelist)) # 時間方向の一次元配列を作成
    y = evelist[0].f  # 周波数の一次元配列
    X, Y = np.meshgrid(x,y) # 2次元プロットように、2次元配列化を行う。(matplotlib の独自仕様)
    Z = power2d.T # 転置すると、横軸が時間軸になる。

    F = plt.figure(figsize=(12,8.))
#        plt.subplots_adjust(wspace = 0.1, hspace = 0.3, top=0.9, bottom = 0.08, right=0.92, left = 0.1)
    ax = plt.subplot(1,1,1)
    plt.title("Time vs. Frequency")
    plt.xscale('linear')
    plt.yscale('linear')
    plt.grid(True)
    plt.xlabel(r'Number of FFT in order of time')
    plt.ylabel(r'Frequency ($Hz$)')
    ax.set_xlim(x[0],x[-1])
    ax.set_ylim(y[0],y[-1])

    if (X.shape == Y.shape) and (X.shape == Z.shape) : # matplotlib の2次元プロットは、要素数が一致している必要あり。
        plt.pcolormesh( X, Y, Z, norm=LogNorm(vmin=Z.min(), vmax=Z.max()))
        cl = plt.colorbar()
        cl.set_label(r"Power ($rms^2/Hz$)")

    #        plt.legend(numpoints=1, frameon=False, loc="best")
        outputfiguredir = "fft2d_fig"
        subprocess.getoutput('mkdir -p ' + outputfiguredir)
        outfile = outputfiguredir + "/" + outname + "_log.png"
        plt.savefig(outfile)

        if os.path.isfile(outfile):
            print("saved as ", outfile)
        else:
            print("[ERROR] couldn't save as ", outfile)

        if pltflag:
            plt.show()
    else:
        print("\n[ERROR] Please make sure all the following shape are the same.")
        print("The same shape is necessary for matplotlib 2D plot.")
        print(X.shape, Y.shape, Z.shape)


def main():

    """ スクリプトを実行すると、ここから始まる。 """

    curdir = os.getcwd() # 現在のディレクトリを取得

    """ オプションの設定 """
    # optparse の設定
    usage = u'%prog fileList [-d] [-p] [-e 1] [-c 4] [-a 12] [-l 512]'
    version = __version__
    parser = optparse.OptionParser(usage=usage, version=version)
    # オプションの設定。-- の後の文字が、options の変数になる。
    parser.add_option('-d', '--debug', action='store_true', help='The flag to show detailed information (Flag)', metavar='DEBUG', default=False)
    parser.add_option('-p', '--pltflag', action='store_true', help='to plot time-series data', metavar='PLTFLAG', default=False)
    parser.add_option('-e', '--hlen', action='store', type='int', help='Header length', metavar='HLEN', default=-1)
    parser.add_option('-c', '--clen', action='store', type='int', help='Column length', metavar='CLEN', default=2)
    parser.add_option('-o', '--outname', action='store', type='string', help='Output file name', metavar='OUTNAME', default='fft2dplot')

    options, args = parser.parse_args() # 引数、オプションの取得

    print("=========================================================================")
    print("Start " + __file__ + " " + version )
    print("=========================================================================")

    debug   = options.debug
    pltflag = options.pltflag
    hlen    = options.hlen
    clen    = options.clen
    outname = options.outname

    print("   (OPTIONS)")
    print("--  debug                    ", debug)
    print("--  pltflag                  ", pltflag)
    print("--  hlen (header number)     ", hlen)
    print("--  clen (column number)     ", clen)
    print("--  outname                  ", outname)
    print("========================================================================="    )

    # 引数が1でない場合は、エラーを吐いて終了。
    argc = len(args)
    if (argc < 1):
        print('| STATUS : ERROR ')
        print(parser.print_help())
        quit()

    listname = args[0] # get a file name which contains file names
    listnametag = listname.replace(".list","")
    outname = outname + "_" + listnametag
    filelistfile=open(listname, 'r')

    """ ファイルリストを作成 """
    filelist = []
    for i, filename in enumerate(filelistfile):
        print("\n...... reading a file (", i, ") ", filename )
        filelist.append(filename)

    """ クラスリストを作成 """
    evelist = []
    for i, filename in enumerate(filelist):
        print("\n...... creating a class for a file (", i, ") ", filename)
        eve = fftfile(filename, debug, hlen = hlen, clen = clen)
        evelist.append(eve)

    """ Time vs. FFT の 2次元プロットを作る。注) 正確には、時間ではなく、時間順にFFTされたファイルの番号が横軸 """
    print("\n...... creating 2D FFT ")
    plot_2d_FFT(evelist, outname = outname, pltflag = pltflag)

    print("=================== Finish ==========================")


if __name__ == '__main__':
    main()