みなさん、学習や資格について、以下のように考えたことはありませんか?
- これを学習して、いつ活かせるの?
- インプットはしたけど、使う場所が無い
- 資格って意味あるの?
- 技術以外の学習は、特にしようと思わない
やってください。
どんどん学習してください。
資格は業務に寄せた方がいいですが、学習は技術だけでなく、社会人として必要なことを、どんどんインプットした方がいいです。
今回は、「知識」についてPythonで視覚化してみました。
画像とその生成コードをセットにしたので、よろしければ参考にしてください。
知識が増えていく様子の視覚化
まずは、自分の中に新しい知識が増えていく様子を、アニメーションGIFにしました。これらの点が、蓄積された知識です。
点が多いのと少ないのでは、どちらがいいと思いますか?
多い方がいいですよね。

以下は、このGIFの生成コードです。
growing_knowledge.py
from PIL import Image, ImageDraw
import imageio
import numpy as np

# GIFの設定
width, height = 512, 512
frame_count = 50  # 点の数(フレーム数)
filename = "growing_knowledge.gif"

# 点の位置を格納するリスト
dot_positions = []
for _ in range(frame_count):
    x = np.random.randint(0, width)
    y = np.random.randint(0, height)
    dot_positions.append((x, y))

# フレームのリストを初期化
frames = []

for i in range(frame_count):
    # 白背景の画像
    img = Image.new("RGB", (width, height), "white")
    draw = ImageDraw.Draw(img)

    # i番目までの点をすべて描画
    for j in range(i + 1):
        x, y = dot_positions[j]
        size = 5  # 点のサイズ
        draw.ellipse([(x - size, y - size), (x + size, y + size)], fill="black")

    # フレームをリストに追加
    frames.append(img)

# GIFを作成
imageio.mimsave(filename, frames, duration=100)
知識が繋がっていく様子の視覚化
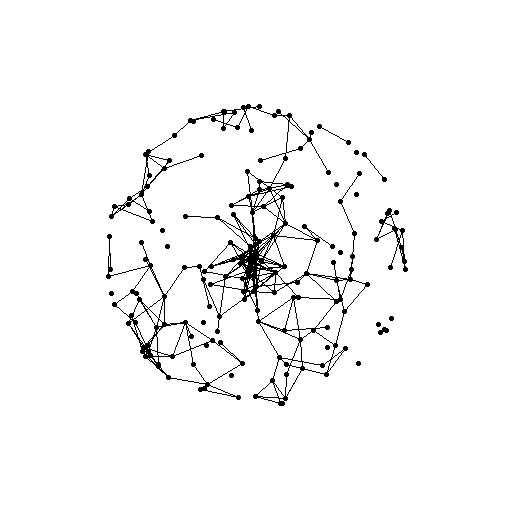
次に、自分の中の知識が繋がっていく様子を視覚化しました。得た知識がどんどん繋がっていくのが分かりますね。
得た知識は、全て使われるわけではありません。
しかし、そもそも点が無いと線にならないんです。
点(知識)はあればあるほど、臨機応変に繋がっていきます。

以下は、このGIFの生成コードです。
connecting_knowledge.py
from PIL import Image, ImageDraw
import imageio
import numpy as np
import random

# GIFの設定
width, height = 512, 512
frame_count = 100  # 点の数(フレーム数)
filename = "connecting_knowledge.gif"

# 点の位置リスト
dot_positions = []
for _ in range(frame_count):
    x = np.random.randint(0, width)
    y = np.random.randint(0, height)
    dot_positions.append((x, y))

# フレームのリスト
frames = []

for i in range(frame_count):
    # 白背景の画像
    img = Image.new("RGB", (width, height), "white")
    draw = ImageDraw.Draw(img)

    # 点を描画
    for j in range(i + 1):
        x, y = dot_positions[j]
        size = 5
        draw.ellipse([(x - size, y - size), (x + size, y + size)], fill="black")

    # 点を線でつなぐ
    if i > 0:
        # 最大5個の点をランダムに選ぶ
        connected_points = random.sample(range(i + 1), min(i+1, 5))
        # 点を線で結ぶ
        for k in range(len(connected_points)-1):
           x1, y1 = dot_positions[connected_points[k]]
           x2, y2 = dot_positions[connected_points[k+1]]
           draw.line([(x1, y1), (x2, y2)], fill="black", width=2)

    # フレームをリストに追加
    frames.append(img)

# GIFを作成
imageio.mimsave(filename, frames, duration=100)
知識には、様々な形があることを視覚化
ここまでで、知識は多い方がいい、というのは理解できましたね。
知識には、人それぞれ、様々な形があります。
もしかしたら、あなたの知識は
ランダムに繋がっていたり
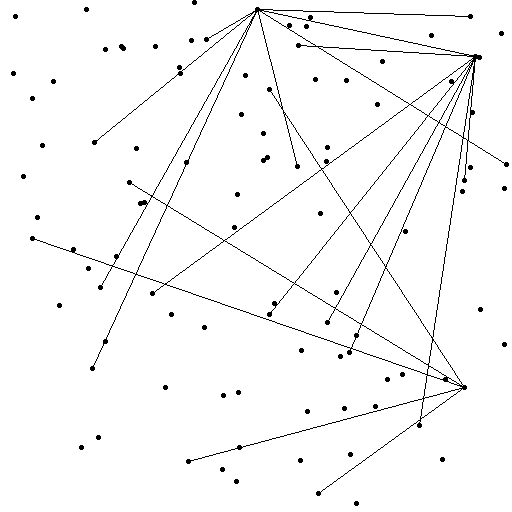
幾何学模様だったり

あるいは球体のようだったりするかもしれません。
これらの図形が美しく完成するには、様々な点(知識)が必要です。
どれだけの知識を得るのか、得た知識をどのような形にするのか、それはあなた次第です。
以下は、上記三点画像のコードです。
from PIL import Image, ImageDraw
import numpy as np
import random
import math

# --- 平面図形 ---
def create_plane_figure(width, height, num_points, filename):
    img = Image.new("RGB", (width, height), "white")
    draw = ImageDraw.Draw(img)

    points = []
    for _ in range(num_points):
        x = np.random.randint(0, width)
        y = np.random.randint(0, height)
        points.append((x, y))

    max_connections = num_points // 5  # 最大接続数を制限
    connections = 0
    for i in range(num_points):
        for j in range(i + 1, num_points):
            if connections < max_connections and random.random() < 0.1:
                draw.line([points[i], points[j]], fill="black", width=1)
                connections += 1

    for x, y in points:
        draw.ellipse([(x - 2, y - 2), (x + 2, y + 2)], fill="black")

    img.save(filename)


# --- 幾何学模様 ---
def create_complex_geometric_pattern(width, height, filename):
    img = Image.new("RGB", (width, height), "white")
    draw = ImageDraw.Draw(img)

    center_x = width // 2
    center_y = height // 2

    num_polygons = 30  # 描画する多角形の個数
    num_sides = 3     # 多角形の辺の数
    radius = min(width, height) // 2 * 0.8  # 多角形の半径

    for i in range(num_polygons):
        # 10度加算する
        angle = i * 360.0 / num_polygons + 10
        points = []
        # 多角形の頂点座標
        for j in range(num_sides):
            # 回転を適用
            theta = 2 * math.pi * j / num_sides + math.radians(angle)
            x = center_x + radius * math.cos(theta)
            y = center_y + radius * math.sin(theta)
            points.append((x, y))

            draw.ellipse([(x - 2, y - 2), (x + 2, y + 2)], fill="black")

        # 多角形の辺を描画
        for k in range(num_sides):
            draw.line([points[k], points[(k+1)%num_sides]], fill="black", width=1)

        # 中心と頂点を結ぶ
        for x,y in points:
          draw.line([(center_x, center_y), (x,y)], fill = "black", width=1)

    img.save(filename)


# --- 球体 ---
def create_sphere(width, height, radius, filename):
    img = Image.new("RGB", (width, height), "white")
    draw = ImageDraw.Draw(img)

    center_x = width // 2
    center_y = height // 2

    num_points = 200  # 点の数
    points = []
    for _ in range(num_points):
        # 球面座標を生成
        phi = random.uniform(0, 2 * np.pi)
        theta = random.uniform(0, np.pi)

        # 3D座標に変換
        x = center_x + radius * np.sin(theta) * np.cos(phi)
        y = center_y + radius * np.sin(theta) * np.sin(phi)

        points.append((x,y))
        draw.ellipse([(x-2, y-2), (x+2, y+2)], fill="black")

    # 点を線でつなぐ
    for i in range(num_points):
        for j in range(i + 1, num_points):
            distance = np.sqrt((points[i][0] - points[j][0])**2 + (points[i][1] - points[j][1])**2)
            # 距離と確率で線を引くかどうかを決定
            if distance < radius * 0.3 and random.random() < 0.2:
               draw.line([points[i], points[j]], fill="black", width=1)

    img.save(filename)


# --- 実行 ---
create_plane_figure(512, 512, 100, "plane_figure.png")
create_complex_geometric_pattern(512, 512, "complex_pattern.png")
create_sphere(512, 512, 150, "sphere.png")
まとめ
知識は多い方がいいです。
そして、その知識は、あなた次第で、どのような形にもなります。
積極的に、様々な知識を得て、あなただけの、唯一無二の図形を完成させてはいかがでしょうか。