$ cat test1.py
import matplotlib
import matplotlib.pyplot as plt
import pandas as pd

plt.style.use('ggplot')

df = pd.read_csv("dummy.csv")


print(df.info)
print(df['num_of_days'])

plt.figure(figsize=(14, 7))

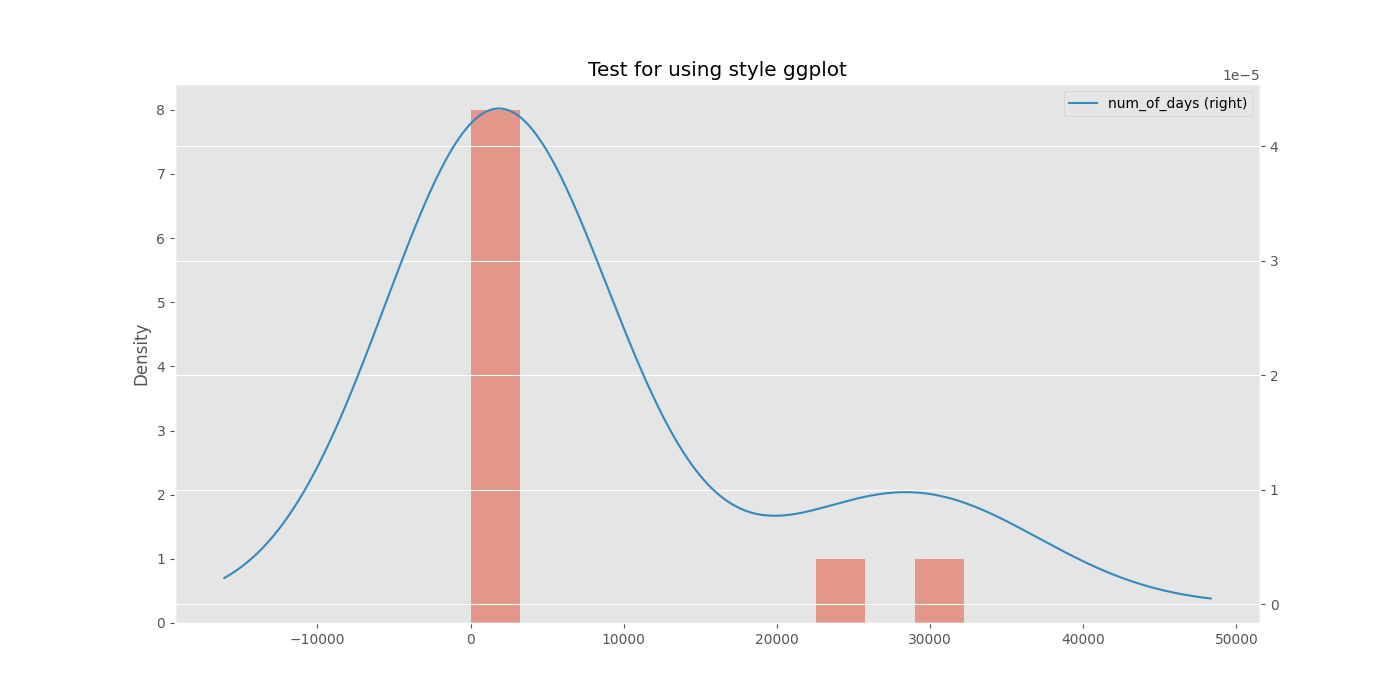
df['num_of_days'].plot(kind="hist", bins=len(df), alpha=0.5)
df['num_of_days'].plot(kind="kde", secondary_y=True)

plt.title("Test for using style ggplot")
plt.legend()

plt.show()
CSVデータ:
$ cat dummy.csv
id,num_of_days
1,20
2,250
3,20
4,2902
5,2980
6,2952
7,2920
8,25022
9,2480
10,32220
こちらは、plotlineを使った例:
# !/usr/bin/env python3

import pandas as pd
import numpy as np
from pandas.api.types import CategoricalDtype
from plotnine import *
from plotnine.data import mpg

print(mpg)
"""
    manufacturer   model  displ  year  cyl  ... drv cty  hwy  fl    class
0           audi      a4    1.8  1999    4  ...   f  18   29   p  compact
1           audi      a4    1.8  1999    4  ...   f  21   29   p  compact
2           audi      a4    2.0  2008    4  ...   f  20   31   p  compact
3           audi      a4    2.0  2008    4  ...   f  21   30   p  compact
4           audi      a4    2.8  1999    6  ...   f  16   26   p  compact
..           ...     ...    ...   ...  ...  ...  ..  ..  ...  ..      ...
229   volkswagen  passat    2.0  2008    4  ...   f  19   28   p  midsize
230   volkswagen  passat    2.0  2008    4  ...   f  21   29   p  midsize
231   volkswagen  passat    2.8  1999    6  ...   f  16   26   p  midsize
232   volkswagen  passat    2.8  1999    6  ...   f  18   26   p  midsize
233   volkswagen  passat    3.6  2008    6  ...   f  17   26   p  midsize

[234 rows x 11 columns]
"""

g = (ggplot(mpg)     # defining what data to use
     + aes(x='class')    # defining what variable to use
     + geom_bar(size=20)  # defining the type of plot to use
     )

g.save("test1.png", limitsize=True, verbose=True)

