3行で
-
glob.globフォルダ一覧を取得。 - (必要あれば)フォルダ毎に処理を実行
subprocess.Popen -
pandasでフォルダ毎の出力テキストファイルをまとめてDataFrame化しデータを整理。
フォルダ名一覧を取得
標準バージョン(標準環境でOK)
import os
dir = [d for d in os.listdir(".") if os.path.isdir(d)]
よりかっこいい方法(正規表現使用可能)
Windows
import glob
dir = glob.glob(os.path.join("*",""))
Mac
dir = glob.glob("*/")
正規表現使用例
フォルダ case01, case02, ... を探す例
dir = glob.glob(os.path.join("case*",""))
もし、テキストファイル(.txt)だけ取得したければ。
dir = glob.glob("*.txt")
フォルダ毎に処理プログラムを実行
import shutil
import subprocess

for f in dir:

    # copy files from local folder to target folder
    cp_files=["Addup_win.py","y.input"]
    for fi in cp_files:
        shutil.copy(fi,f)

    # remove files at target folder
    rm_files=['y.out','out.tsv']
    for fi in rm_files:
        if os.path.exists(os.path.join(f,fi)):
            os.remove(os.path.join(f,fi))

    subprocess.Popen(["python","Addup_win.py"],cwd=f)
pandsでフォルダごとに整理されたテキストデータを処理
データはタブ形式(.tsv)で、左からインデックス列、データ列を想定。

データの読み込みは、上記の処理プログラム失敗の可能性があるので、try:で対応。エラーフォルダは出力する必要あり。
indexは、フォルダ名から処理を入れて整えておいた方が後々便利。
import pandas as pd

dfs=pd.DataFrame()

for f in dir:
    # case01\\ => case01
    index_name = os.path.split(f)[0]

    # Error handle
    try:
        # Data structure {col.0 : index, col.1 : Data}
        df = pd.read_csv(os.path.join(f,"out.tsv"),sep='\t',header=None,index_col=0)
        dfs[index_name]=df.iloc[:,0]
    except:
        print("Error in {0}".foramt(index_name))

# make index
dfs.index = df.index
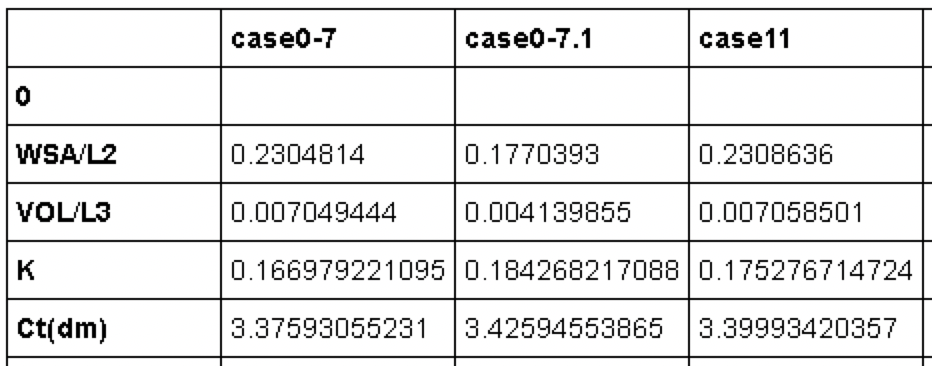
データを確認してみる。
(なぜが”0”行が入っているが、後で消えるので気にしない)
dfs.head()
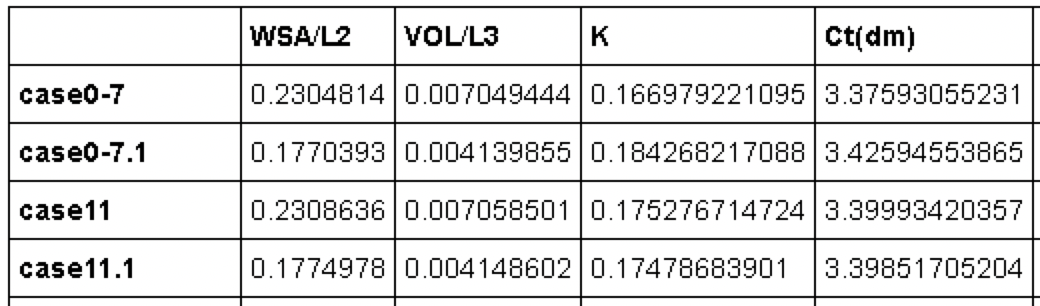
pandasで何らか処理
まず、行と列を入れ替えた方が処理しやすい。
dfsT = dfs.T
まず、欠損データ(NaN)の処理。
dfsT = dfsT.dropna()
ここからは適当に。
たとえば、ファンシーインデックスを使って、条件付きのデータを処理する。
(ここでは、WSA/L2列が0.2以上のデータを出す例)
dfsT_select = dfsT[dfsT["WSA/L2"] > 0.2]
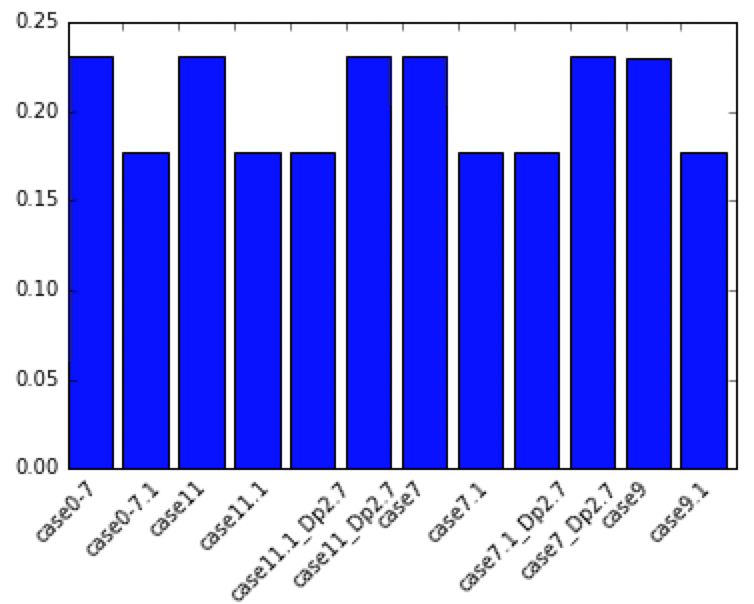
matplotlibによる可視化
import matplotlib.pyplot as plt

plt.bar(range(len(dfsT)),dfsT["WSA/L2"], \
        tick_label=dfsT.index)
plt.show()

横軸の調整
fig, ax = plt.subplots()
ax.bar(range(len(dfsT)),dfsT["WSA/L2"], \
        tick_label=dfsT.index)
labels = ax.get_xticklabels()
plt.setp(labels, rotation=45, fontsize=10);
Excelでの活用(出力)
データをExcelでくれと言う人が多いので、出してあげる。
dfs.to_excel("addup.xlsx")

テキスト形式で良い場合は、例えば以下。
dfs.to_csv("addup.tsv",sep='\t')