ラズパイにインストールした Grafana のダッシュボードに自作した Panel プラグインを表示する検証を行う機会がありましたので、ここにやり方をまとめておきます。
環境
- ラズパイ 3B+
- Grafana ( バージョン:v10.1.1 (0cfa76b22d) ) をインストールします
- Windows 10 Pro
- Grafana にアクセスします
- Ubuntu 22.04.2 LTS
- プラグイン開発環境です
- WSL2 を使います
ラズパイの OS は次の通りです。
pi@raspberrypi:~ $ lsb_release -a
No LSB modules are available.
Distributor ID: Raspbian
Description:    Raspbian GNU/Linux 11 (bullseye)
Release:        11
Codename:       bullseye
準備
・ラズパイ
Grafana をインストールします。
Grafana Labs にインストール方法が紹介されているので、これの通りに進めていきます。
インストールが終わったら、Windows 機から http://<ラズパイのIPアドレス>:3000 にアクセスしてログイン確認を行います。
ID とパスワード は、ともに admin となります。

・Ubuntu
今回は Ubuntu 22.04 LTS 環境でプラグイン開発を行います。WSL2 を使用しました。
環境を用意できたら、開発時に使用する nodejs, npm, yarn をインストールしておきます。バージョンは次の通りです。
- nodejs: v18.17.1
- npm: v9.6.7
- yarn: 1.22.19
自作 プラグインをビルドするまで
Grafana Labs のチュートリアルを参考に進めていきます。
まず最初に、Ubuntu 機に作業用ディレクトリを作成します。
今回は grafana-plugins という名称で作成しました。
$ mkdir grafana-plugins
作業用ディレクトリを作成したら、次のコマンドを実行して自作プラグインの雛形を作成します。
※執筆時の @latest は @1.12.2 となりました。
$ npx @grafana/create-plugin@latest
コマンドを実行すると対話形式でいくつか質問をされるので、それらに回答していくと雛形が作成されます。
$ npx @grafana/create-plugin@latest
Need to install the following packages:
  @grafana/create-plugin@1.12.2
Ok to proceed? (y) y
npm WARN deprecated urix@0.1.0: Please see https://github.com/lydell/urix#deprecated
npm WARN deprecated source-map-url@0.4.1: See https://github.com/lydell/source-map-url#deprecated
npm WARN deprecated resolve-url@0.2.1: https://github.com/lydell/resolve-url#deprecated
npm WARN deprecated source-map-resolve@0.5.3: See https://github.com/lydell/source-map-resolve#deprecated
? What is going to be the name of your plugin? test-panel
? What is the organization name of your plugin? hoge
? How would you describe your plugin? my first panel plugin
? What type of plugin would you like? panel
? Do you want to add Github CI and Release workflows? No
? Do you want to add a Github workflow for automatically checking "Grafana API compatibility" on PRs? No
✔  ++ /home/hoge/grafana-plugins/hoge-test-panel/README.md
✔  ++ /home/hoge/grafana-plugins/hoge-test-panel/src/components/SimplePanel.tsx
✔  ++ /home/hoge/grafana-plugins/hoge-test-panel/src/module.ts
✔  ++ /home/hoge/grafana-plugins/hoge-test-panel/src/plugin.json
✔  ++ /home/hoge/grafana-plugins/hoge-test-panel/src/types.ts
✔  ++ /home/hoge/grafana-plugins/hoge-test-panel/.config/.eslintrc
✔  ++ /home/hoge/grafana-plugins/hoge-test-panel/.config/.prettierrc.js
✔  ++ /home/hoge/grafana-plugins/hoge-test-panel/.config/Dockerfile
✔  ++ /home/hoge/grafana-plugins/hoge-test-panel/.config/jest-setup.js
✔  ++ /home/hoge/grafana-plugins/hoge-test-panel/.config/jest.config.js
✔  ++ /home/hoge/grafana-plugins/hoge-test-panel/.config/jest/mocks/react-inlinesvg.tsx
✔  ++ /home/hoge/grafana-plugins/hoge-test-panel/.config/jest/utils.js
✔  ++ /home/hoge/grafana-plugins/hoge-test-panel/.config/README.md
✔  ++ /home/hoge/grafana-plugins/hoge-test-panel/.config/tsconfig.json
✔  ++ /home/hoge/grafana-plugins/hoge-test-panel/.config/types/custom.d.ts
✔  ++ /home/hoge/grafana-plugins/hoge-test-panel/.config/webpack/constants.ts
✔  ++ /home/hoge/grafana-plugins/hoge-test-panel/.config/webpack/utils.ts
✔  ++ /home/hoge/grafana-plugins/hoge-test-panel/.config/webpack/webpack.config.ts
✔  ++ /home/hoge/grafana-plugins/hoge-test-panel/.eslintrc
✔  ++ /home/hoge/grafana-plugins/hoge-test-panel/.nvmrc
✔  ++ /home/hoge/grafana-plugins/hoge-test-panel/.prettierrc.js
✔  ++ /home/hoge/grafana-plugins/hoge-test-panel/CHANGELOG.md
✔  ++ /home/hoge/grafana-plugins/hoge-test-panel/cypress.json
✔  ++ /home/hoge/grafana-plugins/hoge-test-panel/cypress/integration/01-smoke.spec.ts
✔  ++ /home/hoge/grafana-plugins/hoge-test-panel/docker-compose.yaml
✔  ++ /home/hoge/grafana-plugins/hoge-test-panel/.gitignore
✔  ++ /home/hoge/grafana-plugins/hoge-test-panel/jest-setup.js
✔  ++ /home/hoge/grafana-plugins/hoge-test-panel/jest.config.js
✔  ++ /home/hoge/grafana-plugins/hoge-test-panel/LICENSE
✔  ++ /home/hoge/grafana-plugins/hoge-test-panel/package.json
✔  ++ /home/hoge/grafana-plugins/hoge-test-panel/src/img/logo.svg
✔  ++ /home/hoge/grafana-plugins/hoge-test-panel/src/README.md
✔  ++ /home/hoge/grafana-plugins/hoge-test-panel/tsconfig.json
✔  +- /home/hoge/grafana-plugins/hoge-test-panel/README.md
✔  +- /home/hoge/grafana-plugins/hoge-test-panel/README.md
✔  +- /home/hoge/grafana-plugins/hoge-test-panel/README.md
✔  updateGoSdkAndModules
✔  printSuccessMessage Congratulations on scaffolding a Grafana panel plugin! 🚀

## What's next?

Run the following commands to get started:

    * cd ./hoge-test-panel
    * npm install to install frontend dependencies.
    * npm run dev to build (and watch) the plugin frontend code.
    * docker-compose up to start a grafana development server. Restart this command after each time you run mage to run your new backend code.
    * Open http://localhost:3000 in your browser to create a dashboard to begin developing your plugin.

Note: We strongly recommend creating a new Git repository by running git init in ./hoge-test-panel before continuing.

    * Learn more about Grafana Plugin Development at https://grafana.com/developers/plugin-tools
今回は、プラグイン名を聞かれた際に test-panel、組織名を聞かれた際に hoge と回答したため、コマンドの実行が完了すると(回答内容に連動して)hoge-test-panel というディレクトリが作成されます。
これが雛形となるプロジェクトファイル一式になります。
cd コマンドで hoge-test-panel に移動して、yarn install および yarn build を実行します。
お好みで npm を使って頂いても良いですが、今回は yarn で進めます。
$ cd hoge-test-panel
$ yarn install
$ yarn build
ビルドが成功すると dist ディレクトリが作成されるので、中身を確認しておきます。
$ tree dist
dist
├── CHANGELOG.md
├── LICENSE
├── README.md
├── img
│   └── logo.svg
├── module.js
├── module.js.map
└── plugin.json
ここで、plugin.json の中身を確認しておきます。
id の値は後の工程で使用するためメモしておいてください。
{
  "$schema": "https://raw.githubusercontent.com/grafana/grafana/master/docs/sources/developers/plugins/plugin.schema.json",
  "type": "panel",
  "name": "Test Panel",
  "id": "hoge-test-panel",
  "info": {
    "keywords": ["panel"],
    "description": "My first panel plugin",
    "author": {
      "name": "Hoge"
    },
    "logos": {
      "small": "img/logo.svg",
      "large": "img/logo.svg"
    },
    "links": [],
    "screenshots": [],
    "version": "1.0.0",
    "updated": "2023-09-18"
  },
  "dependencies": {
    "grafanaDependency": ">=10.0.3",
    "plugins": []
  }
}
自作プラグインを Grafana ダッシュボードに表示するまで
ビルドが終わったら、/dist ディレクトリ配下のファイルすべてを Grafana(今回はラズパイ)のプラグインディレクトリにコピーします。
デフォルトでは /var/lib/grafana/plugins になってるようなので、このパスにコピーします。
また、コピーと同時に所有者を grafana にし、アクセス権限設定をしておきます。
sudo chown grafana:grafana -R /var/lib/grafana/plugins/hoge-test-panel
sudo chmod 774 -R /var/lib/grafana/plugins/hoge-test-panel
pi@raspberrypi:~ $ sudo ls -la /var/lib/grafana/plugins/hoge-test-panel
合計 48
drwxrwxr-- 3 grafana grafana  4096  9月 18 21:57 .
drwxr-xr-x 4 grafana grafana  4096  9月 19 19:07 ..
-rwxrwxr-- 1 grafana grafana    52  9月 18 21:57 CHANGELOG.md
-rwxrwxr-- 1 grafana grafana 11356  9月 18 21:57 LICENSE
-rwxrwxr-- 1 grafana grafana  2518  9月 18 21:57 README.md
drwxrwxr-- 2 grafana grafana  4096  9月 18 21:57 img
-rwxrwxr-- 1 grafana grafana  2287  9月 18 21:57 module.js
-rwxrwxr-- 1 grafana grafana  7749  9月 18 21:57 module.js.map
-rwxrwxr-- 1 grafana grafana   584  9月 18 21:57 plugin.json
コピーが終わったら、Grafana 設定ファイルを編集します。
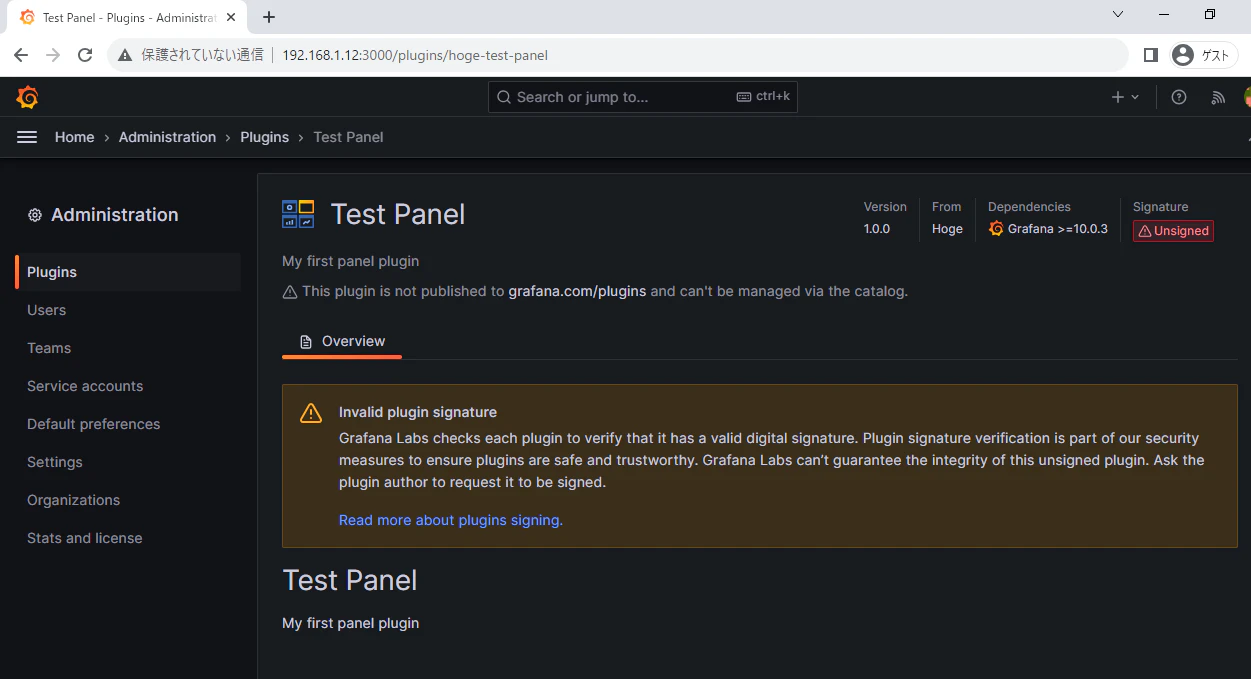
実は、先ほどビルドしてコピーした hoge-test-plugin プラグインは unsigned 状態(署名無し状態)になっているのですが、Grafana は(初期設定では)unsigned プラグインはロードしないようになっているようです。
そこで、unsigned プラグインでも Grafana にロードされるように設定を行います。
/etc/grafana/grafana.ini を開いて [plugins] という箇所を探します。
その中にある allow_loading_unsigned_plugins に、ロードさせたいプラグインの id を comma-separated 形式で記述します。
今回は、事前に plugin.json を開いてメモしておいた hoge-test-panel を記述します。
[plugins]
allow_loading_unsigned_plugins = "hoge-test-panel"
補足ですが、Grafana Labs には、本オプションの使用はお勧めしない(not recommend)との記載がありました。また、プラグインに Sign する方法が紹介されていましたので、興味のある方はご確認ください。
設定ファイルの編集が終わったら、Grafana を再起動します。
$ sudo systemctl restart grafana-server
クライアント機 で Grafana にアクセスして admin でログインし、ホーム画面を表示します。
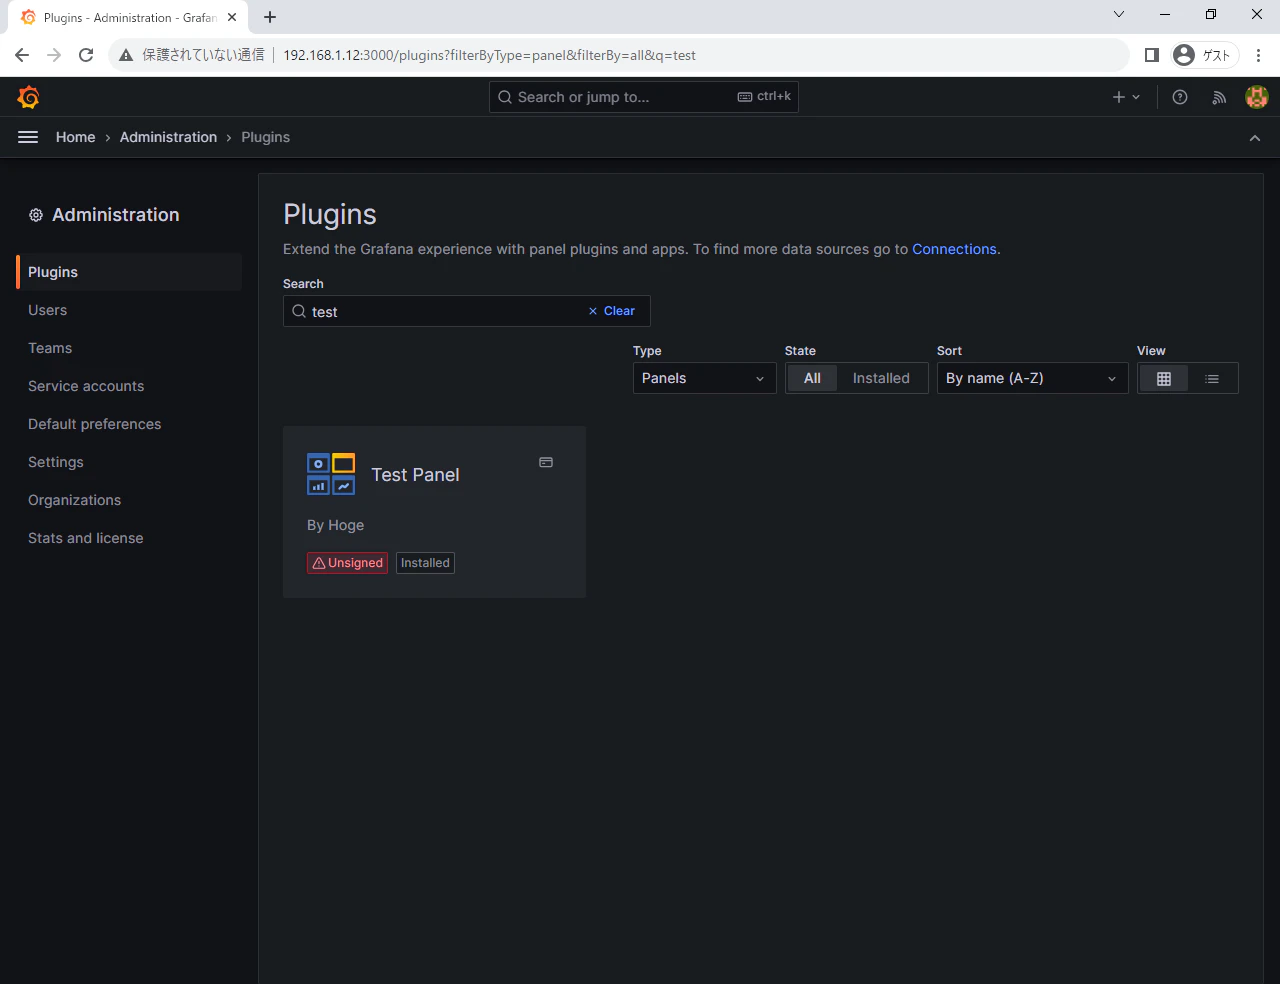
メニューの「Administration」→「Plugins」を選択します。

自作プラグインが Grafana にロードされたかどうかを確認します。
Type に "Panels"、Search に "test" と入力すると、無事に自作プラグインが表示されました。
※ Unsigned と表示されていることも確認できます。
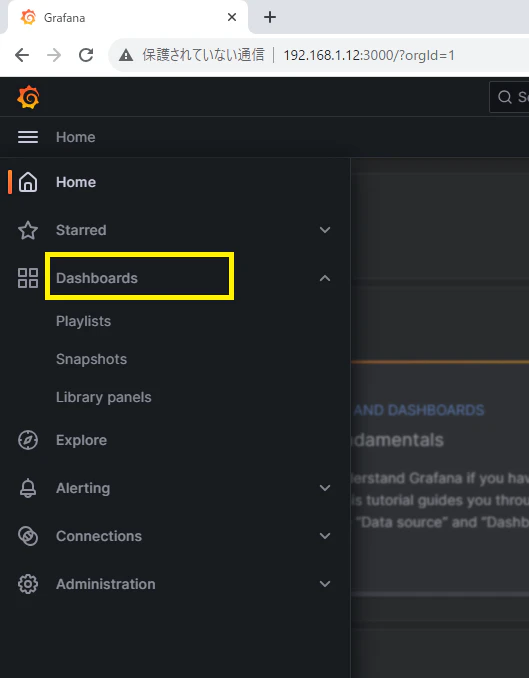
後は、ダッシュボードを作成して、自作プラグインを配置すればよいです。
メニューの「Dashboards」を選択します。
「New」ボタンを押下して「New dashboard」を選択します。

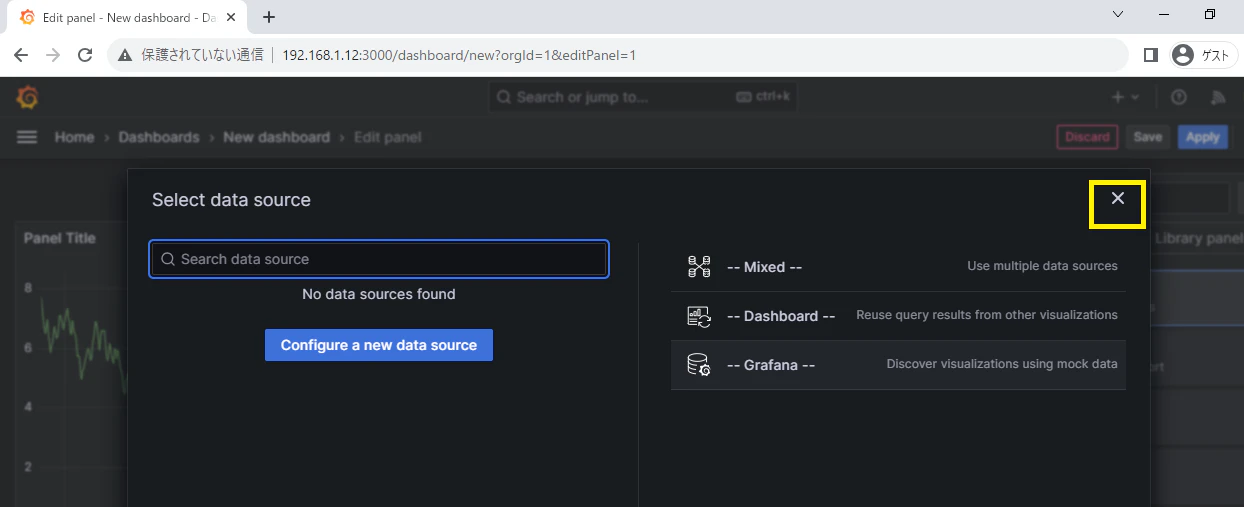
「Add visualization」ボタンを押下します。

データソースの選択画面が表示されたら「×」を選択して閉じます。
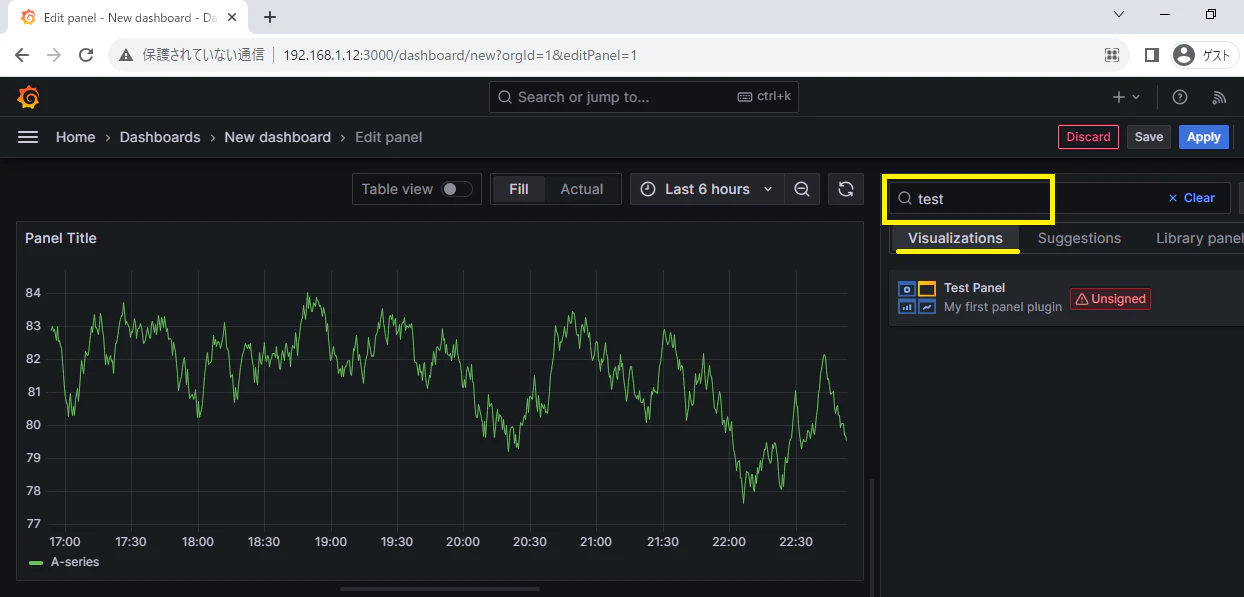
「Visualizations」を選択して、検索窓に "test" を入力すると自作プラグインが表示されるので選択します。
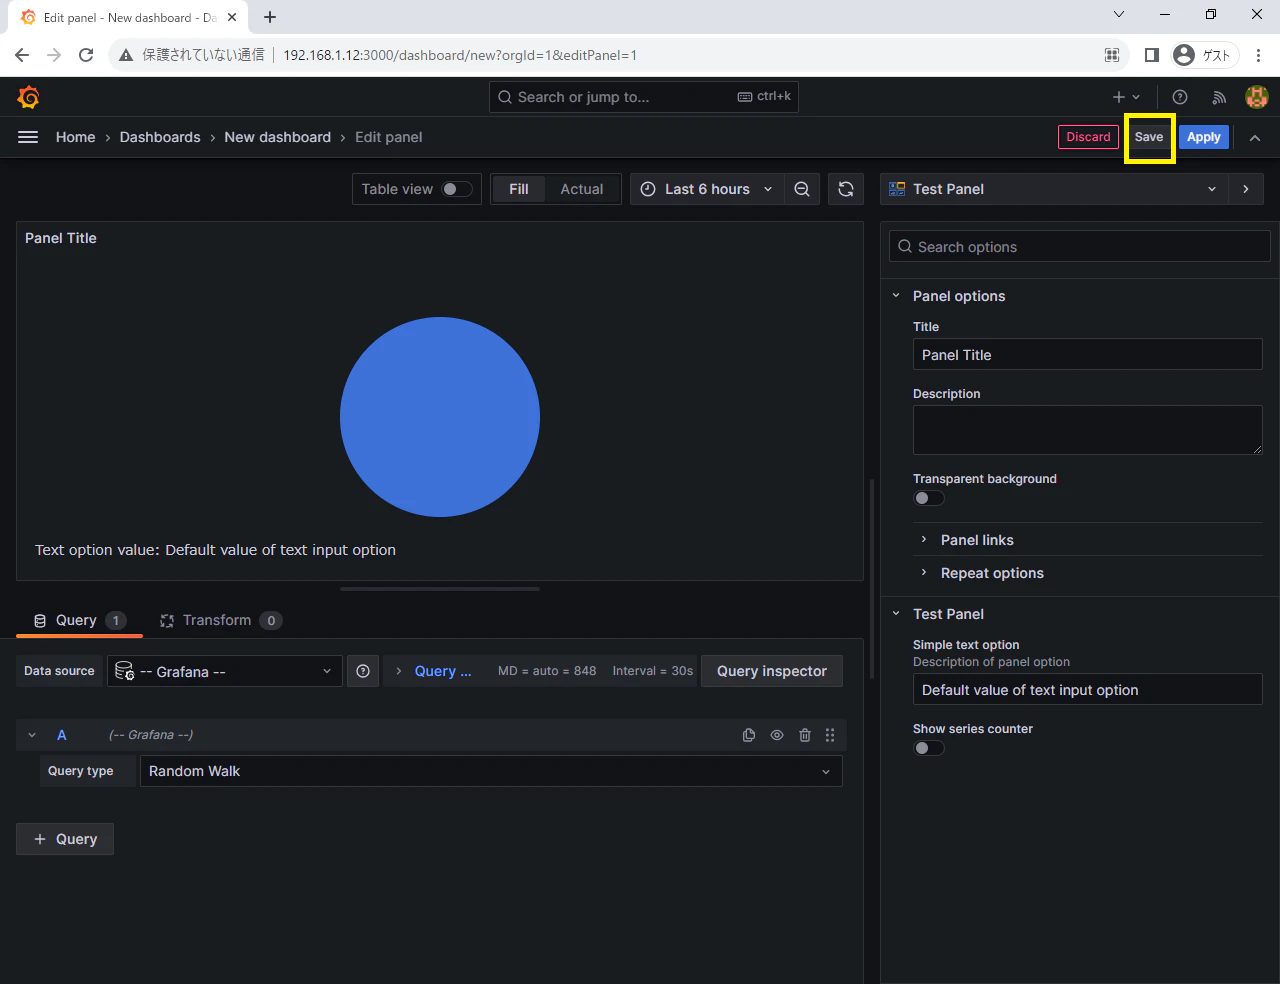
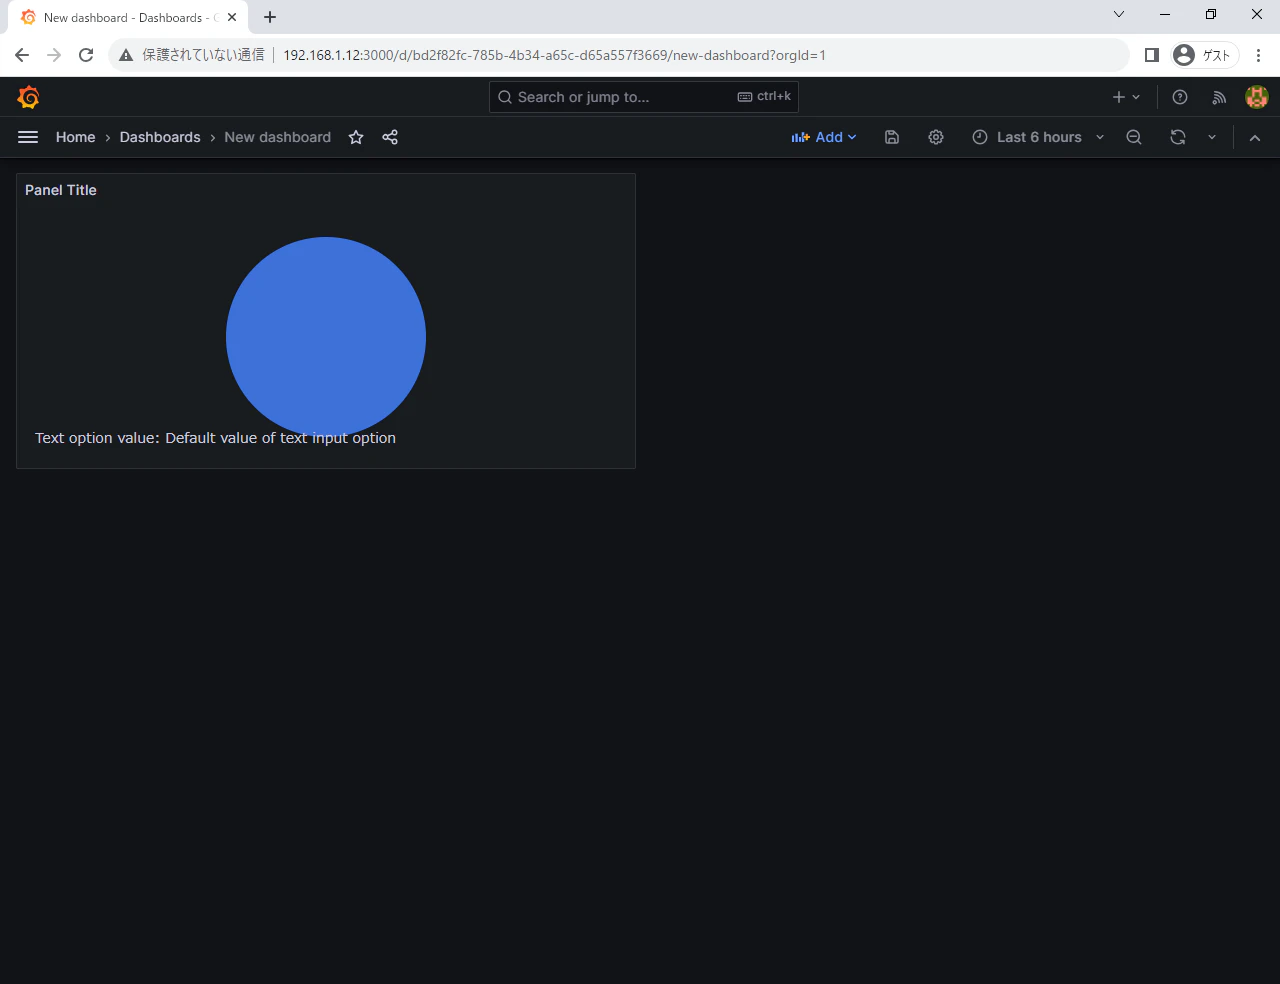
すると、青色の円が表示されたような見た目になります。
このまま、右上の「Save」ボタンを押下して保存します。
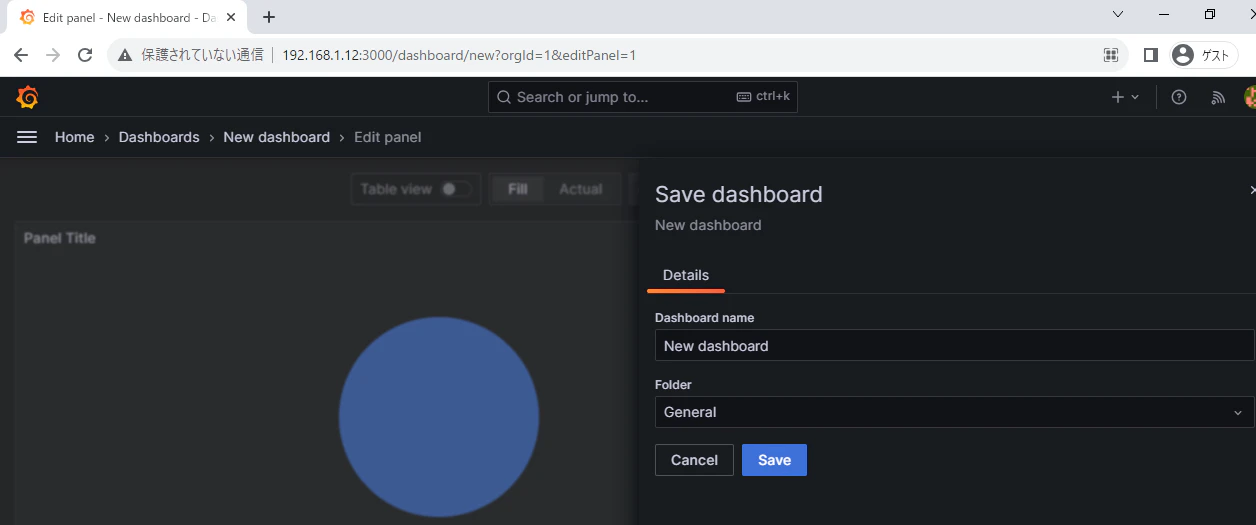
ダッシュボードの名称とフォルダを入力して「Save」ボタンを押下します。
自作 Panel プラグインをダッシュボード表示することができました。
以上となります。
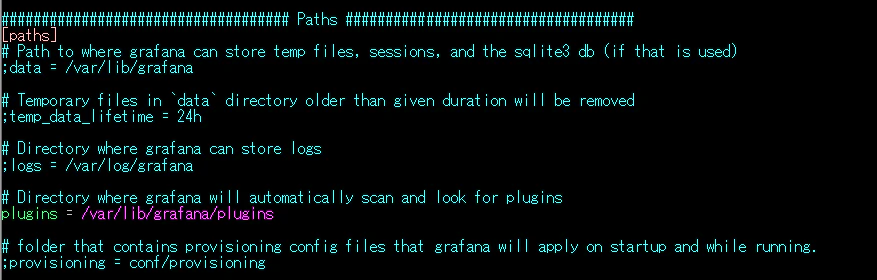
Grafana プラグインディレクトリを変更する方法
デフォルトでは /var/lib/grafana/plugins となっていますが、これを変更する方法は次の通りです。
まず、/etc/grafana/grafana.ini を開いて [paths] の箇所を探します。
そこに plugins という箇所があるので任意のパスを記載します。
設定変更後は、Grafana 再起動をお忘れなく。
さいごに
今回は、雛形に手を加えずにビルドして Grafana ダッシュボードに表示させてみましたが、実際は、雛形の src ディレクトリ配下に自作プラグインの実装コードを書いて、ローカル環境で動作確認を行って、Grafana プラグインディレクトリにコピーして、というフローになるかと思います。
ローカル環境での動作確認については、雛形の中に docker-compose.yaml が含まれているので、これを使って Grafana コンテナ立ち上げて動作確認を行うようですが、今回は、そこの検証は行っていないため本記事では扱っておりません。
本記事が、どなたかのお役に立てると幸いです。