はじめに
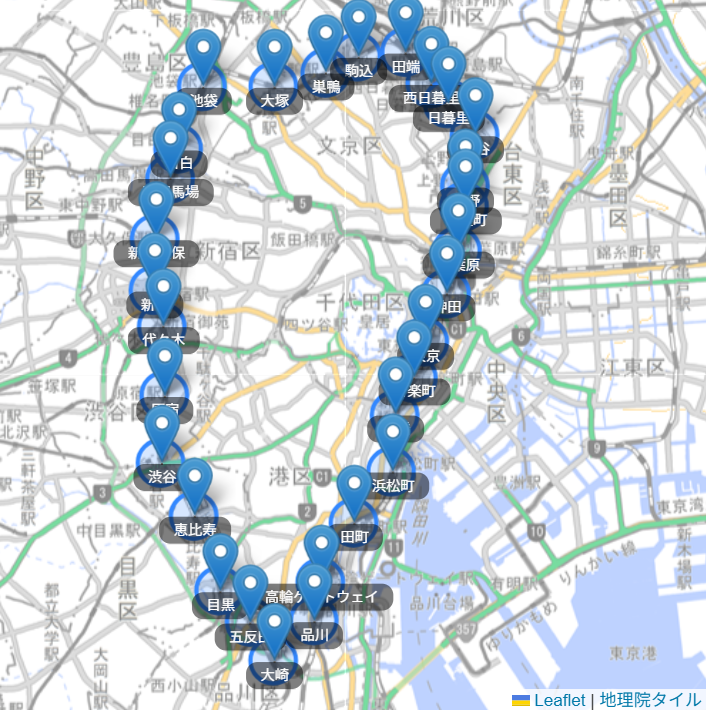
山手線駅周辺の人流オープンデータ(1kmメッシュ)をMapbox地図上に表示させ、平休日・時間帯を切り替えることでどんな変化がみられるか試してみました。
山手線駅の位置情報、1kmメッシュポリゴン、人流データ(滞在人口データ)は、すべてGeoJSONファイルから読み込むようにしました。
山手線駅データ
鉄道駅LOD GeoJSON ダウンローダーからダウンロードしたGeoJSONファイルを利用しました。
人流オープンデータ(1kmメッシュ)
「全国の人流オープンデータ(1kmメッシュ)」(国土交通省)を元にした TerraMap API からのレスポンスデータ(GeoJSONファイル)を利用しました。
「全国の人流オープンデータ(1kmメッシュ)」は2019年~2021年各月の36ヵ月を対象にした、平休日(平日・休日・全日)および 時間帯(昼・深夜・終日)別の「滞在人口データ」であり、それぞれ1ヵ月間の1日あたりの平均値で計算されています。
メッシュデータの対象
2019年5月データの利用
「全国の人流オープンデータ」はコロナウィルス対策調査の一環で公開されたもので、2022年以降のデータは存在しません。この記事では、コロナ禍前である2019年5月の滞在人口データを利用しています。
山手線各駅の半径500m円範囲に限定
駅周辺の滞在人口に注目するため、各駅を中心とした半径500m円に交差するメッシュデータに限定させました1。
GeoJSONファイル
使用したGeoJSONファイルの一部抜粋したものは以下になります。
jinryu-opendata-201905.geojson
{
  "type": "FeatureCollection",
  "features": [
    {
      "type": "Feature",
      "properties": {
        "area": {
          "area": 1.047139255783081
        },
        "data": [
          {
            "is_authorized": true,
            "stat_item_id": 10121,
            "stat_id": "036001900",
            "value": "20199"
          },
          {
            "is_authorized": true,
            "stat_item_id": 10122,
            "stat_id": "036001900",
            "value": "23619"
          },

           // .... 滞在人口データを省略しています
        ],
        "point_coordinates": [
          139.71875,
          35.6125
        ],
        "geocode": "53393537"
      },
      "geometry": {
        "type": "MultiPolygon",
        "coordinates": [
          [
            [
              [
                139.725,
                35.608333333
              ],
              [
                139.7125,
                35.608333333
              ],
              [
                139.7125,
                35.616666667
              ],
              [
                139.725,
                35.616666667
              ],
              [
                139.725,
                35.608333333
              ]
            ]
          ]
        ]
      }
    },

    // .... featureを省略しています
  ]
}
地図アプリ作成
HTML
「平休日」と「時間帯」のラジオボタンを選ぶことで、すべての滞在人口データを表示できるようにしています。
<!DOCTYPE html>
<html lang="ja">
  <head>
    <meta charset="UTF-8" />
    <title>山手線駅周辺の2019年5月滞在人口表示</title>
    <meta name="viewport" content="initial-scale=1,maximum-scale=1,user-scalable=no">
    <link href="https://api.mapbox.com/mapbox-gl-js/v3.10.0/mapbox-gl.css" rel="stylesheet">
    <script src="https://api.mapbox.com/mapbox-gl-js/v3.10.0/mapbox-gl.js"></script>
    <!-- Mapbox Assembly -->
    <link href="https://api.mapbox.com/mapbox-assembly/v1.3.0/assembly.min.css" rel="stylesheet">
    <script src="https://api.mapbox.com/mapbox-assembly/v1.3.0/assembly.js"></script>
    <style>
        body { margin: 0; padding: 0; }
        #map { position: absolute; top: 0; bottom: 0; width: 100%; }

        /* 凡例のスタイル */
        .legend {
          display: flex;
          flex-direction: column;
          gap: 4px;
        }
        .legend-item {
          display: flex;
          align-items: center;
          gap: 8px;
        }
        .legend-color {
          width: 20px;
          height: 20px;
          border: 1px solid #ccc;
        }
        .legend-label {
          font-size: 12px;
        }
        .mapboxgl-popup-tip {
          display: none;
        }
        .mapboxgl-popup-content {
          background-color: rgba(255, 255, 255, 0.1);
          box-shadow: none;
          padding: 8px 10px 5px;
        }
        .popup-text {
          color: white;
          font-size: 16px;
        }
    </style>
  </head>
  <body>
    <div id="map"></div>
    <!-- ラジオボタン-->
    <div class="absolute fl my24 mx24 py12 px12 bg-gray-faint round" style="opacity: 0.8;">
      <h4 class="txt-l txt-bold mb6">2019年5月・平均滞在人口</h4>
      <form id="params">
        <h4 class="txt-m txt-bold mb6">平休日:</h4>
        <div class="mb12 mr12 toggle-group align-center">
          <label class="toggle-container">
            <input name="daytype" type="radio" value="alldays" checked/>
            <div class="toggle toggle--active-null toggle--null">全日</div>
          </label>
          <label class="toggle-container">
            <input name="daytype" type="radio" value="weekdays" />
            <div class="toggle toggle--active-null toggle--null">平日</div>
          </label>
          <label class="toggle-container">
            <input name="daytype" type="radio" value="holidays" />
            <div class="toggle toggle--active-null toggle--null">休日</div>
          </label>
        </div>
        <h4 class="txt-m txt-bold mb6">時間帯:</h4>
        <div class="mb12 mr12 toggle-group align-center">
          <label class="toggle-container">
            <input name="timezone" type="radio" value="alltimes" checked />
            <div class="toggle toggle--active-null toggle--null">終日</div>
          </label>
          <label class="toggle-container">
            <input name="timezone" type="radio" value="daytime" />
            <div class="toggle toggle--active-null toggle--null">昼(11~14時)</div>
          </label>
          <label class="toggle-container">
            <input name="timezone" type="radio" value="midnight" />
            <div class="toggle toggle--active-null toggle--null">深夜(1~4時)</div>
          </label>
        </div>
      </form>
    </div>
    <!-- 凡例 -->
    <div class="absolute fl my24 mx24 py12 px12 bg-gray-faint round" style="opacity: 0.8; bottom: 10px; left: 0;">
      <h4 class="txt-m txt-bold mb6">滞在人口</h4>
      <div class="legend">
        <div class="legend-item">
          <span class="legend-color" style="background-color: #2b83ba;"></span>
          <span class="legend-label">3,000</span>
        </div>
        <div class="legend-item">
          <span class="legend-color" style="background-color: #abdda4;"></span>
          <span class="legend-label">6,000</span>
        </div>
        <div class="legend-item">
          <span class="legend-color" style="background-color: #ffffbf;"></span>
          <span class="legend-label">10,000</span>
        </div>
        <div class="legend-item">
          <span class="legend-color" style="background-color: #fdae61;"></span>
          <span class="legend-label">50,000</span>
        </div>
        <div class="legend-item">
          <span class="legend-color" style="background-color: #d7191c;"></span>
          <span class="legend-label">100,000</span>
        </div>
        <div class="legend-item">
          <span class="legend-color" style="background-color: #800000;"></span>
          <span class="legend-label">200,000</span>
        </div>
      </div>
    </div>

    <script src="map.js"></script>
  </body>
</html>
JavaScript
YOUR_MAPBOX_ACCESS_TOKEN にはご自身のアクセストークンが必要になります。
mapboxgl.accessToken = "YOUR_MAPBOX_ACCESS_TOKEN";

const map = new mapboxgl.Map({
  container: "map",
  style: "mapbox://styles/mapbox/dark-v11",
  center: [139.737124, 35.681236],
  zoom: 11.2,
});

map.on("load", async function () {
  // 駅マーカーの表示
  await drawMarkers();
  // メッシュデータの表示
  await drawPolygons();

  // ラジオボタンの変更イベントを監視
  document.querySelectorAll('input[type="radio"]').forEach((radio) => {
    radio.addEventListener("change", updateSelectedId);
  });
});

// 選択されたIDを更新する関数
function updateSelectedId() {
  const daytype = document.querySelector('input[name="daytype"]:checked').value;
  const timezone = document.querySelector(
    'input[name="timezone"]:checked'
  ).value;
  const selectedId = `${daytype}_${timezone}`;
  console.log("選択されたID:", selectedId);

  // ポリゴンの色を更新
  updatePolygonColor(selectedId);
}

// ポリゴンの色を更新する関数
function updatePolygonColor(selectedId) {
  // 選択されたIDとデータインデックスの対応表
  const dataIndexMap = {
    holidays_daytime: 0,
    holidays_midnight: 1,
    holidays_alltimes: 2,
    weekdays_daytime: 3,
    weekdays_midnight: 4,
    weekdays_alltimes: 5,
    alldays_daytime: 6,
    alldays_midnight: 7,
    alldays_alltimes: 8,
  };

  // マップのスタイルを更新
  const dataIndex = dataIndexMap[selectedId] || 8; // デフォルトは8
  map.setPaintProperty("polygon", "fill-color", getFillColor(dataIndex));
}

// データのインデックス・値に応じた塗り潰し色設定を取得
function getFillColor(dataIndex) {
  return [
    "interpolate",
    ["linear"],
    ["to-number", ["get", "value", ["at", dataIndex, ["get", "data"]]]],
    3000,
    "#2b83ba",
    6000,
    "#abdda4",
    10000,
    "#ffffbf",
    50000,
    "#fdae61",
    100000,
    "#d7191c",
    200000,
    "#800000",
  ];
}

// 駅マーカーの表示
async function drawMarkers() {
  try {
    const response = await fetch("stations.geojson");
    const geojson = await response.json();

    geojson.features.forEach((feature) => {
      const type = feature.geometry.type;

      if (type == "Point") {
        const coordinates = feature.geometry.coordinates;
        new mapboxgl.Marker({
          color: "#314ccd",
        })
          .setLngLat(coordinates)
          .setPopup(
            new mapboxgl.Popup({
              offset: [30, 0],
              closeOnClick: false,
            }).setHTML("<p class='popup-text'>" + feature.properties.name + "</p>")
          )
          .addTo(map);
      }
    });
    return;
  } catch (error) {
    console.error("Error drawing Markers:", error);
  }
}

// メッシュデータの表示
async function drawPolygons() {
  try {
    map.addSource("jinryu_polygons", {
      type: "geojson",
      data: "jinryu-opendata-201905.geojson",
    });

    // ポリゴンの背景色を設定します
    map.addLayer({
      id: "polygon",
      type: "fill",
      source: "jinryu_polygons",
      layout: {},
      paint: {
        "fill-color": getFillColor(8),
        "fill-opacity": 0.5,
      },
    });
    // ポリゴンラインを設定します
    map.addLayer({
      id: "outline",
      type: "line",
      source: "jinryu_polygons",
      layout: {},
      paint: {
        "line-color": "#bcbccc",
        "line-width": 2,
      },
    });
  } catch (error) {
    console.error("Error drawing Polygons:", error);
  }
}
表示結果
実際に地図アプリで滞在人口を表示し、平休日・時間帯を切り替えてみる様子が以下になります。

平日の昼が最も高い滞在人口を記録し、ほとんどの駅周辺で滞在人口が高くなっています。対して休日の昼は、池袋・新宿・東京駅周辺・品川で高い滞在人口が目立ちます。
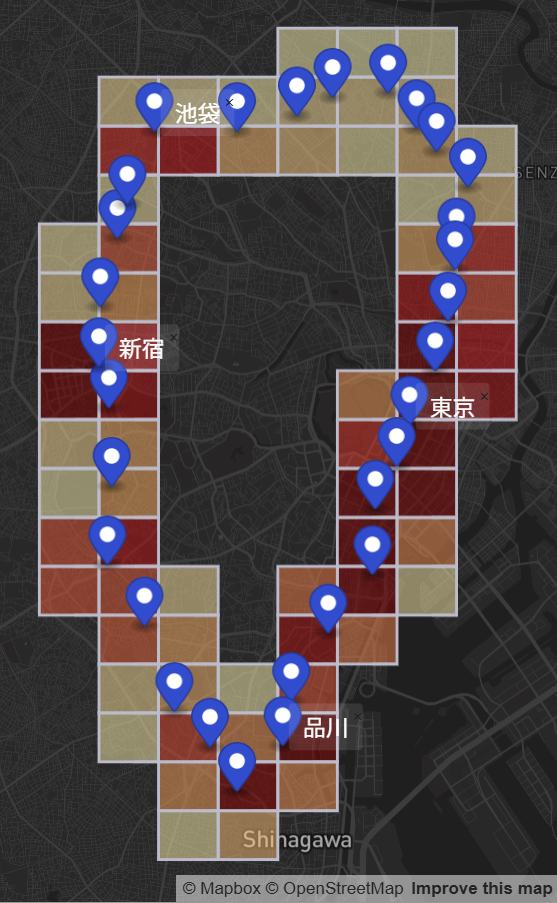

平日昼(左)と休日昼(右)の滞在人口表示
おわりに
「全国の人流オープンデータ」は2019年~2021年のデータです。最新の情報を見たいというケースでは他のデータやサービスを利用する必要があります。弊社では最新の人流データに対応した分析機能を提供しています。もしご興味をお持ちでしたら、下記をご参照ください。
-
高輪ゲートウェイ駅は2020年3月からの開業なので、今回の方法で「高輪ゲートウェイ駅周辺の滞在人口」とは厳密には言えません。 ↩