はじめに
Leafmapで2020年国勢調査データ(集計単位=メッシュ)の人口総数を属性に持つGeoJSONを読み込み、人口総数による色分けと凡例表示までを試してみました。
Leafmapとは
最小限のコーディングでインタラクティブなマッピングと地理空間分析を可能とするPythonパッケージということで、今回注目してみました。
Leafmapには、folium、ipyleaflet、plotly、pydeck、kepler.gl、heremapといった6つのプロットバックエンド(地図やデータをレンダリングするためのライブラリ)があり、操作性や機能に違いがあるそうです。この記事で扱っているプロットバックエンドは folium になります。
また動作確認については、Webフレームワーク Streamlit によるアプリケーション内で行いました。
表示するメッシュデータ(GeoJSON)
人口総数を属性に持つ500mメッシュデータについては、TerraMap APIから取得できるものを利用しました。
一部省略しておりますが、以下のようなGeoJSONファイルになります。
features[0].properties.data[0].value が人口総数の値になっています。
{
  "type": "FeatureCollection",
  "features": [
    {
      "type": "Feature",
      "properties": {
        "area": {
          "area": 0.2616441007461548,
          "ratio_area": [
            0.022681103516012432
          ],
          "ratio": [
            0.08668685229795214
          ]
        },
        "data": [
          {
            "is_authorized": true,
            "ratio_value": [
              "357.1498314675628168"
            ],
            "stat_item_id": 23650,
            "stat_id": "001002000",
            "value": "4120"
          }
        ],
        "point_coordinates": [
          139.653125,
          35.65625
        ],
        "geocode": "533935823",
        "points": []
      },
      "geometry": {
        "type": "MultiPolygon",
        "coordinates": [
          [
            [
              [
                139.65625,
                35.654166667
              ],
              [
                139.65,
                35.654166667
              ],
              [
                139.65,
                35.658333333
              ],
              [
                139.65625,
                35.658333333
              ],
              [
                139.65625,
                35.654166667
              ]
            ]
          ]
        ]
      }
    },
    // .... featureを省略しています
  ]
}
環境準備
Pythonやpipを使えるようにして、まずはleafmap、geopandas、streamlitをインストールします。
pip install leafmap geopandas streamlit
Mapの表示
基本となるMapの表示については、以下のようなコードとコマンドが必要になります。
import leafmap.foliumap as leafmap

def main():
    # Mapオブジェクト作成
    m = leafmap.Map()

    # 地図をStreamlitアプリ内に描画
    m.to_streamlit(height=500)

if __name__ == "__main__":
    main()
streamlit run app.py
ブラウザでの表示結果は以下のようになります。背景地図はOpenStreetMap、各オブジェクトの描画、住所検索、距離・面積測定も可能です。本当にコードは短くて済みました!
GeoJSONの表示
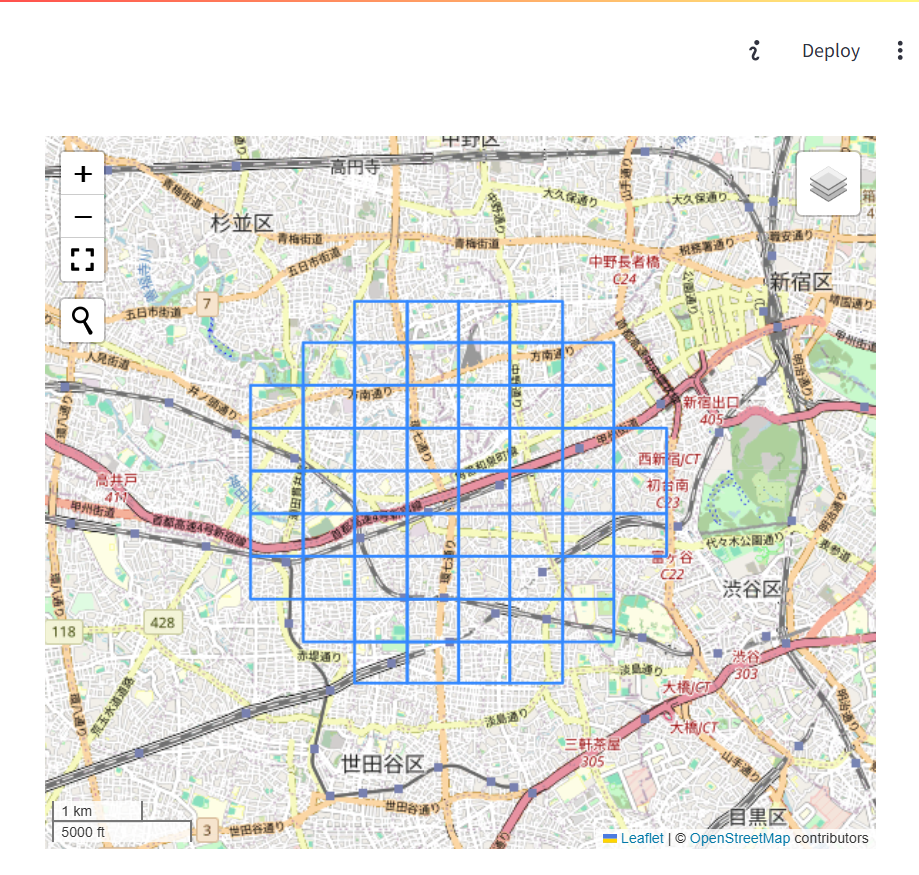
地図の機能は最小限に絞り、GeoJSONを表示させたコードは以下のようになりました。
import leafmap.foliumap as leafmap

def main():
    # Mapオブジェクト作成
    m = leafmap.Map(
        # コントロールは最小限に
        draw_control=False,
        measure_control=False,
    )

    # 地図にGeoJSONのレイヤーを追加
    m.add_geojson(
        "2020-populations.geojson",     # GeoJSONのパス
        layer_name="GeoJSON Layer",
        info_mode="on_click",
    )

    # 地図をStreamlitアプリ内に描画
    m.to_streamlit(height=500)

if __name__ == "__main__":
    main()
表示結果
人口総数による色分け
GeoJSONの人口総数によって色分けを行うには、jsonのインポートと関数の追加を行いました。
import json

def get_color(d):
    """
    人口総数に応じて色を決めます

    :param d: 評価する人口総数
    :type d: int
    :return str: カラーコード
    """
    if d > 7000:
        return "#800026"
    elif d > 6000:
        return "#BD0026"
    elif d > 5000:
        return "#E31A1C"
    elif d > 4000:
        return "#FC4E2A"
    elif d > 3000:
        return "#FD8D3C"
    elif d > 2000:
        return "#FEB24C"
    elif d > 1000:
        return "#FED976"
    else:
        return "#FFEDA0"

def population_styles(feature):
    """
    フィーチャの人口総数に応じてポリゴンスタイルを決めます

    :param feature: GeoJSONのフィーチャ
    :return style: ポリゴンスタイル
    """
    data = json.loads(feature["properties"]["data"])
    value = float(data[0]["value"])
    return {
        "color": "black",
        "weight": 1,
        "fillColor": get_color(value),
        "fillOpacity": 0.5,
    }
追加した関数 population_styles を add_geojson の style_callback で呼び出すように追記します。
    # 地図にGeoJSONのレイヤーを追加
    m.add_geojson(
        "2020-populations.geojson",         # GeoJSONのパス
        layer_name="GeoJSON Layer",
        info_mode="on_click",
        style_callback=population_styles,   # 人口総数によるスタイル設定
    )
凡例の追加
凡例を追加するコードは以下のようになりました。
    # 凡例のDictionary
    population_color_dict = {
        "0-1000": "FFEDA0",
        "1000-2000": "FED976",
        "2000-3000": "FEB24C",
        "3000-4000": "FD8D3C",
        "4000-5000": "FC4E2A",
        "5000-6000": "E31A1C",
        "6000-7000": "BD0026",
        "7000+": "800026",
    }
    # 凡例の追加
    m.add_legend(
        title="Population",
        legend_dict=population_color_dict,
        opacity=0.5
    )
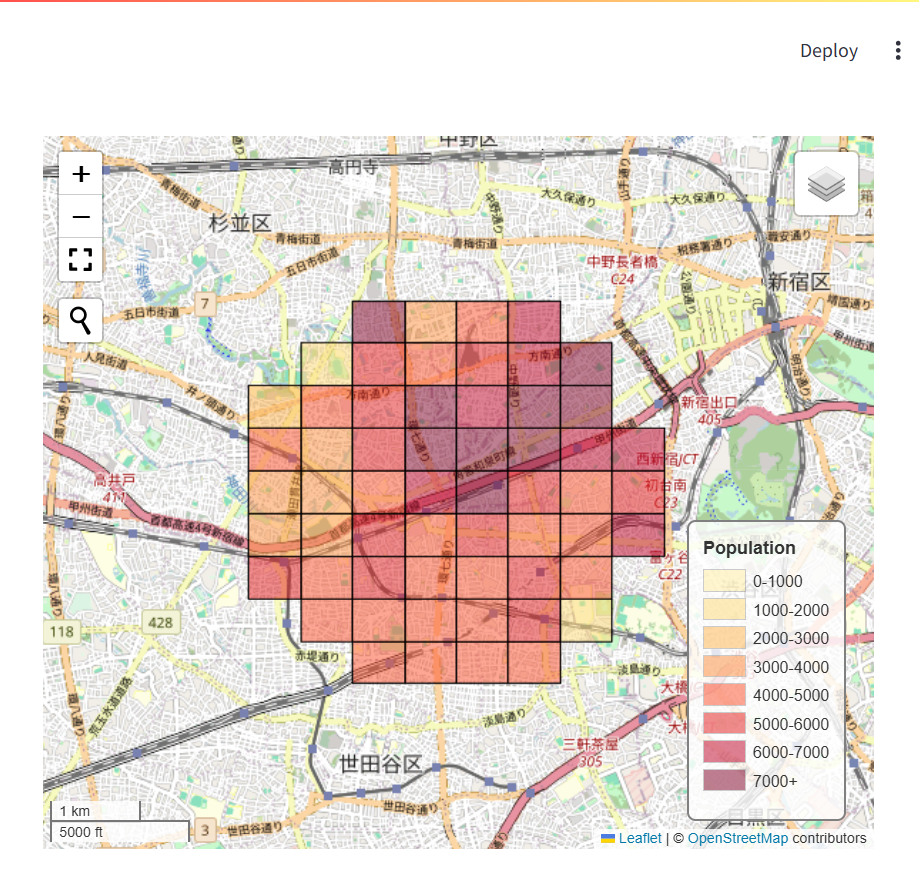
地図の完成
色分けと凡例を追加し完成した地図は以下のようになりました。
最終的な app.py
import leafmap.foliumap as leafmap
import json

def get_color(d):
    """
    人口総数に応じて色を決めます

    :param d: 評価する人口総数
    :type d: int
    :return str: カラーコード
    """
    if d > 7000:
        return "#800026"
    elif d > 6000:
        return "#BD0026"
    elif d > 5000:
        return "#E31A1C"
    elif d > 4000:
        return "#FC4E2A"
    elif d > 3000:
        return "#FD8D3C"
    elif d > 2000:
        return "#FEB24C"
    elif d > 1000:
        return "#FED976"
    else:
        return "#FFEDA0"

def population_styles(feature):
    """
    フィーチャの人口総数に応じてポリゴンスタイルを決めます

    :param feature: GeoJSONのフィーチャ
    :return style: ポリゴンスタイル
    """
    data = json.loads(feature["properties"]["data"])
    value = float(data[0]["value"])
    return {
        "color": "black",
        "weight": 1,
        "fillColor": get_color(value),
        "fillOpacity": 0.5,
    }

def main():
    # Mapオブジェクト作成
    m = leafmap.Map(
        # コントロールは最小限に
        draw_control=False,
        measure_control=False,
    )

    # 地図にGeoJSONのレイヤーを追加
    m.add_geojson(
        "2020-populations.geojson",         # GeoJSONのパス
        layer_name="GeoJSON Layer",
        info_mode="on_click",
        style_callback=population_styles,   # 人口総数によるスタイル設定
    )

    # 凡例のDictionary
    population_color_dict = {
        "0-1000": "FFEDA0",
        "1000-2000": "FED976",
        "2000-3000": "FEB24C",
        "3000-4000": "FD8D3C",
        "4000-5000": "FC4E2A",
        "5000-6000": "E31A1C",
        "6000-7000": "BD0026",
        "7000+": "800026",
    }
    # 凡例の追加
    m.add_legend(
        title="Population",
        legend_dict=population_color_dict,
        opacity=0.5
    )

    # 地図をStreamlitアプリ内に描画
    m.to_streamlit(height=500)

if __name__ == "__main__":
    main()
参考情報
https://leafmap.org/leafmap/?h=#leafmap.leafmap.Map.add_geojson
https://leafmap.org/notebooks/06_legend/
追記
続けて以下の記事を書いてみました。


