はじめに
こちらの記事でPower Systems Virtual Server(以下PowerVS)へのOpenShift 4.7の導入後作業としてinfraノードを構成し、ユーザー定義モニタリングを有効化しました。この記事ではユーザーが作成したプロジェクトのメトリクス収集とアラートルール設定を行います。
OpenShift Container Platform 4.7 では、クラスターコンポーネントはサービスエンドポイントで公開されるメトリクスを収集することによりモニターされます。ユーザー定義プロジェクトのメトリクスのコレクションを設定することもできます。
ユーザー定義のプロジェクトについてアラートルールを作成できます。これらのアラートルールは、選択したメトリクスの値に基づいてアラートを実行します。
1. メトリクス収集
1.1. メトリクス対応コンテナのデプロイ
ユーザー定義「mpMetrics-3.0」フィーチャーを有効化したOpen Libertyをビルドしデプロイします。
oc new-project open-liberty
oc new-build --name=open-liberty --strategy=docker --binary
oc start-build open-liberty --from-dir=. --follow
oc get is
### 標準出力↓
NAME           IMAGE REPOSITORY                                                             TAGS     UPDATED
open-liberty   image-registry.openshift-image-registry.svc:5000/open-liberty/open-liberty   latest   About a minute ago

oc apply -f deployment.yaml
oc get pod
### 標準出力↓
NAME                            READY   STATUS      RESTARTS   AGE
open-liberty-1-build            0/1     Completed   0          4m18s
open-liberty-76f55fbcf6-bgpms   1/1     Running     0          22s
open-liberty-76f55fbcf6-p2f54   1/1     Running     0          22s
FROM openliberty/open-liberty:21.0.0.4-full-java11-openj9-ubi
COPY server.xml /config/
EXPOSE 9080
<?xml version="1.0" encoding="UTF-8"?>
<server description="new server">

    <!-- Enable features -->
    <featureManager>
        <feature>mpMetrics-3.0</feature>
    </featureManager>

    <!-- To access this server from a remote client add a host attribute to the following element, e.g. host="*" -->
    <httpEndpoint id="defaultHttpEndpoint"
                  host="*"
                  httpPort="9080"
                  accessLoggingRef="accessLogging" />
    <httpAccessLogging id="accessLogging" filePath="/logs/http_access.log"/>

    <!-- Metrics configuration without security -->
    <mpMetrics authentication="false"/>

</server>
apiVersion: apps/v1
kind: Deployment
metadata:
  name: open-liberty
  labels:
    app: open-liberty
spec:
  serviceName: open-liberty
  replicas: 2
  selector:
    matchLabels:
      app: open-liberty
  template:
    metadata:
      labels:
        app: open-liberty
    spec:
      containers:
        - name: open-liberty
          image: image-registry.openshift-image-registry.svc:5000/open-liberty/open-liberty
          ports:
            - containerPort: 9080
デプロイしたopen-libertyからメトリクスを取得できるようになりました。
oc logs open-liberty-76f55fbcf6-4rl8f
### 標準出力↓
Launching defaultServer (Open Liberty 21.0.0.4/wlp-1.0.51.cl210420210407-0944) on Eclipse OpenJ9 VM, version 11.0.11+9 (en_US)
[AUDIT   ] CWWKE0001I: The server defaultServer has been launched.
[AUDIT   ] CWWKG0093A: Processing configuration drop-ins resource: /opt/ol/wlp/usr/servers/defaultServer/configDropins/defaults/keystore.xml
[AUDIT   ] CWWKG0093A: Processing configuration drop-ins resource: /opt/ol/wlp/usr/servers/defaultServer/configDropins/defaults/open-default-port.xml
[AUDIT   ] CWWKZ0058I: Monitoring dropins for applications.
[AUDIT   ] CWWKS4104A: LTPA keys created in 2.390 seconds. LTPA key file: /opt/ol/wlp/output/defaultServer/resources/security/ltpa.keys
[AUDIT   ] CWWKT0016I: Web application available (default_host): http://open-liberty-76f55fbcf6-4rl8f:9080/metrics/
[AUDIT   ] CWWKT0016I: Web application available (default_host): http://open-liberty-76f55fbcf6-4rl8f:9080/ibm/api/
[AUDIT   ] CWWKF0012I: The server installed the following features: [json-1.0, monitor-1.0, mpConfig-2.0, mpMetrics-3.0].
・・・

oc rsh open-liberty-76f55fbcf6-4rl8f \
  curl http://open-liberty-76f55fbcf6-4rl8f:9080/metrics/ | grep -v "^#"
### 標準出力↓
base_gc_total{name="global"} 7
base_gc_total{name="scavenge"} 81
base_cpu_systemLoadAverage 0.2
base_classloader_loadedClasses_count 8107
base_thread_count 59
base_classloader_unloadedClasses_total 1
base_cpu_processCpuTime_seconds 48.408673
base_gc_time_seconds{name="scavenge"} 0.543
base_gc_time_seconds{name="global"} 0.231
base_jvm_uptime_seconds 289.746
base_memory_committedHeap_bytes 9.9418112E7
base_thread_max_count 66
base_classloader_loadedClasses_total 8108
base_cpu_availableProcessors 8
base_thread_daemon_count 55
base_memory_maxHeap_bytes 4.26377216E9
base_cpu_processCpuLoad_percent 0.0019186088524468436
base_memory_usedHeap_bytes 5.722572E7
vendor_servlet_request_total{servlet="io_openliberty_microprofile_metrics_internal_public_PublicMetricsRESTProxyServlet"} 1
vendor_session_invalidatedbyTimeout_total{appname="default_host_metrics"} 0
vendor_threadpool_activeThreads{pool="Default_Executor"} 1
vendor_session_liveSessions{appname="default_host_metrics"} 1
vendor_threadpool_size{pool="Default_Executor"} 16
vendor_servlet_responseTime_total_seconds{servlet="io_openliberty_microprofile_metrics_internal_public_PublicMetricsRESTProxyServlet"} 0.09025113500000001
vendor_session_invalidated_total{appname="default_host_metrics"} 0
vendor_session_create_total{appname="default_host_metrics"} 1
vendor_session_activeSessions{appname="default_host_metrics"} 0
1.2. サービスモニター設定
OpenShiftモニタリングがメトリクスを収集するようにサービスとサービスモニターを作成します。
oc apply -f service.yaml
oc apply -f service-monitor.yaml
apiVersion: v1
kind: Service
metadata:
  labels:
    app: open-liberty
  name: open-liberty
spec:
  ports:
    - protocol: TCP
      port: 9080
      targetPort: 9080
      name: web
  selector:
    app: open-liberty
apiVersion: monitoring.coreos.com/v1
kind: ServiceMonitor
metadata:
  labels:
    k8s-app: open-liberty
  name: open-liberty
spec:
  endpoints:
  - interval: 30s
    port: web
    scheme: http
  selector:
    matchLabels:
      app: open-liberty
Open Libertyのメトリクスの収集が開始されました。接続元のIPアドレスは「prometheus-user-workload-0」と「prometheus-user-workload-1」になっています。
oc rsh open-liberty-76f55fbcf6-4rl8f tail -f /logs/http_access.log
### 標準出力↓
10.131.0.41 - [22/May/2021:08:26:44 +0000] "GET /metrics HTTP/1.1" 200 6890
10.131.0.42 - [22/May/2021:08:27:06 +0000] "GET /metrics HTTP/1.1" 200 6883
10.131.0.41 - [22/May/2021:08:27:14 +0000] "GET /metrics HTTP/1.1" 200 6873
10.131.0.42 - [22/May/2021:08:27:36 +0000] "GET /metrics HTTP/1.1" 200 6880
・・・

oc get pod -n openshift-user-workload-monitoring -o wide
### 標準出力↓
NAME                                   READY   STATUS    RESTARTS   AGE    IP             NODE       NOMINATED NODE   READINESS GATES
prometheus-operator-54c8557d7d-524qv   2/2     Running   0          6d8h   10.129.0.56    master-2   <none>           <none>
prometheus-user-workload-0             5/5     Running   0          6d8h   10.131.0.41    infra-2    <none>           <none>
prometheus-user-workload-1             5/5     Running   0          6d8h   10.131.0.42    infra-2    <none>           <none>
thanos-ruler-user-workload-0           3/3     Running   0          6d8h   10.129.2.146   infra-1    <none>           <none>
thanos-ruler-user-workload-1           3/3     Running   0          6d8h   10.128.2.22    infra-0    <none>           <none>
収集したメトリクスは、OpenShiftコンソールで確認することができます。

2. アラートルール設定
2.1. Prometehusルール作成
Kubernetesメトリクスを使用して、デプロイメントのレプリカ数を条件とするPrometheusルールを作成します。Open Libertyのメトリクスを条件とすることも可能です。
oc apply -f prometheus-rule.yaml
apiVersion: monitoring.coreos.com/v1
kind: PrometheusRule
metadata:
  name: open-liberty-alert
spec:
  groups:
  - name: open-liberty
    rules:
    - alert: OpenLibertyAlert
      expr: kube_deployment_status_replicas_available{deployment="open-liberty"} < 2
      for: 1m
      labels:
        severity: critical
      annotations:
        summary: Deployment open-liberty replicas < 2
2.2. Prometehusルール発火
Prometheusルールの有効性を確認するためにレプリカ数を変更します。
# レプリカ数変更
oc scale --replicas=1 deploy open-liberty
oc get pod
### 標準出力↓
NAME                    READY   STATUS    RESTARTS   AGE
open-liberty-76f55fbcf6-nq6cb   1/1     Running     0          44m
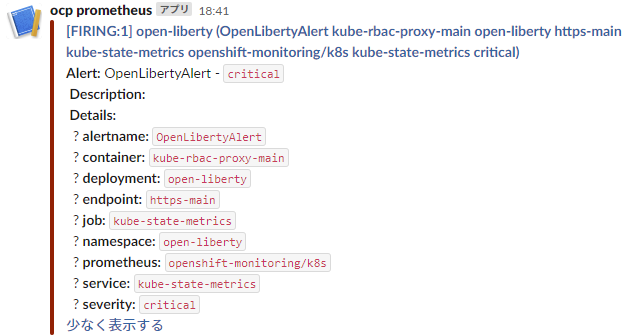
■ Slackへのアラート通知
AlertManagerを設定しているため、Slackにアラートが通知されました。
■ OpenShiftコンソールで発火確認

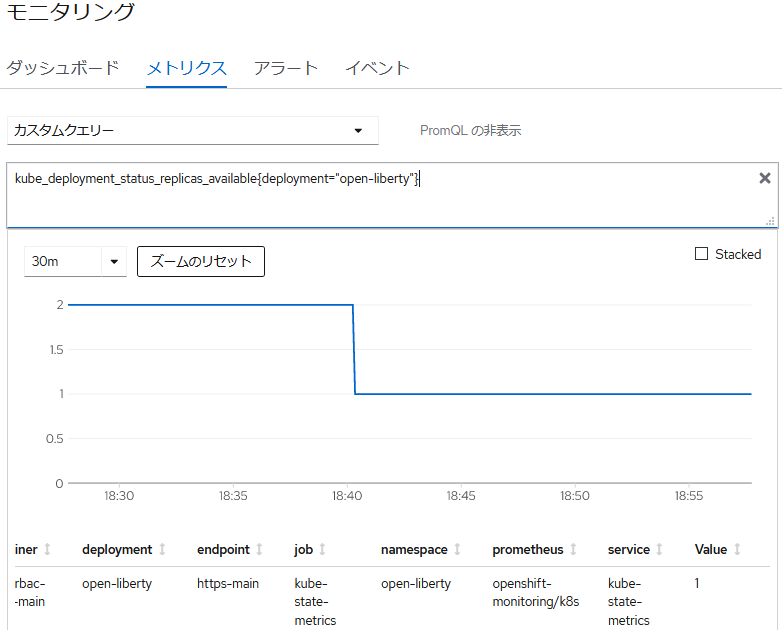
■ OpenShiftコンソールでクエリー結果を確認
Prometheusルールの条件でクエリーすると、デプロイメントのレプリカ数が2から1に変更されていることを確認できます。