Pandas での データ操作
最近は利用するデータも巨大化しているため、Excelで開くのも大変です。
結構 Excelでは開けない、もしくは開くと Excelが重すぎて操作できないデータが結構あります。
Python の Pandas ライブラリを活用してExcelでのデータ操作を代替してみたいと思います。
Pandas の導入やファイル読み込みに関してはこの文書では説明しませんので、以下のリンク先を参照してください。
データ取得先
機械学習が認知されてきたせいか、オープンデータが多くなってきています。
東京都もいくつかのデータを公開しています。
ちょと東京都の公開するExcelはデータ処理目的だと不便なのでCSVを加工してExcelにしたりして操作してみます。
サンプルとして東京都の人工推移CSVを利用してみます。以下のリンク先から「CSV」を取得してください。
ファイル読み込み
pandas の import から開始します。
import pandas as pd
この時点では CSV は一度も開いた事が無い状態だとすると、文字コードが不明です。
文字コード判定は Python の「chardet」ライブラリを利用します。
import chardet

with open('data/tn13qa020100.csv', mode='rb') as f:
    # 1行だけ読み込み
    file_line = f.readline()
    # 判定
    print(chardet.detect(file_line))
{'encoding': 'SHIFT_JIS', 'confidence': 0.99, 'language': 'Japanese'}
取得したCSVの文字コードがSJISだとわかりました。
pandas で SJISを読み込む時はencodingの指定が必要です。
政府系のファイルでSJISの場合、Windowsで作成されたファイルの可能性が高いので、ここでは一応「cp932」で読み込んでおきます。
df = pd.read_csv('data/tn13qa020100.csv', encoding='cp932')
df
| 年次(Year) | 人口(Population) | 人口増減率(Rate of population change)(%) | 対全国比(%Nat’l population)(%) | |
|---|---|---|---|---|
| 0 | 明治5年(1872) | 859345 | … | 2.47 |
| 1 | 6(1873) | 887322 | 3.26 | 2.54 |
| 2 | 7(1874) | 932458 | 5.09 | 2.65 |
| 3 | 8(1875) | 986091 | 5.75 | 2.79 |
| 4 | 9(1876) | 1027517 | 4.2 | 2.89 |
| 5 | 10(1877) | 890681 | -13.32 | 2.48 |
| ... | ... | ... | ... | ... |
| 138 | 22(2010) | *13159388 | 0.63 | 10.28 |
| 139 | 23(2011) | 13186562 | 0.21 | 10.32 |
| 140 | 24(2012) | 13216221 | 0.22 | 10.36 |
| 141 | 25(2013) | 13286735 | 0.53 | NaN |
| 142 | 平成23年からは,平成22年国勢調査を基準とした10月1日現在の推計人口である。Figure... | NaN | NaN | NaN |
| 143 | *印は国勢調査人口(10月1日現在)Figures marked with the * r... | NaN | NaN | NaN |
| 144 | 注 1) 市部寄留者の数に重複があったための減である。 (Note: 1) Reduct... | NaN | NaN | NaN |
| 145 | 2) 北多摩、南多摩及び西多摩郡が神奈川県から東京府へ移ったための増である。(2) Incr... | NaN | NaN | NaN |
| 146 | 資料:都総務局統計部人口統計課 「人口の動き-「東京都の人口(推計)」年報-」Source:... | NaN | NaN | NaN |
147 rows × 4 columns
データを見ると末尾5行は説明文だとわかります。この行は処理上不要なので、削除します。
df = df[:-5]
df.tail()
| 年次(Year) | 人口(Population) | 人口増減率(Rate of population change)(%) | 対全国比(%Nat’l population)(%) | |
|---|---|---|---|---|
| 137 | 21(2009) | 13077625 | 0.86 | 10.21 |
| 138 | 22(2010) | *13159388 | 0.63 | 10.28 |
| 139 | 23(2011) | 13186562 | 0.21 | 10.32 |
| 140 | 24(2012) | 13216221 | 0.22 | 10.36 |
| 141 | 25(2013) | 13286735 | 0.53 | NaN |
データ情報確認をします。
df.info()
    <class 'pandas.core.frame.DataFrame'>
    RangeIndex: 142 entries, 0 to 141
    Data columns (total 4 columns):
    年次(Year)                               142 non-null object
    人口(Population)                         142 non-null object
    人口増減率(Rate of population change)(%)    142 non-null object
    対全国比(%Nat’l population)(%)             141 non-null float64
    dtypes: float64(1), object(3)
    memory usage: 4.5+ KB
列名が日本語全角だとプログラム的に扱いずらいので、rename します。
df.columns = ['year_orig', 'pop', 'rate', '%']
df.head()
| year_orig | pop | rate | % | |
|---|---|---|---|---|
| 0 | 明治5年(1872) | 859345 | … | 2.47 |
| 1 | 6(1873) | 887322 | 3.26 | 2.54 |
| 2 | 7(1874) | 932458 | 5.09 | 2.65 |
| 3 | 8(1875) | 986091 | 5.75 | 2.79 |
| 4 | 9(1876) | 1027517 | 4.2 | 2.89 |
年 は元号と西暦が混在していると処理しずらいので、分割します。
def conv_year(row):
    # 後ろ5文字から1文字が西暦
    year = int(row[-5:-1])

    # 前半
    wareki = row[:-6]

    gengo = ''
    if len(wareki) >= 3:
        # 3文字以上の時、元号が含まれている
        gengo = wareki[:2]

        wareki = wareki[2:]

        if '年' in wareki:
            wareki = wareki[:-1]

        if '元' == wareki:
            wareki = 1

    wareki = int(wareki)

    return year, gengo, wareki

df['year'], df['元号'], df['和暦'] = zip(*df['year_orig'].map(conv_year))

# 元号は空になる物があるので、後で処理
gengo_lst = []

now_gengo = ''
for gengo in df['元号'].tolist():
    if gengo == '':
        gengo = now_gengo
    else:
        now_gengo = gengo
    gengo_lst.append(gengo)


df['元号'] = gengo_lst
上記の書き方はメモリ効率があまり良くない書き方のため、warningが出ます。今回の場合は特に問題ありません。
    ipykernel_launcher.py:26: SettingWithCopyWarning:
    A value is trying to be set on a copy of a slice from a DataFrame.
    Try using .loc[row_indexer,col_indexer] = value instead

    See the caveats in the documentation: http://pandas.pydata.org/pandas-docs/stable/indexing.html#indexing-view-versus-copy

    ipykernel_launcher.py:40: SettingWithCopyWarning:
    A value is trying to be set on a copy of a slice from a DataFrame.
    Try using .loc[row_indexer,col_indexer] = value instead

    See the caveats in the documentation: http://pandas.pydata.org/pandas-docs/stable/indexing.html#indexing-view-versus-copy
変換されたか確認します。
df.head()
| year_orig | pop | rate | % | year | 元号 | 和暦 | |
|---|---|---|---|---|---|---|---|
| 0 | 明治5年(1872) | 859345 | … | 2.47 | 1872 | 明治 | 5 |
| 1 | 6(1873) | 887322 | 3.26 | 2.54 | 1873 | 明治 | 6 |
| 2 | 7(1874) | 932458 | 5.09 | 2.65 | 1874 | 明治 | 7 |
| 3 | 8(1875) | 986091 | 5.75 | 2.79 | 1875 | 明治 | 8 |
| 4 | 9(1876) | 1027517 | 4.2 | 2.89 | 1876 | 明治 | 9 |
次に人口の型を変換します。「*」等が入っているため、数字ではありません。
df['pop'][:10]
    0     859345
    1     887322
    2     932458
    3     986091
    4    1027517
    5     890681
    6    1072560
    7    1084025
    8    1084745
    9    1121560
    Name: pop, dtype: object
人口を数字に変換します。
def conv_pop(val):
    # 変換関数
    if '*' in val:
        val = val[1:]
    elif ')' in val:
        val = val[2:]

    return int(val)

df['pop']  = df['pop'].map(conv_pop)

df['pop']
    0        859345
    1        887322
    2        932458
    3        986091
    4       1027517
    5        890681
             ...
    137    13077625
    138    13159388
    139    13186562
    140    13216221
    141    13286735
    Name: pop, Length: 142, dtype: int64
rate も同様に変換します。
def conv_rate(val):
    if '… ' == val:
        return 0.0

    return float(val)

df['rate'] = df['rate'].map(conv_rate)

df['rate']
    0       0.00
    1       3.26
    2       5.09
    3       5.75
    4       4.20
    5     -13.32
           ...
    137     0.86
    138     0.63
    139     0.21
    140     0.22
    141     0.53
    Name: rate, Length: 142, dtype: float64
型が整形されたか、再度 info で確認してみます。
df.info()
    <class 'pandas.core.frame.DataFrame'>
    RangeIndex: 142 entries, 0 to 141
    Data columns (total 7 columns):
    year_orig    142 non-null object
    pop          142 non-null int64
    rate         142 non-null float64
    %            141 non-null float64
    year         142 non-null int64
    元号           142 non-null object
    和暦           142 non-null int64
    dtypes: float64(2), int64(3), object(2)
    memory usage: 7.8+ KB
df.head()
| year_orig | pop | rate | % | year | 元号 | 和暦 | |
|---|---|---|---|---|---|---|---|
| 0 | 明治5年(1872) | 859345 | 0.00 | 2.47 | 1872 | 明治 | 5 |
| 1 | 6(1873) | 887322 | 3.26 | 2.54 | 1873 | 明治 | 6 |
| 2 | 7(1874) | 932458 | 5.09 | 2.65 | 1874 | 明治 | 7 |
| 3 | 8(1875) | 986091 | 5.75 | 2.79 | 1875 | 明治 | 8 |
| 4 | 9(1876) | 1027517 | 4.20 | 2.89 | 1876 | 明治 | 9 |
整形済みデータを一旦保存します。
Excelとpicleに保存しておきます。
df.to_pickle('data/df.pickle')
df.to_excel('data/df.xlsx')
pickle から処理開始
pickle を利用すればそこから処理を再開できます。
df = pd.read_pickle('data/df.pickle')

df.info()
    <class 'pandas.core.frame.DataFrame'>
    RangeIndex: 142 entries, 0 to 141
    Data columns (total 7 columns):
    year_orig    142 non-null object
    pop          142 non-null int64
    rate         142 non-null float64
    %            141 non-null float64
    year         142 non-null int64
    元号           142 non-null object
    和暦           142 non-null int64
    dtypes: float64(2), int64(3), object(2)
    memory usage: 7.8+ KB
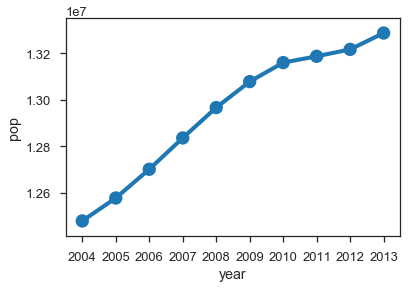
取得した値に問題ないか、とりあえずグラフを書いて確認してみます。
%matplotlib inline
import seaborn as sns
sns.set_style('ticks')
sns.set_context('talk')

sns.pointplot(x='year', y='pop', data=df[-10:])
<matplotlib.axes._subplots.AxesSubplot at 0x10b7142b0>
「pickle」ファイルを保存しておくと、処理が途中から再開できますので、便利です。
グルーピング
SQLで言う「group by」を実施してみます。
グループする場合、列名等を指定します。「keys」を利用して、列名を確認しておきます。
df.keys()
Index(['year_orig', 'pop', 'rate', '%', 'year', '元号', '和暦'], dtype='object')
とりあえず「元号」を利用してみます。
「unique()」を利用して、いくつのグループになるか事前に確認しておきます。
df['元号'].unique()
array(['明治', '大正', '昭和', '平成'], dtype=object)
panasのグルーピングは「groupby」を利用します。
for key, group in df.groupby('元号'):
    print(key, len(group))
    大正 15
    平成 25
    明治 40
    昭和 62
上記では ループさせて、len で数を確認していますが「size」を利用すればループの必要はありません。
grup = df.groupby('元号')
grup.size()
    元号
    大正    15
    平成    25
    明治    40
    昭和    62
    dtype: int64
「平均(mean)」、「最小値(min)」、「最大値(max)」、「合計(sum)」が利用できます。
grup.mean()
| pop | rate | % | year | 和暦 | |
|---|---|---|---|---|---|
| 元号 | |||||
| 大正 | 3.462471e+06 | 3.770000 | 6.203333 | 1919.0 | 8.0 |
| 平成 | 1.235242e+07 | 0.443200 | 9.727917 | 2001.0 | 13.0 |
| 明治 | 1.597809e+06 | 3.051000 | 3.792500 | 1891.5 | 24.5 |
| 昭和 | 8.799917e+06 | 1.948387 | 9.469516 | 1957.5 | 32.5 |
grup.min()
| year_orig | pop | rate | % | year | 和暦 | |
|---|---|---|---|---|---|---|
| 元号 | ||||||
| 大正 | 大正元年(1912) | 2757500 | -3.13 | 5.33 | 1912 | 1 |
| 平成 | 平成元年(1989) | 11773605 | -0.44 | 9.37 | 1989 | 1 |
| 明治 | 明治5年(1872) | 859345 | -13.32 | 2.47 | 1872 | 5 |
| 昭和 | 昭和2年(1927) | 3488284 | -52.02 | 4.83 | 1927 | 2 |
grup.max()
| year_orig | pop | rate | % | year | 和暦 | |
|---|---|---|---|---|---|---|
| 元号 | ||||||
| 大正 | 9(1920) | 4694400 | 14.47 | 7.73 | 1926 | 15 |
| 平成 | 9(1997) | 13286735 | 1.06 | 10.36 | 2013 | 25 |
| 明治 | 9(1876) | 2732000 | 20.42 | 5.52 | 1911 | 44 |
| 昭和 | 9(1934) | 11904896 | 19.92 | 11.10 | 1988 | 63 |
grup.sum()
| pop | rate | % | year | 和暦 | |
|---|---|---|---|---|---|
| 元号 | |||||
| 大正 | 51937072 | 56.55 | 93.05 | 28785 | 120 |
| 平成 | 308810484 | 11.08 | 233.47 | 50025 | 325 |
| 明治 | 63912378 | 122.04 | 151.70 | 75660 | 980 |
| 昭和 | 545594878 | 120.80 | 587.11 | 121365 | 2015 |
Pandas の様々な機能練習
以下のリンク先等を参照すると、様々なパターンを実習できます。
- https://pandas.pydata.org/pandas-docs/stable/tutorials.html
- http://nbviewer.jupyter.org/github/guipsamora/pandas_exercises/tree/master/
書いた人に関して
Tech Fun株式会社スペシャリスト、xza です。
社内で開催した初学者向け勉強会で利用した資料等を公開しています。