データ分析をはじめるとき、データの平均や分散などの要約統計量を確認するかと思います。
しかし、要約統計量を確認するだけでは不十分な場合があります。
import pandas as pd
import seaborn as sns

# データの読み込み
df = pd.read_csv('https://git.io/vD7ui')

# 散布図
sns.lmplot(x='x', y='y', col='data', hue='data', col_wrap=2, fit_reg=False, data=df)
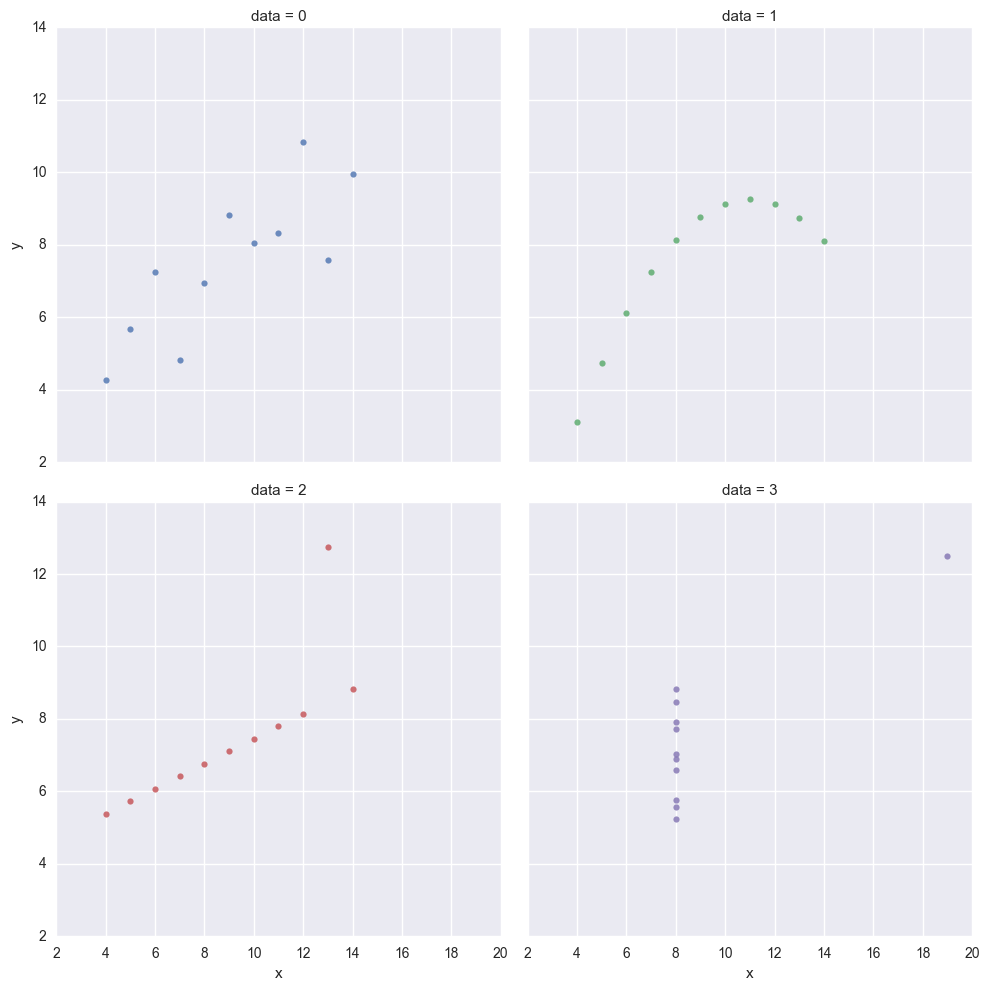
と、散布図を見ると、異なったデータであることが分かりますが、平均と標準偏差は同じ値をとります。
# 平均
df.groupby('data').mean()
| data | x | y |
|---|---|---|
| 0 | 9 | 7.500909 |
| 1 | 9 | 7.500909 |
| 2 | 9 | 7.500000 |
| 3 | 9 | 7.500909 |
# 標準偏差
df.groupby('data').std()
| data | x | y |
|---|---|---|
| 0 | 3.316625 | 2.031568 |
| 1 | 3.316625 | 2.031657 |
| 2 | 3.316625 | 2.030424 |
| 3 | 3.316625 | 2.030579 |
細かい値は異なりますが、ほとんど同じ値であることが分かります。
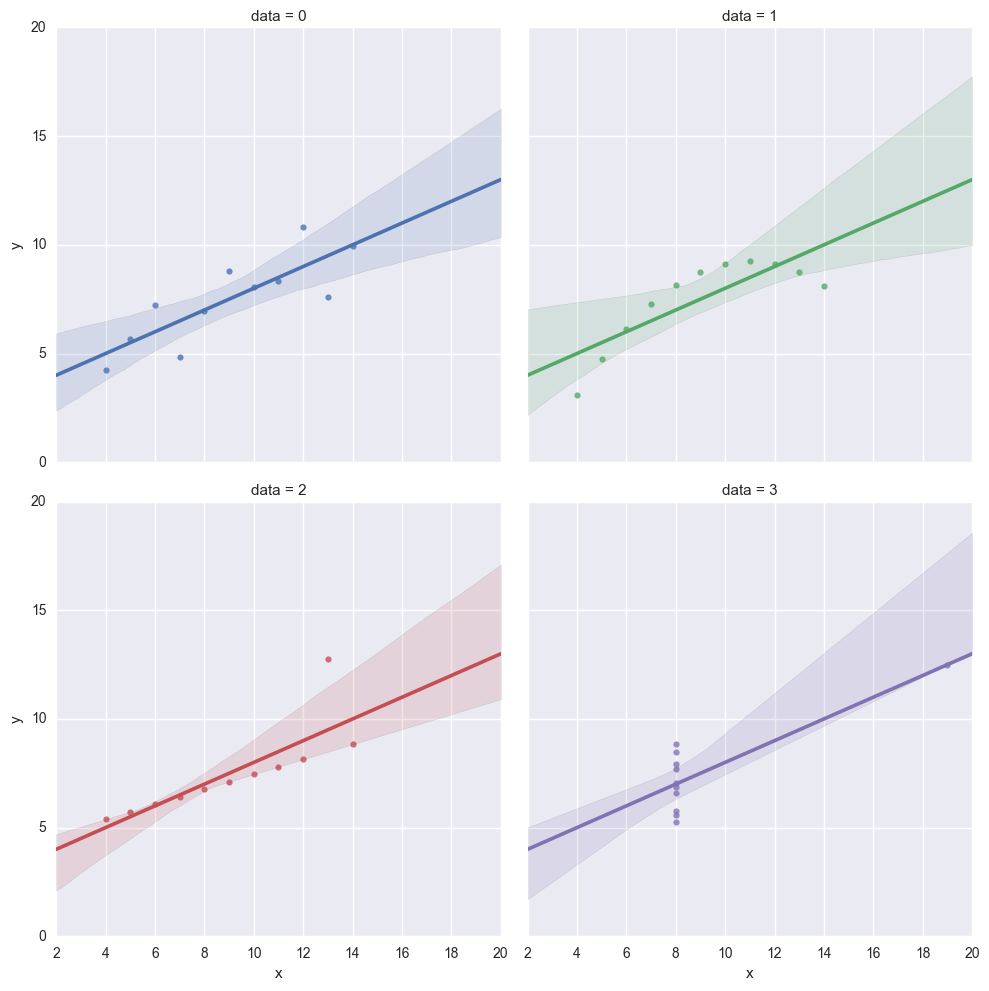
また、回帰直線も全く同じ直線になります。
# 散布図 + 回帰直線
sns.lmplot(x='x', y='y', col='data', hue='data', col_wrap=2, fit_reg=True, data=df)
pandasでは、describeメソッドでまとめて要約統計量を表示することができます。
# 要約統計量
df.groupby('data').describe()
x	y
data
0	count	11.000000	11.000000
mean	9.000000	7.500909
std	3.316625	2.031568
min	4.000000	4.260000
25%	6.500000	6.315000
50%	9.000000	7.580000
75%	11.500000	8.570000
max	14.000000	10.840000
1	count	11.000000	11.000000
mean	9.000000	7.500909
std	3.316625	2.031657
min	4.000000	3.100000
25%	6.500000	6.695000
50%	9.000000	8.140000
75%	11.500000	8.950000
max	14.000000	9.260000
2	count	11.000000	11.000000
mean	9.000000	7.500000
std	3.316625	2.030424
min	4.000000	5.390000
25%	6.500000	6.250000
50%	9.000000	7.110000
75%	11.500000	7.980000
max	14.000000	12.740000
3	count	11.000000	11.000000
mean	9.000000	7.500909
std	3.316625	2.030579
min	8.000000	5.250000
25%	8.000000	6.170000
50%	8.000000	7.040000
75%	8.000000	8.190000
max	19.000000	12.500000
平均と標準偏差はさきほど、見たとおりですが、四分位点は若干異なることがわかります。特にdata3は大きく異なります。
このように、散布図は異なるが、統計量や回帰直線が同じになるデータをアンスコムの例といいます。なので、統計量だけでなく、散布図を描くことが重要になってきます。
ただ、現実のデータにおいて、二次元であることは少ないかと思います。その場合、主成分分析(PCA)を用いて次元を2次元まで落として可視化するなど工夫が必要です。
-
data列が同じ値の行が同じデータを表します ↩