サンプル動かすだけなのでたいしたことやってないけど、可視化でつまづいたのでメモ。
gensimのPoincare Embeddingのページ。
https://radimrehurek.com/gensim/models/poincare.html
可視化までやるならplotlyがあった方がいい。
ただし、plotlyが3.0.0以上のバージョンだとエラーが出るのでバージョン指定してインストールする必要がある
setup
gensim は既にインストール済み
pip install plotly==2.7.0
training
可視化する場合は可視化用のpoincare_2d_visualizationがsize=2にしか対応していないので、PoincareModelを実行する際にsize=2を指定する。
from gensim.models.poincare import PoincareModel, PoincareRelations
from gensim.test.utils import datapath

# Read the sample relations file and train the model
relations = PoincareRelations(file_path=datapath('poincare_hypernyms_large.tsv'))
model = PoincareModel(train_data=relations, size=2)
model.train(epochs=50)
visualization
import plotly
import gensim.viz.poincare

plotly.offline.init_notebook_mode(connected=False)
prefecutre_map = gensim.viz.poincare.poincare_2d_visualization(model=model,
                                                               tree=relations,
                                                               figure_title="tutorial",
                                                               show_node_labels=model.kv.vocab.keys())
plotly.offline.iplot(prefecutre_map)
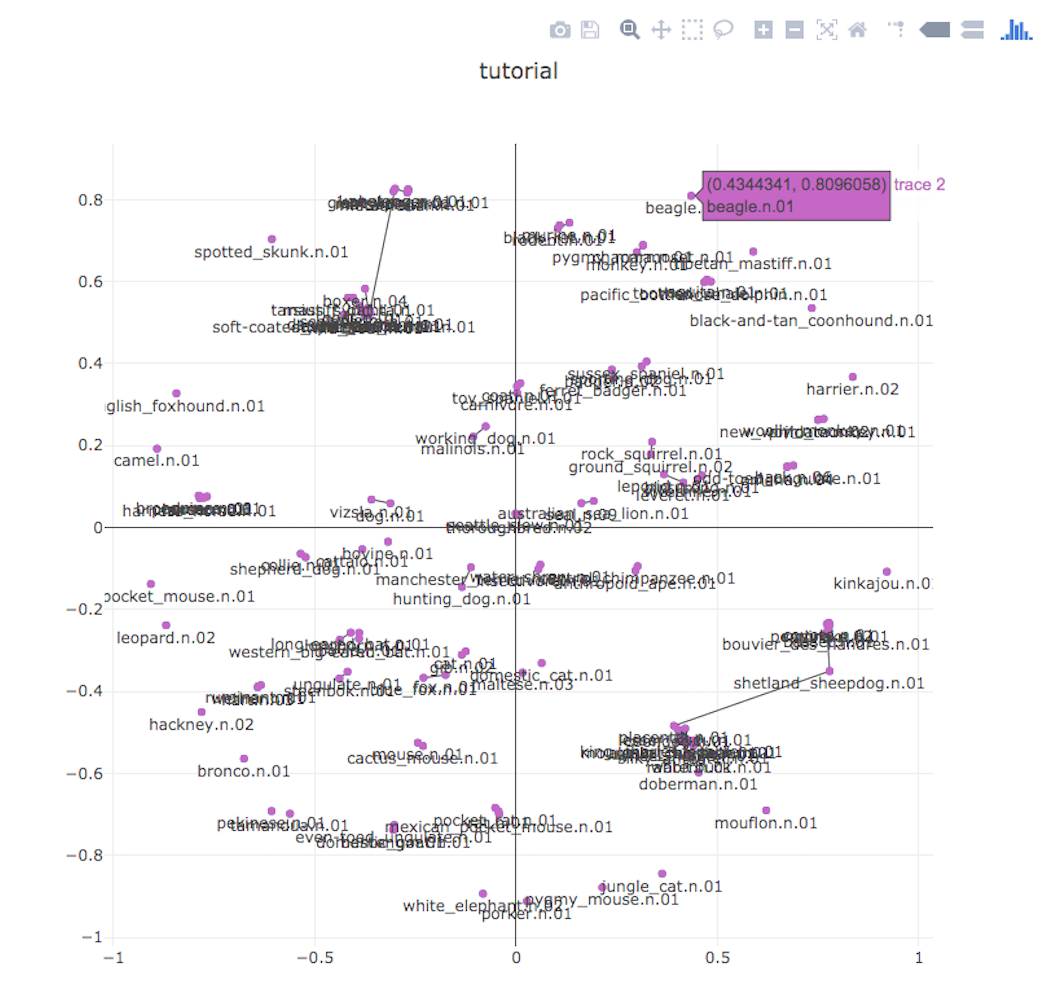
可視化の結果
拡大とかもできるので、ごちゃごちゃしてるけど割とどうにかなる。

plotlyを3.0.0以上でインストールしていると、以下の様なエラーが出る
ValueError:
    Invalid value of type 'builtins.str' received for the 'textposition' property of scatter
        Received value: 'bottom'

    The 'textposition' property is an enumeration that may be specified as:
      - One of the following enumeration values:
            ['top left', 'top center', 'top right', 'middle left',
            'middle center', 'middle right', 'bottom left', 'bottom
            center', 'bottom right']
      - A tuple, list, or one-dimensional numpy array of the above