scipyでピーク値の抽出
scipy.signal.argrelmaxを利用
ピーク値のインデックスが取得できる。
import numpy as np
from scipy import signal
import matplotlib.pyplot as plt
x = np.linspace(0,10,100)
yorg = np.sin(x)
y = yorg + np.random.randn(100)*0.2
# ピーク値のインデックスを取得
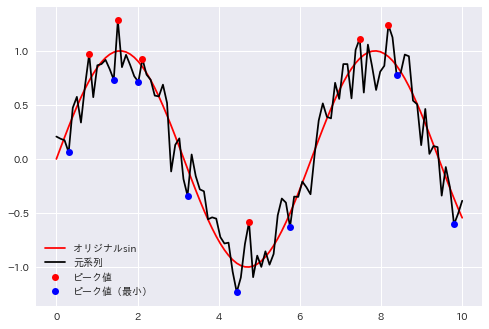
maxid = signal.argrelmax(y, order=1) #最大値
minid = signal.argrelmin(y, order=1) #最小値
plt.plot(x,yorg,'r',label='オリジナルsin')
plt.plot(x,y,'k-',label='元系列')
plt.plot(x[maxid],y[maxid],'ro',label='ピーク値')
plt.plot(x[minid],y[minid],'bo',label='ピーク値(最小)')
plt.legend()
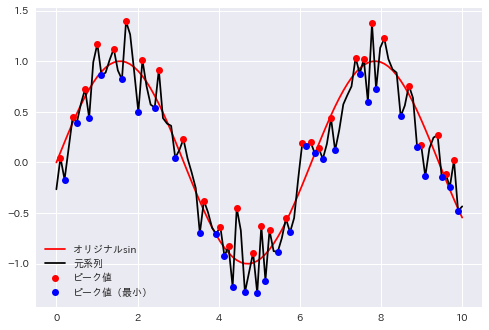
orderの値を変更すると、抽出する間隔が変わる。