インポート
まずは,インポート
%matplotlib inline
import matplotlib.pyplot as plt
import numpy as np
データ作成
テストデータの作成
x = np.linspace(0,100)
y = np.sin(np.radians(x*10))
y2 = np.cos(np.radians(x*5))*0.5
全体設定
- matplotlib と Seaborn の軸の日本語設定を参考にして,日本語フォントを設定した。
- 参考ページでは,IPAで検索していたが,ipaとした。
- グラフサイズはA4として設定した。
- 単位はインチのため,25.4cmで割る
plt.rcParams['font.family'] = 'IPAexGothic' #全体のフォントを設定
plt.rcParams["figure.figsize"] = [210/25.4, 294/25.4]
plt.rcParams['font.size'] = 10 #フォントサイズを設定 default : 12
plt.rcParams['xtick.labelsize'] = 10 # 横軸のフォントサイズ
plt.rcParams['ytick.labelsize'] = 10
プロットしてみよう
余白の設定
subplots_adjustで設定する。
単位は割合となる。左下が原点となっている。
# 余白の設定
# 余白は割合で設定する。
# 左下が原点となる。
# サイズをA4縦として余白(left,right,top,bottom)を設定
plt.subplots_adjust(left=30/210,
right=(210-20)/210,
top=(294-20)/294,
bottom=20/294,
wspace=0.2, hspace=0.5)
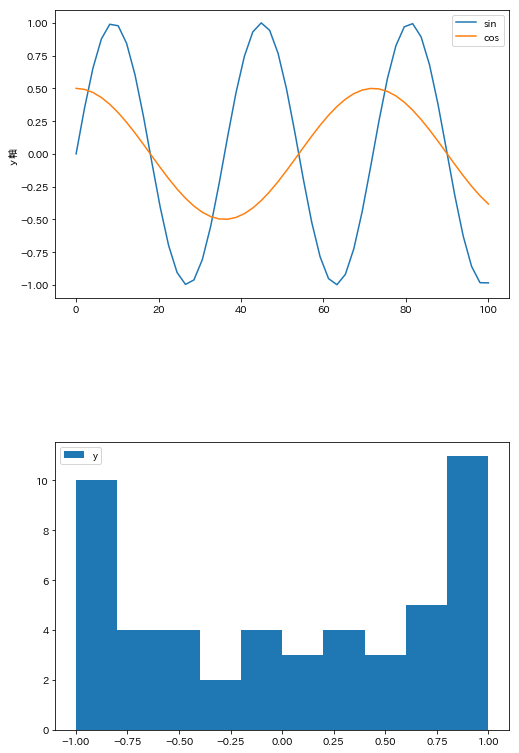
plt.subplot(211)
plt.plot(x, y, label='sin')
plt.plot(x, y2, label='cos')
plt.legend()
plt.ylabel('y軸')
plt.subplot(212)
plt.hist(y, label='y')
plt.legend()
plt.savefig('matplot_a4.pdf')