今回はログ収集からログ可視化まで、具体的な設定内容について記載します。
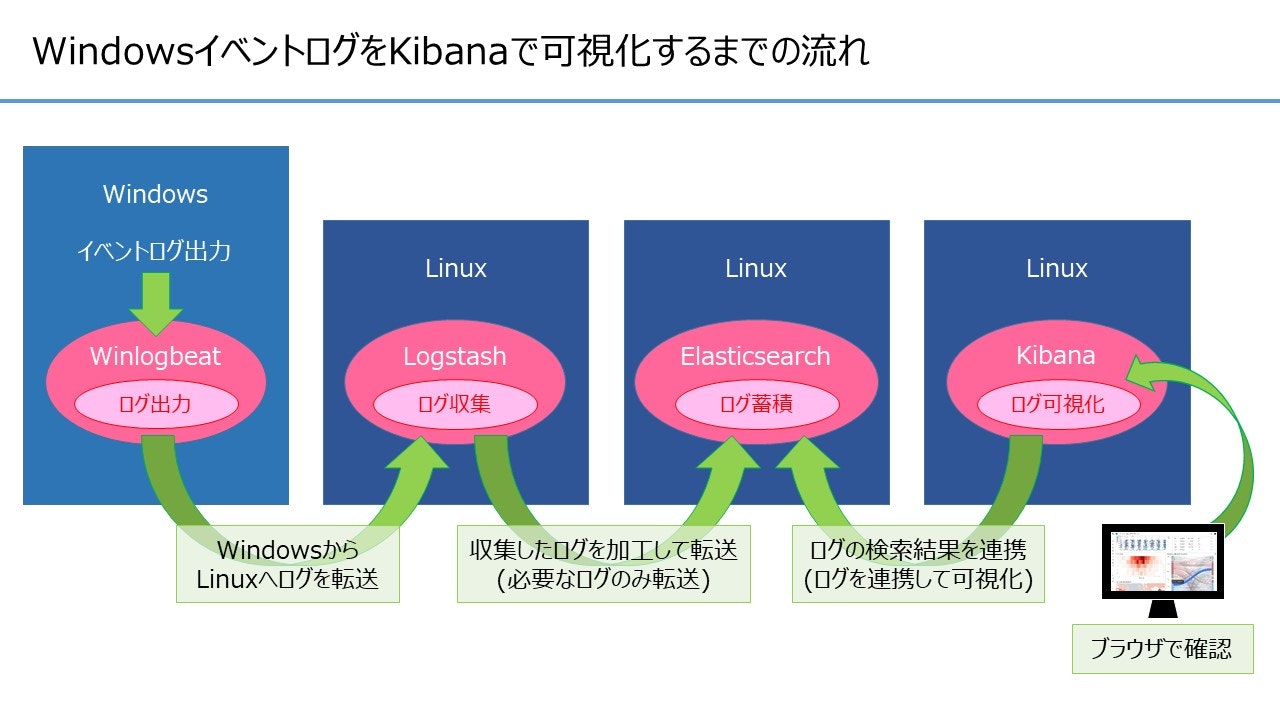
検証時のデータ処理の流れ(おさらい)
「Windowsイベントログからログイン成功/失敗のログを収集・(可視化するために)集計」し、不正アクセスの疑いを検知出来るようにするために、以下の流れでデータを処理します。
各ツールの設定
各ツールの設定ファイルについて記載します。
Winlogbeat の設定
- 設定ファイル
C:\<Winlogbeatをインストールしたフォルダ>\winlogbeat-7.4.2-windows-x86_64\winlogbeat.yml
Winlogbeat から Logstash にログを転送する設定を行います。
Windows イベントログはログ量が多いため、今回はログオン・ログオフの操作が記録される Security ログのみ転送するようにしました。
Winlogbeat 自体で不要なログの削除、ログの整形を行う事も可能ですが、今回は Logstash における filter の検証を行うため、それらは使用していません。
# ======================= Winlogbeat specific options ===========================

winlogbeat.event_logs:
  # - name: Application
  #   ignore_older: 72h

  # - name: System

  - name: Security
    processors:
      - script:
          lang: javascript
          id: security
          file: ${path.home}/module/security/config/winlogbeat-security.js

  # - name: Microsoft-Windows-Sysmon/Operational
  #   processors:
  #     - script:
  #         lang: javascript
  #         id: sysmon
  #         file: ${path.home}/module/sysmon/config/winlogbeat-sysmon.js


# ==================== Elasticsearch template settings ==========================

setup.template.settings:
  index.number_of_shards: 1


# ============================== Kibana =====================================
# Kibana API の設定を行う場合に利用します。
setup.kibana:
  host: "172.31.43.233:5601"


# ================================ Outputs =====================================

output.logstash:
  hosts: ["172.31.43.233:5044"]


# ================================ Processors =====================================
# Winlogbeat で生成されるログの削除や整形の設定を行う場合に利用します。
processors:
  - add_host_metadata: ~
  - add_cloud_metadata: ~
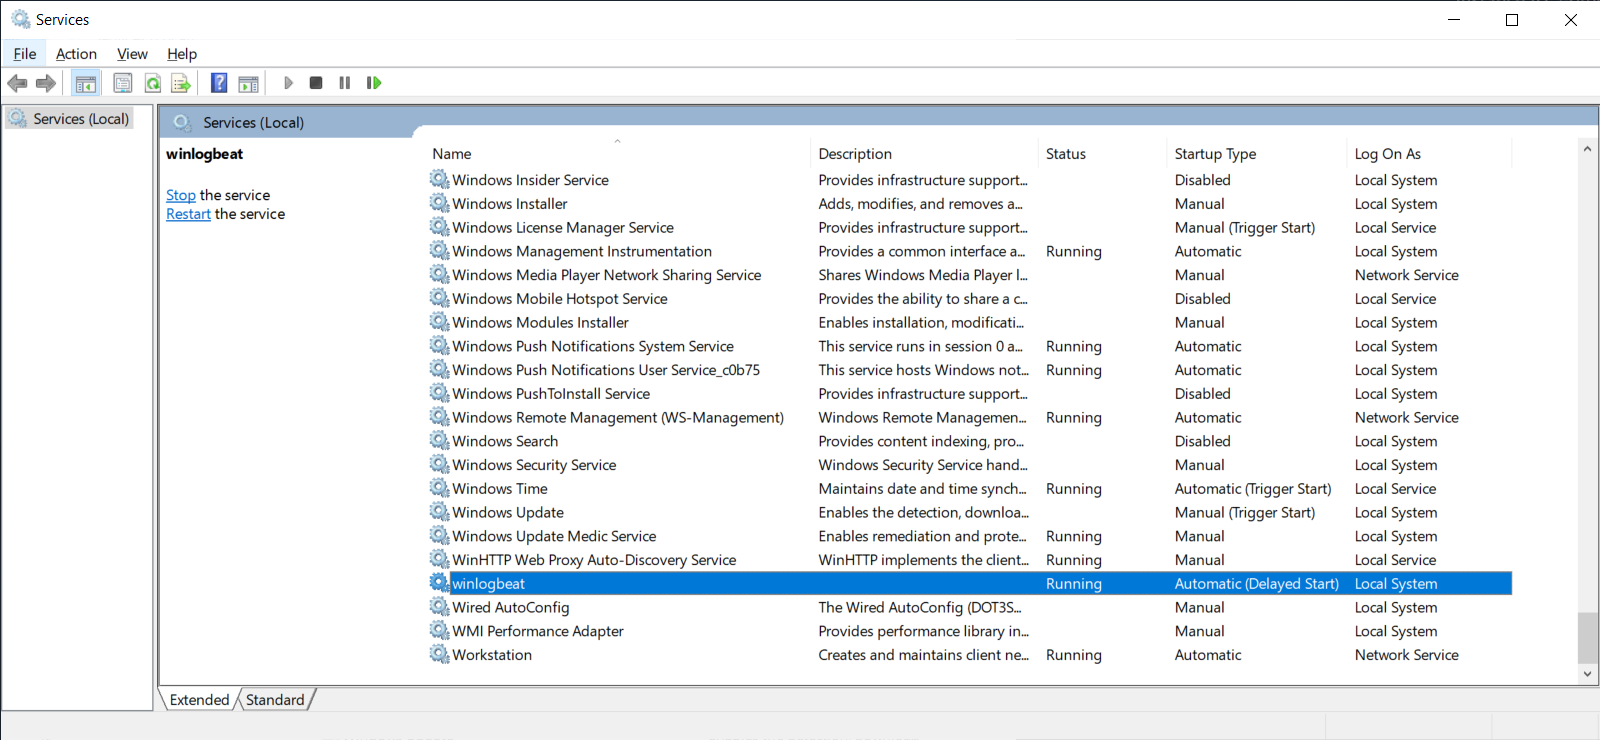
- サービス起動確認
Windowsサービスの管理画面で Status が Running になっていれば起動しています。
Logstash の設定
- 設定ファイル①
/etc/logstash/pipelines.yml
ログ取得(Input) > 整形(Filter) > 投入(Output) の設定を行うファイルを指定します。
デフォルトでは`/etc/logstash/conf.d/`配下の全ての.confファイルを読み込みます。
今回は新規で作成した`/etc/logstash/conf.d/logstash.conf`を指定しました。
- pipeline.id: main
  # path.config: "/etc/logstash/conf.d/*.conf"
  path.config: "/etc/logstash/conf.d/logstash.conf"
- 設定ファイル②
/etc/logstash/conf.d/logstash.conf
ログ取得(Input) > 整形(Filter) > 投入(Output) の設定を行います。
ファイル名は任意ですが、`/etc/logstash/pipelines.yml`で指定したパスと合わせる必要があります。 - input { }:Winlogbeatからログを取得する設定 - filter { }:取得したログを整形する設定 - output { }:整形したログをElasticsearchに投入する設定
input {
    beats {
        port => 5044
    }
}

filter {
    # event id で filter する
    if [winlog][event_id] != 4624 and [winlog][event_id] != 4625 {
        drop {}
    }
    # 日時を JST に整形する
    ruby {
        code => "event.set( 'date', Time.parse( event.get('[event][created]').to_s ).localtime('+09:00').strftime('%Y-%m-%dT%H:%M:%S+0900') )"
    }
    # index 名につける年月日を整形する
    ruby {
        code => "event.set( '[@metadata][index_date]', Time.parse( event.get('[event][created]').to_s ).localtime('+09:00').strftime('%Y%m%d') )"
    }
    # 項目名を変換する
    mutate {
        rename => {
        "[winlog][event_id]" => "event_id"
        "[winlog][event_data][LogonType]" => "log_on_type"
        "[user][name]"   => "account"
        "[user][domain]" => "account_domain"
        "[source][ip]"   => "network_address"
        }
        convert => {
        "log_on_type" => "integer"
        }
    }
    # Elasticsearch に登録する項目だけ残す
    prune {
        whitelist_names => [ "date", "event_id", "log_on_type", "account", "account_domain", "network_address" ]
    }
}

output {
    elasticsearch {
        hosts              => ["localhost:9200"]
        index              => "logon_event_%{[@metadata][index_date]}"
        template           => "/etc/logstash/templates/logon_event_template.json"
        template_name      => "logon_event"
        template_overwrite => true
        resurrect_delay    => 600
    }
}
値の取り出し方について
以下の長い引用部分は生ログ(1行分のみ)です。
上記 logstash.conf で設定した "[winlog][event_id]" や "[user][name]" などの値は、生ログから項目を見つけ出して取り出します。
例えば "[winlog][event_id]" の値であれば、生ログの中の "winlog" の項目に含まれる "event_id" の値(以下の例では 4624 )を取り出しています。
生ログから取り出している項目と値を強調表示しておきます。
{
"winlog":{"computer_name":"EC2AMAZ-DP92PI7","provider_name":"Microsoft-Windows-Security-Auditing","process":{"pid":736,"thread":{"id":776}},"api":"wineventlog"
,"activity_id":"{6072c47c-b4bd-0000-5ec5-7260bdb4d501}","task":"Logon","keywords":["Audit Success"],"logon":{"id":["0x0","0x3105b"],"type":"Network"},"version":2,"channel":"Security","record_id":26592,"provider_guid":"{54849625-5478-4994-a5ba-3e3b0328c30d}","event_id":4624,"event_data":{"TargetLogonId":"0x3105b","LogonProcessName":"NtLmSsp ","ElevatedToken":"%%1842","TransmittedServices":"-","TargetOutboundUserName":"-","TargetOutboundDomainName":"-","LogonGuid":"{00000000-0000-0000-0000-000000000000}","SubjectLogonId":"0x0","TargetLinkedLogonId":"0x0","KeyLength":"128","ImpersonationLevel":"%%1833","SubjectUserSid":"S-1-0-0","SubjectUserName":"-","TargetUserSid":"S-1-5-21-4209486975-1383129935-3790452860-500","TargetUserName":"Administrator","TargetDomainName":"EC2AMAZ-DP92PI7","LmPackageName":"NTLM V2","VirtualAccount":"%%1843","RestrictedAdminMode":"-","LogonType":"3","SubjectDomainName":"-","AuthenticationPackageName":"NTLM"},"opcode":"Info"},"user":{"domain":"EC2AMAZ-DP92PI7","name":"Administrator","id":"S-1-5-21-4209486975-1383129935-3790452860-500"},"host":{"hostname":"EC2AMAZ-DP92PI7","architecture":"x86_64","name":"EC2AMAZ-DP92PI7","os":{"name":"Windows Server 2019 Datacenter","platform":"windows","kernel":"10.0.17763.864 (WinBuild.160101.0800)","build":"17763.864","family":"windows","version":"10.0"},"id":"d76ff6ea-e75b-457c-8358-5a3e0cfde06e"},"process":{"name":"-","pid":0,"executable":"-"},"cloud":{"instance":{"id":"i-0fb0a7bb135519b80"},"machine":{"type":"t2.micro"},"availability_zone":"ap-northeast-1a","account":{"id":"086997486593"},"region":"ap-northeast-1","provider":"aws","image":{"id":"ami-0c63fb8188f151fb7"}},"log":{"level":"information"},"agent":{"hostname":"EC2AMAZ-DP92PI7","id":"0cc34436-5733-4b20-b381-e8a96901cf21","type":"winlogbeat","ephemeral_id":"74b878f1-21ed-4804-9b37-76b1ec530c1b","version":"7.4.2"},"@version":"1","ecs":{"version":"1.1.0"},"event":{"kind":"event","module":"security","category":"authentication","code":4624,"outcome":"success","type":"authentication_success","created":"2019-12-17T09:40:13.079Z","action":"Logon"},"tags":["beats_input_codec_plain_applied","_grokparsefailure"],"source":{"domain":"xxx-xxxxxxx","ip":"xxx.xxx.xxx.xxx","port":0},"@timestamp":"2019-12-17T09:40:11.402Z","message":"An account was successfully logged on.\n\nSubject:\n\tSecurity ID:\t\tS-1-0-0\n\tAccount Name:\t\t-\n\tAccount Domain:\t\t-\n\tLogon ID:\t\t0x0\n\nLogon Information:\n\tLogon Type:\t\t3\n\tRestricted Admin Mode:\t-\n\tVirtual Account:\t\tNo\n\tElevated Token:\t\tYes\n\nImpersonation Level:\t\tImpersonation\n\nNew Logon:\n\tSecurity ID:\t\tS-1-5-21-4209486975-1383129935-3790452860-500\n\tAccount Name:\t\tAdministrator\n\tAccount Domain:\t\tEC2AMAZ-DP92PI7\n\tLogon ID:\t\t0x3105B\n\tLinked Logon ID:\t\t0x0\n\tNetwork Account Name:\t-\n\tNetwork Account Domain:\t-\n\tLogon GUID:\t\t{00000000-0000-0000-0000-000000000000}\n\nProcess Information:\n\tProcess ID:\t\t0x0\n\tProcess Name:\t\t-\n\nNetwork Information:\n\tWorkstation Name:\txxx-xxxxxxx\n\tSource Network Address:\txxx.xxx.xxx.xxx\n\tSource Port:\t\t0\n\nDetailed Authentication Information:\n\tLogon Process:\t\tNtLmSsp \n\tAuthentication Package:\tNTLM\n\tTransited Services:\t-\n\tPackage Name (NTLM only):\tNTLM V2\n\tKey Length:\t\t128\n\nThis event is generated when a logon session is created. It is generated on the computer that was accessed.\n\nThe subject fields indicate the account on the local system which requested the logon. This is most commonly a service such as the Server service, or a local process such as Winlogon.exe or Services.exe.\n\nThe logon type field indicates the kind of logon that occurred. The most common types are 2 (interactive) and 3 (network).\n\nThe New Logon fields indicate the account for whom the new logon was created, i.e. the account that was logged on.\n\nThe network fields indicate where a remote logon request originated. Workstation name is not always available and may be left blank in some cases.\n\nThe impersonation level field indicates the extent to which a process in the logon session can impersonate.\n\nThe authentication information fields provide detailed information about this specific logon request.\n\t- Logon GUID is a unique identifier that can be used to correlate this event with a KDC event.\n\t- Transited services indicate which intermediate services have participated in this logon request.\n\t- Package name indicates which sub-protocol was used among the NTLM protocols.\n\t- Key length indicates the length of the generated session key. This will be 0 if no session key was requested."}
なお、生ログを確認したい場合は logstash.conf 内の output { } の中に以下を追記すると、/var/log/logstash/raw.log に生ログが出力されます。
    file {
        path => "/var/log/logstash/raw.log"
    }
- 設定ファイル③
/etc/logstash/templates/logon_event_template.json
Elasticsearchで扱うログのデータ型を定義するためのテンプレートファイルです。
データ型の詳細は、[Elasticsearch によるログ収集と可視化(第一回)](https://qiita.com/wooheehan/items/39f59a5a1da61286e86b)を参照してください。
{
    "index_patterns": "logon_event_*",
    "version": 1,
    "mappings" : {
        "properties": {
            "date": {
                "type": "date",
                "format": "yyyy-MM-dd'T'HH:mm:ssZZ"
            },
            "event_id": {
                "type": "short"
            },
            "log_on_type": {
                "type": "short"
            },
            "account": {
                "type": "keyword"
            },
            "account_domain": {
                "type": "keyword"
            },
            "network_address": {
                "type": "ip"
            }
        }
    },
    "settings": {
    }
}
- 設定ファイル④
/etc/logstash/logstash.yml
Logstashの実行を制御するための設定ファイルです。
パイプラインの設定、設定ファイルの場所、ログオプション、その他のオプションの設定が行えます。
Winlogbeat からログを受け取るには、`http.host:`の設定をコメントアウトしておく必要があります。
メモ:
http.host:の設定は、デフォルトでコメントアウトされている。
設定が必要だと考えてコメントアウトを外していたが、http.host:の設定があると Winlogbeat と Logstash が繋がらない。
特定までに時間が掛かったのでメモとして残しておく。追記:
本件はローカル環境(Vagrant)では再現しなかった。
beats のアドレスは logstash.yml の http.host に依存せず、pipeline を読み込んだ際に自動的に解放されているため、原因は別にあると考えられる。
# http.host: "0.0.0.0"
- サービス起動確認
systemctlコマンドで Logstash の status を確認します。
"Active: active (running)" の出力が確認できれば Logstash は起動しています。
$ sudo systemctl status logstash
● logstash.service - logstash
   Loaded: loaded (/etc/systemd/system/logstash.service; enabled; vendor preset: disabled)
   Active: active (running) since Thu 2019-12-19 20:57:13 JST; 3min 35s ago
 Main PID: 4876 (java)
   CGroup: /system.slice/logstash.service
           mq4876 /bin/java -Xms1g -Xmx1g -XX:+UseConcMarkSweepGC -XX:CMSInitiatingOccupancyFraction=75 -XX:+UseCMSInitiatingOccupancyO...

Dec 19 20:57:36 ip-172-31-43-233.ap-northeast-1.compute.internal logstash[4876]: [2019-12-19T20:57:36,191][INFO ][logstash.outputs.e...n"}
Dec 19 20:57:36 ip-172-31-43-233.ap-northeast-1.compute.internal logstash[4876]: [2019-12-19T20:57:36,248][INFO ][logstash.outputs.elas...
Dec 19 20:57:36 ip-172-31-43-233.ap-northeast-1.compute.internal logstash[4876]: [2019-12-19T20:57:36,298][WARN ][org.logstash.instrume...
Dec 19 20:57:36 ip-172-31-43-233.ap-northeast-1.compute.internal logstash[4876]: [2019-12-19T20:57:36,302][INFO ][logstash.javapipel...>"}
Dec 19 20:57:36 ip-172-31-43-233.ap-northeast-1.compute.internal logstash[4876]: [2019-12-19T20:57:36,308][INFO ][logstash.outputs.e...ent
Dec 19 20:57:36 ip-172-31-43-233.ap-northeast-1.compute.internal logstash[4876]: [2019-12-19T20:57:36,962][INFO ][logstash.inputs.be...4"}
Dec 19 20:57:37 ip-172-31-43-233.ap-northeast-1.compute.internal logstash[4876]: [2019-12-19T20:57:37,031][INFO ][logstash.javapipel...n"}
Dec 19 20:57:37 ip-172-31-43-233.ap-northeast-1.compute.internal logstash[4876]: [2019-12-19T20:57:37,234][INFO ][org.logstash.beats...044
Dec 19 20:57:37 ip-172-31-43-233.ap-northeast-1.compute.internal logstash[4876]: [2019-12-19T20:57:37,287][INFO ][logstash.agent    ...[]}
Dec 19 20:57:37 ip-172-31-43-233.ap-northeast-1.compute.internal logstash[4876]: [2019-12-19T20:57:37,844][INFO ][logstash.agent    ...00}
Hint: Some lines were ellipsized, use -l to show in full.
Logstash が起動していない場合、以下コマンドを実行してサービスを起動します。
その後、再度サービス起動確認を行います。
$ sudo systemctl start logstash
$
$ sudo systemctl status logstash
● logstash.service - logstash
   Loaded: loaded (/etc/systemd/system/logstash.service; enabled; vendor preset: disabled)
   Active: active (running) since ...(省略)
サービスが起動しない、または、サービスは起動したが想定通りに動作していないように見える場合、/var/log/logstash/logstash-plain.logを確認します。
起動時に [ERROR ] が出た場合は致命的なエラー、[WARN ] が出た場合は設定ファイルに誤りがある場合が多いです。
Logstash の自動起動の設定を行う場合、以下コマンドを実行します。
$ sudo systemctl enable logstash.service
Created symlink from /etc/systemd/system/multi-user.target.wants/logstash.service to /etc/systemd/system/logstash.service.
自動起動の設定状況は以下のように確認することができます。(後述の Elasticsearch と Kibana も同様です。)
$ sudo systemctl status logstash
● logstash.service - logstash
   Loaded: loaded (/etc/systemd/system/logstash.service; enabled; vendor preset: disabled)
   Active: active (running) since ...(省略)        ↑
                               自動起動が設定済みの場合は enabled になる。
Elasticsearch の設定
今回は設定変更は行わず、デフォルトのまま使用します。
- サービス起動確認
systemctlコマンドで Elasticsearch の status を確認します。
"Active: active (running)" の出力が確認できれば Elasticsearch は起動しています。
$ sudo systemctl status elasticsearch
● elasticsearch.service - Elasticsearch
   Loaded: loaded (/usr/lib/systemd/system/elasticsearch.service; enabled; vendor preset: disabled)
   Active: active (running) since Thu 2019-12-19 21:30:15 JST; 27s ago
     Docs: http://www.elastic.co
 Main PID: 5256 (java)
   CGroup: /system.slice/elasticsearch.service
           tq5256 /usr/share/elasticsearch/jdk/bin/java -Xms1g -Xmx1g -XX:+UseConcMarkSweepGC -XX:CMSInitiatingOccupancyFraction=75 -XX...
           mq5348 /usr/share/elasticsearch/modules/x-pack-ml/platform/linux-x86_64/bin/controller

Dec 19 21:30:02 ip-172-31-43-233.ap-northeast-1.compute.internal systemd[1]: Starting Elasticsearch...
Dec 19 21:30:03 ip-172-31-43-233.ap-northeast-1.compute.internal elasticsearch[5256]: OpenJDK 64-Bit Server VM warning: Option UseCo...se.
Dec 19 21:30:15 ip-172-31-43-233.ap-northeast-1.compute.internal systemd[1]: Started Elasticsearch.
Hint: Some lines were ellipsized, use -l to show in full.
上記の例ではOpenJDKのエラーが出ていますが、UseConcMarkSweepGC オプションが廃止された旨が書かれていました。
無視しても構わないと思いますが、/etc/elasticsearch/jvm.options の "-XX:+UseConcMarkSweepGC" をコメントアウトすればエラーは出なくなりました。
Elasticsearch が起動していない場合、以下コマンドを実行してサービスを起動します。
その後、再度サービス起動確認を行います。
$ sudo systemctl start elasticsearch
$
$ sudo systemctl status elasticsearch
● elasticsearch.service - Elasticsearch
   Loaded: loaded (/usr/lib/systemd/system/elasticsearch.service; enabled; vendor preset: disabled)
   Active: active (running) since ...(省略)
Elasticsearch の自動起動の設定を行う場合、以下コマンドを実行します。
$ sudo systemctl enable elasticsearch.service
Created symlink from /etc/systemd/system/multi-user.target.wants/elasticsearch.service to /usr/lib/systemd/system/elasticsearch.service.
サービス起動後の確認
サービス起動後、curlコマンドで以下①~④の確認が最低限必要です。
① 起動確認:_cat/health?v
1台構成の場合、status は yellow になります。
$ curl http://localhost:9200/_cat/health?v
epoch      timestamp cluster       status node.total node.data shards pri relo init unassign pending_tasks max_task_wait_time active_shards_percent
1577076238 04:43:58  elasticsearch yellow          1         1     17  17    0    0       14             0                  -                 54.8%
② template 登録確認:_templates/template名
template名は logstash.conf 内の output -> elasticsearch -> template_name で指定した名前になります。
/etc/logstash/templates/logon_event_template.json ではないので注意が必要です。
$ curl http://localhost:9200/_template/logon_event
{"logon_event":{"order":0,"version":1,"index_patterns":["logon_event_*"],"settings":{},"mappings":{"properties":{"date":{"format":"yyyy-MM-dd'T'HH:mm:ssZZ","type":"date"},"event_id":{"type":"short"},"account_domain":{"type":"keyword"},"network_address":{"type":"ip"},"log_on_type":{"type":"short"},"account":{"type":"keyword"}}},"aliases":{}}}

# 結果を見やすくしたい場合は以下のように実行する
$ curl http://localhost:9200/_template/logon_event?pretty
{
  "logon_event" : {
    "order" : 0,
    "version" : 1,
    "index_patterns" : [
      "logon_event_*"
    ],
    "settings" : { },
    "mappings" : {
      "properties" : {
        "date" : {
          "format" : "yyyy-MM-dd'T'HH:mm:ssZZ",
          "type" : "date"
        },
        "event_id" : {
          "type" : "short"
        },
        "account_domain" : {
          "type" : "keyword"
        },
        "network_address" : {
          "type" : "ip"
        },
        "log_on_type" : {
          "type" : "short"
        },
        "account" : {
          "type" : "keyword"
        }
      }
    },
    "aliases" : { }
  }
}
③ index 登録確認:_cat/indices
対象の index が登録されていることを確認します。
$ curl http://localhost:9200/_cat/indices
yellow open logon_event_20191221                                    cmTnDqRTTcK-HC9zmcsNBA 1 1   50  0  43.6kb  43.6kb
yellow open logon_event_20191217                                    u76prV2OS0i9ssxqtPFseA 1 1    0  0    283b    283b
yellow open logon_event_20191222                                    lpPYxEtjQWO5kkBVinr8Nw 1 1   36  0  18.6kb  18.6kb
yellow open logon_event_20191223                                    BsQEZFLoQRqpbLS2dV26xw 1 1  272  0  61.3kb  61.3kb
yellow open logon_event_20191219                                    LNzgU-h3Q1ujSq0MxIfx5Q 1 1   50  0  41.9kb  41.9kb
④データ登録確認:index名/_search
対象の index にデータが登録されていることを確認します。
$ curl http://localhost:9200/logon_event_20191222/_search
{"took":1,"timed_out":false,"_shards":{"total":1,"successful":1,"skipped":0,"failed":0},"hits":{"total":{"value":36,"relation":"eq"},"max_score":1.0,"hits":[{"_index":"logon_event_20191222","_type":"_doc","_id":"aLysLW8BK6oXitToHspB","_score":1.0,"_source":{"account_domain":"NT AUTHORITY", ...(省略)

# 結果を見やすくしたい場合は以下のように実行する
$ curl http://localhost:9200/logon_event_20191222/_search?pretty
{
  "took" : 1,
  "timed_out" : false,
  "_shards" : {
    "total" : 1,
    "successful" : 1,
    "skipped" : 0,
    "failed" : 0
  },
  "hits" : {
    "total" : {
      "value" : 36,
      "relation" : "eq"
    },
    "max_score" : 1.0,
    "hits" : [
      {
        "_index" : "logon_event_20191222",
        "_type" : "_doc",
        "_id" : "aLysLW8BK6oXitToHspB",
        "_score" : 1.0,
        "_source" : {
          "account_domain" : "NT AUTHORITY",
          "date" : "2019-12-22T21:54:10+0900",
          "event_id" : 4624,
          "log_on_type" : 0,
          "account" : "SYSTEM"
        }
      },
(省略)
Kibana の設定
今回は設定変更は行わず、デフォルトのまま使用します。
- サービス起動確認
systemctlコマンドで Kibana の status を確認します。
"Active: active (running)" の出力が確認できれば Kibana は起動しています。
$ sudo systemctl status kibana
● kibana.service - Kibana
   Loaded: loaded (/etc/systemd/system/kibana.service; enabled; vendor preset: disabled)
   Active: active (running) since Thu 2019-12-19 21:39:59 JST; 24s ago
 Main PID: 5438 (node)
   CGroup: /system.slice/kibana.service
           mq5438 /usr/share/kibana/bin/../node/bin/node /usr/share/kibana/bin/../src/cli -c /etc/kibana/kibana.yml

Dec 19 21:39:59 ip-172-31-43-233.ap-northeast-1.compute.internal systemd[1]: Started Kibana.
Dec 19 21:39:59 ip-172-31-43-233.ap-northeast-1.compute.internal systemd[1]: Starting Kibana...
Kibana が起動していない場合、以下コマンドを実行してサービスを起動します。
その後、再度サービス起動確認を行います。
$ sudo systemctl start logstash
$
$ sudo systemctl status logstash
● kibana.service - Kibana
   Loaded: loaded (/etc/systemd/system/kibana.service; enabled; vendor preset: disabled)
   Active: active (running) since ...(省略)
Kibana の自動起動の設定を行う場合、以下コマンドを実行します。
$ sudo systemctl enable kibana.service
Created symlink from /etc/systemd/system/multi-user.target.wants/kibana.service to /etc/systemd/system/kibana.service.
Kibana によるログの可視化
ここからは Kibana の Web UI について記載します。
Kibana Web UI へのアクセス
ブラウザから以下にアクセスし、Kibana の Web UI が表示されることを確認します。
http://<kibanaサーバのIPアドレス>:5601
index パターン作成
可視化したいログの index のパターンを作成します。
左側メニューの Management のアイコンから設定画面を表示します。
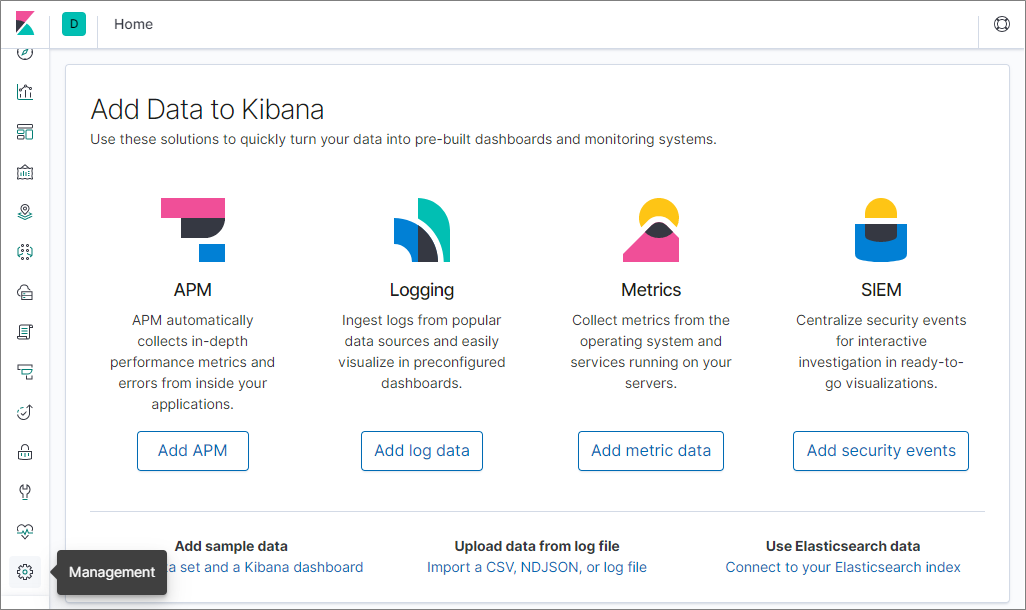
以下の通りに設定を進めます。
- Index Patterns のリンクをクリック
- [Create index pattern] ボタンをクリック
- Index pattern のテキストフォームにindex名を入力して、[Next step] のボタンをクリック
※今回はlogon_event_*と入力 - Time Filter field name のプルダウンから
dateを選択 - [Create index pattern] ボタンをクリック
続いて、ログを読み込んでいるか確認します。
- 左側メニューから Discover のアイコンをクリック
- 下図の赤枠①のプルダウンから先ほど設定した index を選択
※今回はlogon_event_*を選択 - 下図の赤枠②で対象ログの検索期間を指定
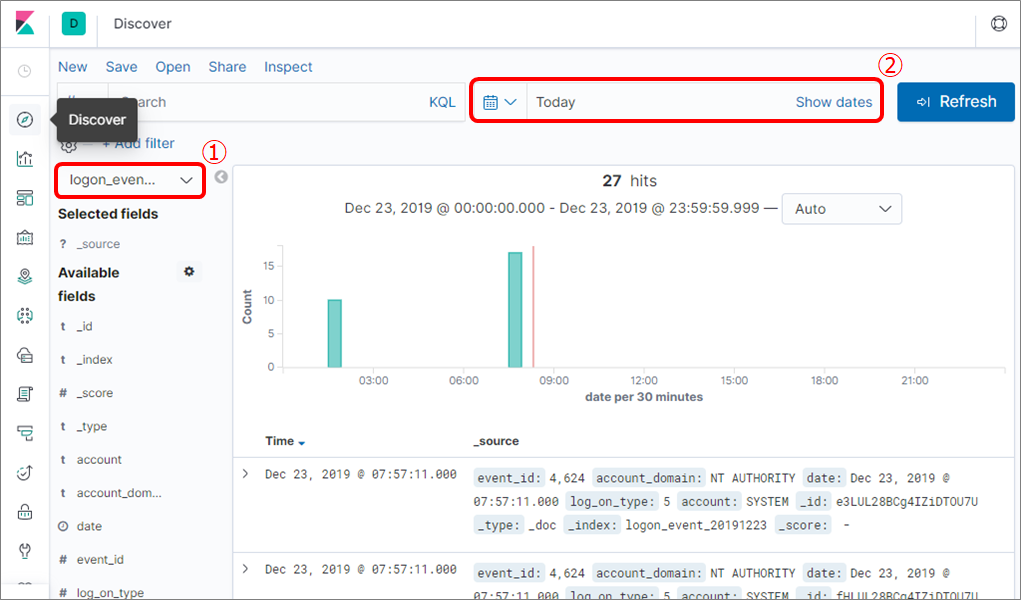
ログの表示が確認できれば index のパターン作成は完了です。
Visualize の設定
ログからグラフや表を作成して、ログを可視化します。
左側メニューの Visualize のアイコンから設定画面を表示します。
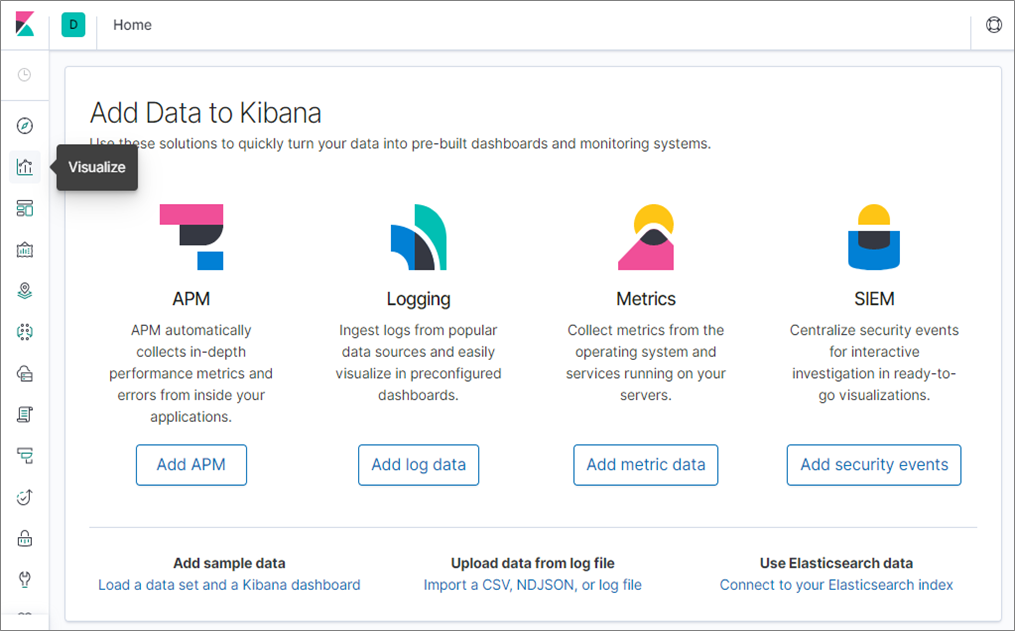
以下の通りに設定を進めます。( Visualize には様々な機能があります。以下は一例です。)
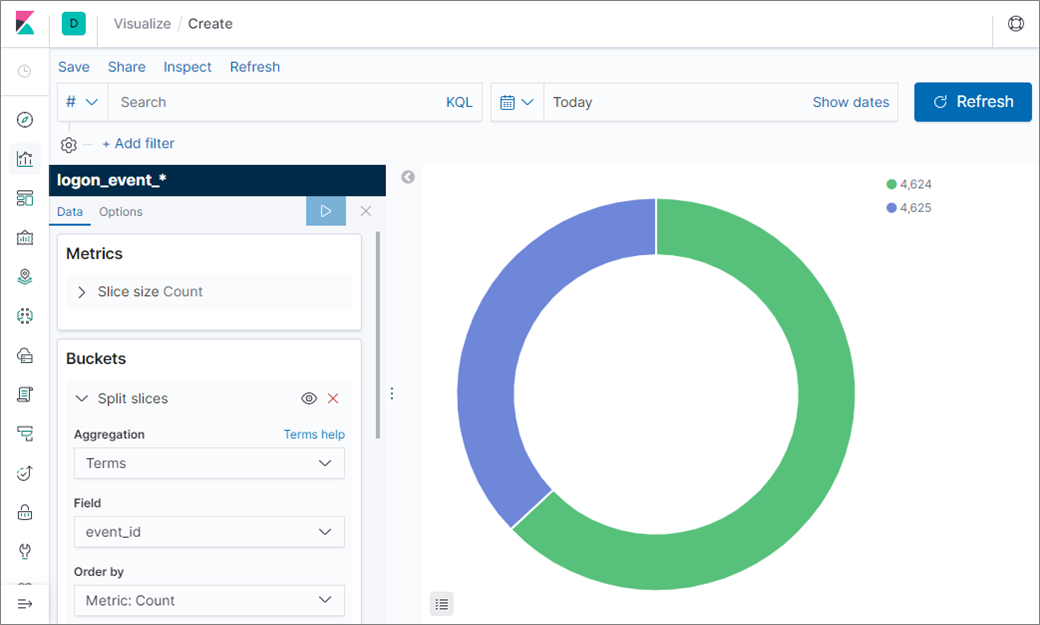
- [Create new visualization] ボタンをクリック
- 作成したいグラフや表の種類を選択
※今回は Pie を選択 - 可視化するログの index名 を選択
※今回はlogon_event_*を選択 - Buckets のパネルにある Add をクリックし、Split slices を選択
- Aggregation のプルダウンから Terms を選択
- Field のプルダウンから可視化したい Field を選択
※今回はevent_idを選択 - ▷ボタンをクリック
画面右側にグラフが表示できれば Visualize は成功です。
※対象ログの検索期間にログが1件も存在しない場合はグラフが表示されません。
Visualize の設定を保存します。
- 画面左上の Save をクリック
- Title のテキストフォームに任意の値を入力
- [Confirm Save] ボタンをクリック
再度、左側メニューの Visualize のアイコンをクリックして、作成した Visualize があれば設定は完了です。
Dashboard の設定
Visualize で作成したグラフや表を Dashboard に設置します。
Dashboard を使うと、1つの画面で複数の情報をまとめて確認できるようになります。
左側メニューの Dashboards のアイコンから設定画面を表示します。
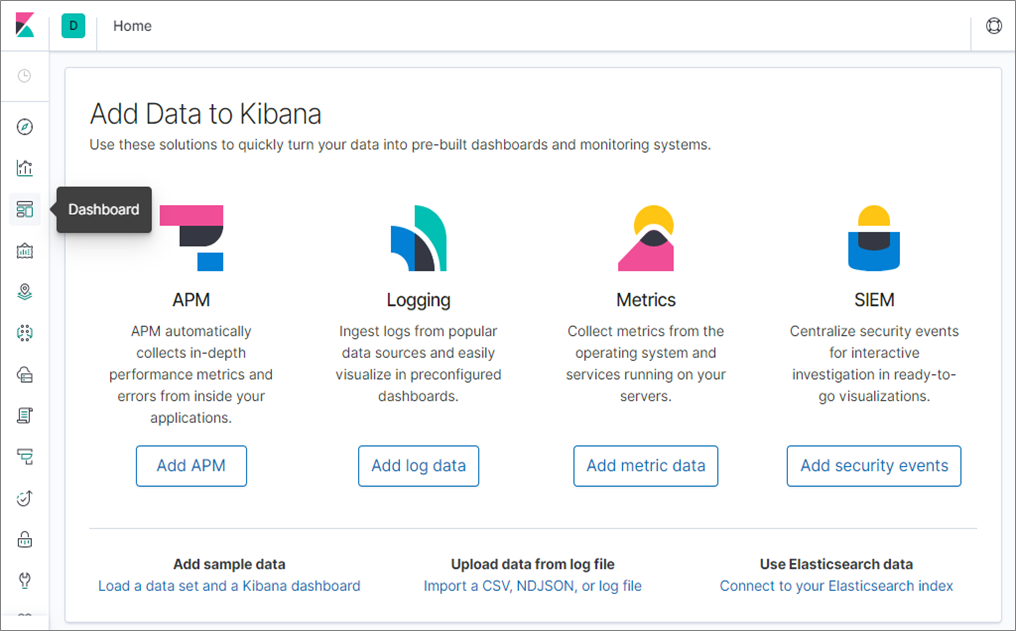
以下の通りに設定を進めます。
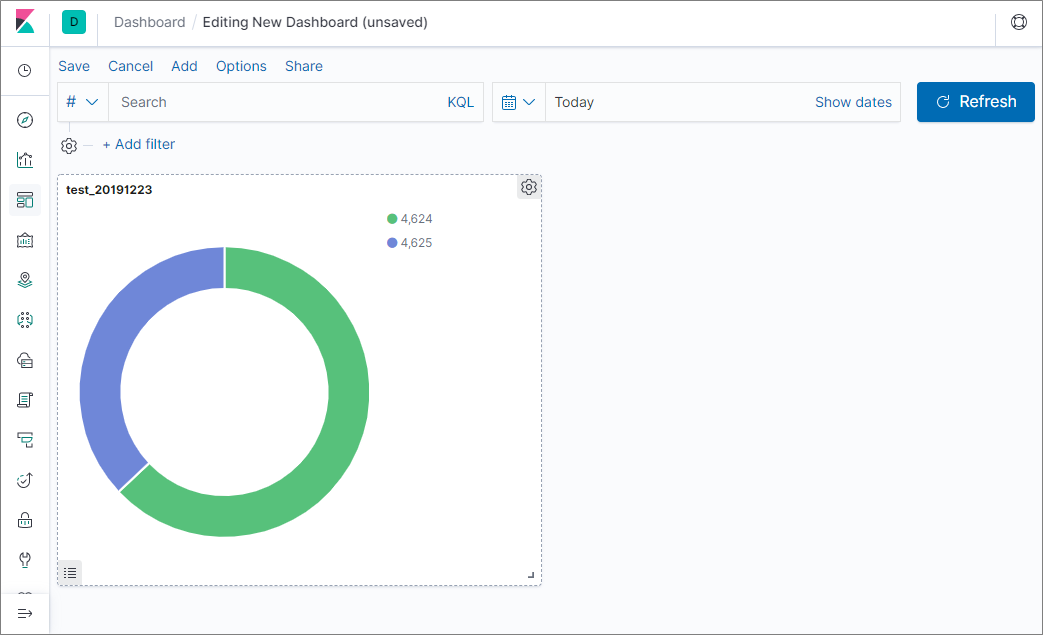
- [Create new dashboard] ボタンをクリック
- 画面左上の Add をクリック
- Add panels のパネルから、設置したい Visualize を選択
※選択した時点で Dashboard に Visualize を - Dashboard に Visualize が設置されているので、Add panels のパネルの [×] ボタンをクリック
画面にグラフが表示できれば Dashboard の作成は成功です。
※対象ログの検索期間にログが1件も存在しない場合はグラフが表示されません。
Dashboard の設定を保存します。
- 画面左上の Save をクリック
- Title のテキストフォームに任意の値を入力
- [Confirm Save] ボタンをクリック
再度、左側メニューの Dashboard のアイコンをクリックして、作成した Dashboard があれば設定は完了です。
不正アクセスの疑いを検知するための Dashboard
Visualize や Dashboard の機能でログを可視化することで、不正アクセスの疑いを視覚的に検知できるようになります。
Sample Dashboard
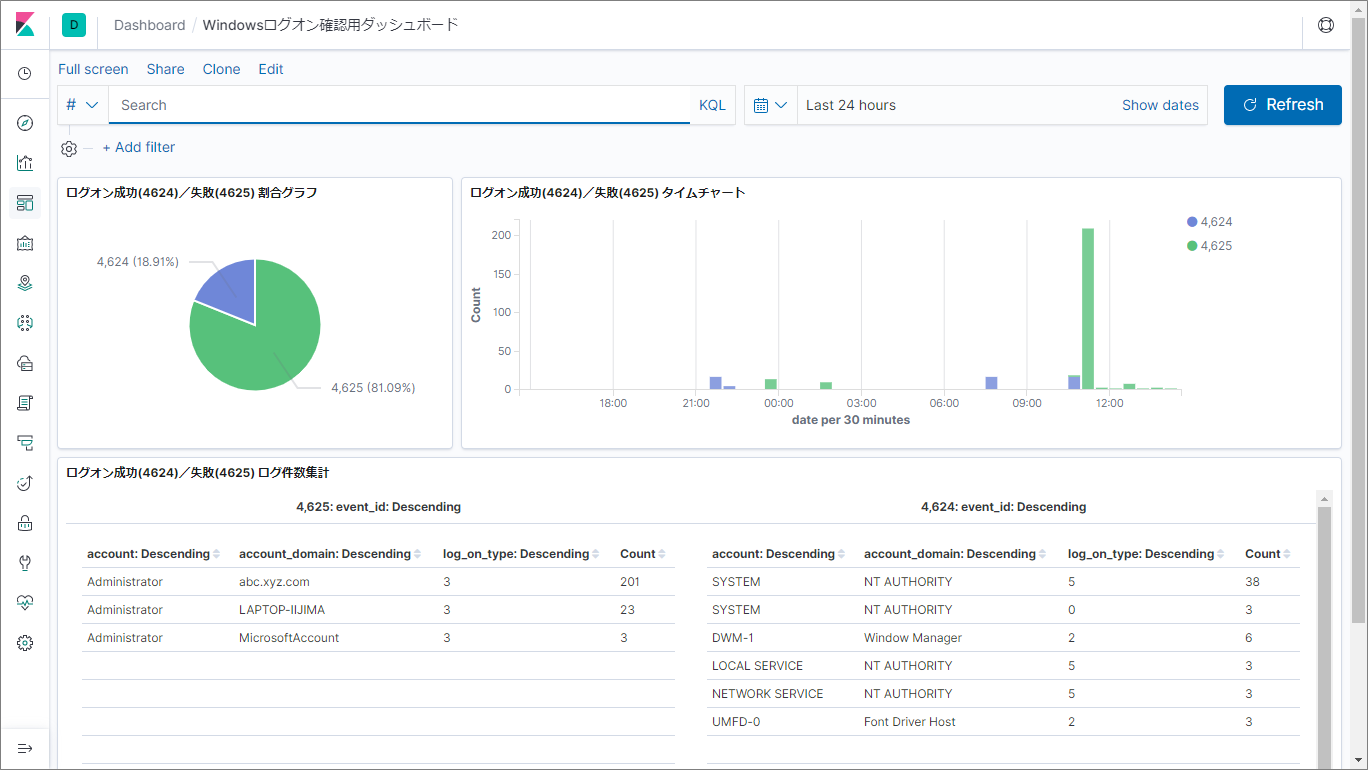
上図の Dashboard では、例えばログオン失敗のログ(event_id:4625)が多数検出された場合、不正アクセスの疑いがあるので詳細な調査を行うきっかけになります。
[参考] 苦労した点
今回は基本的な内容を中心に検証を行いましたが、どこにどの設定を書けば良いのか迷ってしまったり、設定ファイルに誤りがあって想定通りの動作をさせるまでに時間が掛かったりと、苦労する場面もありました。
参考までに特に苦労した点を以下に記載します。
logstash の Port を外部に公開する方法
今回でいうなら、WinLogBeat から Logstash に繋げる方法。
- Elasticsearch 同様、http.host を "0.0.0.0" で公開していたが、この状態では Winlogbeat(別ホスト) から参照できなかった
- logstash.yml の http.host の指定を消さないと外部ホストからアクセスできないようだ
追記:
本件はローカル環境(Vagrant)では再現しなかった。
beats のアドレスは logstash.yml の http.host に依存せず、pipeline を読み込んだ際に自動的に解放されているため、原因は別にあると考えられる。
logstash で prune filter を使って 必要な項目だけを抽出する
logstash で不要な項目を消すには remove_field という共通オプションを使用すればよいが、Winlogbeat のように不要な項目が多すぎる場合は手間がかかる。
このとき、prune filter と whitelist_names のオプションを指定することで、必要なファイルだけを残して不要な項目を消すことができる。
https://www.elastic.co/guide/en/logstash/current/plugins-filters-prune.html
正規表現対応になっているので完全一致する際は文字列を ^$ で括る必要あり
※日本語では記事が無かったので英語で検索。
公式フォーラムの回答で prune filter を使えばできる、という回答を見つけた。
logstash における timezone の parse
logstash -> output -> elasticsearch において illegal_argument_exception が発生した。
date 型の parse で発生しており、timezone の +09:00 が指摘されていた。
- data 型データ例:
2019-12-24T11:22:33+09:00 - elasticsearch の
date format:yyyy-MM-dd'T'HH:mm:ssZZ(ZZ は timezone) - logstash 6.2.1 出は発生しなかった。7.4.2 だと発生する
公式ドキュメントをたどっていくと、"date 型の parse は JAVA の日時指定に準拠する" と記載があった。
https://www.elastic.co/guide/en/elasticsearch/reference/current/mapping-date-format.html#custom-date-formats
Java の公式ドキュメント(class DateTimeFormatter のページ)を見ると、Offset Z の項目に以下の様な記述がある。
https://docs.oracle.com/javase/8/docs/api/java/time/format/DateTimeFormatter.html
"without a colon, such as '+0130'"   => コロン無しで指定する
"Six or more letters throws IllegalArgumentException"  => 6文字以上はエラーになる
上記の記述から、今回 timezone に指定した "+09:00" の表記は上記のいずれにも反しているのでアウト(コロンがあり6文字)。
1つ目の指示通り "+0900"(コロン無し5文字)が正しいフォーマットだった。
さいごに
Elasticsearch によるログ収集と可視化について、全三回に渡って記事を掲載してきました。
来年以降の活動がどうなるかは未定ですが、私たちの記事を最後まで読んで頂きありがとうございました。