はじめに
この記事は FOSS4G Advent Calendar 2023 21日目の記事です。
Webブラウザで実行できるPython環境である Google Colaboratory ではFOSS4G Advent Calender 2023 5日目の記事でも紹介されているように、pip install hogehogeしなくてもimport hogehogeで利用できる地理空間系のライブラリがあります。
今回はそのようなライブラリやpip install osgeoで導入できる GDAL なども活用しつつブラウザのみで衛星画像を解析し、植生の正規化指標である NDVI ( Normalized Difference Vegetation Index) の算出を2023年1年分の東京都の森林地域に対して行います。
(※観測時に雲量が一定度多い衛星画像を除外しているので、1年間としていますが、9ヶ月分のみで解析しました。)
使用データ・ライブラリ
データ
-
国土数値情報
-
行政区域データ 東京都 令和5年版
※多摩地域の森林地域に絞り込むため、埋立地や島しょ部は除外済み - 森林地域データ 東京都 平成27年版
-
行政区域データ 東京都 令和5年版
-
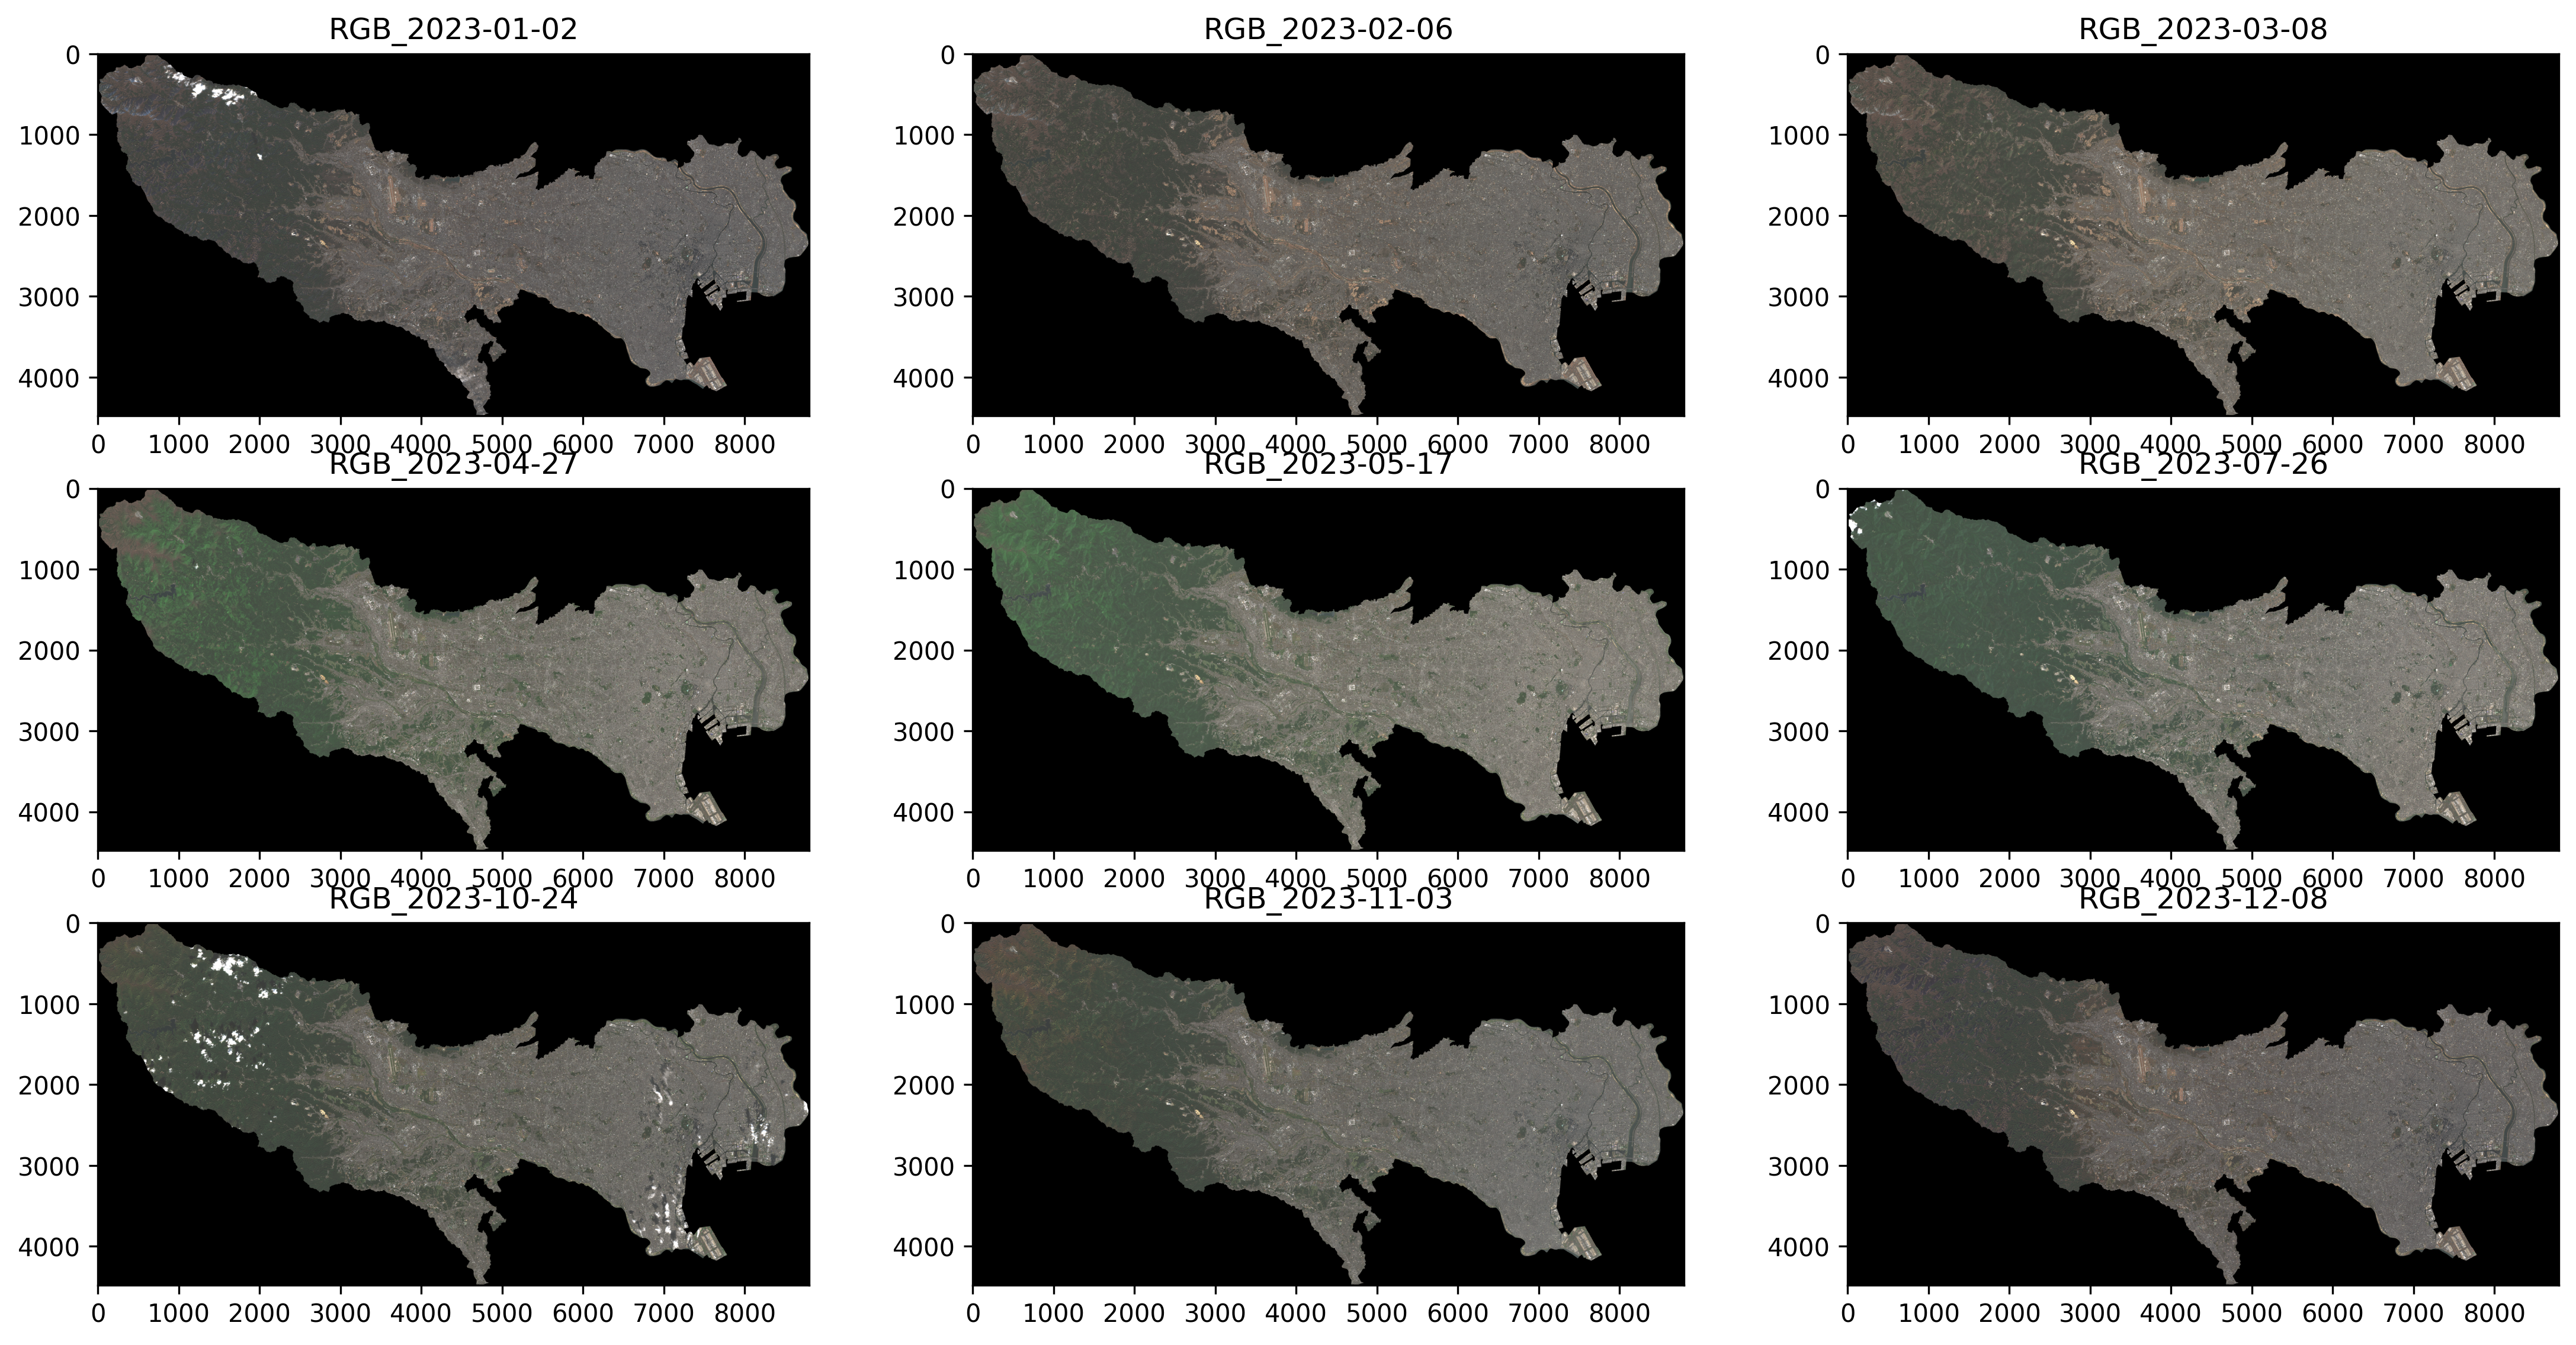
欧州宇宙機関ESA Sentinel-2(提供サイト:https://dataspace.copernicus.eu/) より下記の観測日
※ 衛星や衛星画像の仕様等は省略します。- 2023-01-02
- 2023-02-06
- 2023-03-08
- 2023-04-27
- 2023-05-17
- 2023-07-26
- 2023-10-24
- 2023-11-03
- 2023-12-08
ライブラリ
データ準備
ESAのデータ提供サイトもしくはAPIを利用する際には アカウント登録 が必要になります。
こちらの『(1)衛星データで遊べる「EO Browser」の使い方』を参考にしてください。
また、今回は複数の月日を解析の対象としているため利用する衛星画像データの合計サイズが多くなります。(1日につき1GB強) 1日分のデータでもNDVIの解析は可能なので、必要に応じてデータを選択してください。
- 国土数値情報から行政区域データと森林地域データを任意の地域を選択してダウンロード
- ESAのデータ提供サイト(https://dataspace.copernicus.eu/)にアクセス、会員登録の後で Copernicus Browser で対象地域と日時などを選択後ダウンロード
- Googleドライブの任意のフォルダへ国土数値情報とESAからダウンロードしたデータを格納
環境構築
-
下記のコードでノートブックにGoogleドライブをマウント
input[1]from google.colab import drive drive.mount('/content/drive') -
Google Colaboratryにデフォルトでないライブラリをインストール
input[2]!pip install pygeos !pip install rasterio -
import
input[3]import os os.environ['USE_PYGEOS'] = '0' import numpy as np import geopandas as gpd import pandas as pd import matplotlib import fiona, shapely, pyproj, pygeos matplotlib.rcParams['figure.dpi'] = 300 # 解像度 import matplotlib.pyplot as plt import matplotlib.image as mpimg import rasterio as rio import rasterio.mask import zipfile import glob from IPython.display import Image from mpl_toolkits.axes_grid1 import make_axes_locatable from rasterio import plot from rasterio.plot import show from rasterio.plot import plotting_extent from rasterio.mask import mask from osgeo import gdal import warnings warnings.filterwarnings('ignore') print("done") -
作業ディレクトリの作成
input[4]os.makedirs('work', exist_ok=True) PATH = '/content/' WORK_PATH = '/content/work' RGB_DIR = '/content/RGB_TIF' os.makedirs(RGB_DIR, exist_ok=True) NDVI_DIR = '/content/NDVI' os.makedirs(NDVI_DIR, exist_ok=True) NDVI_mask_DIR = '/content/NDVI_mask' os.makedirs(NDVI_mask_DIR, exist_ok=True)
解析
-
各データ読み込み
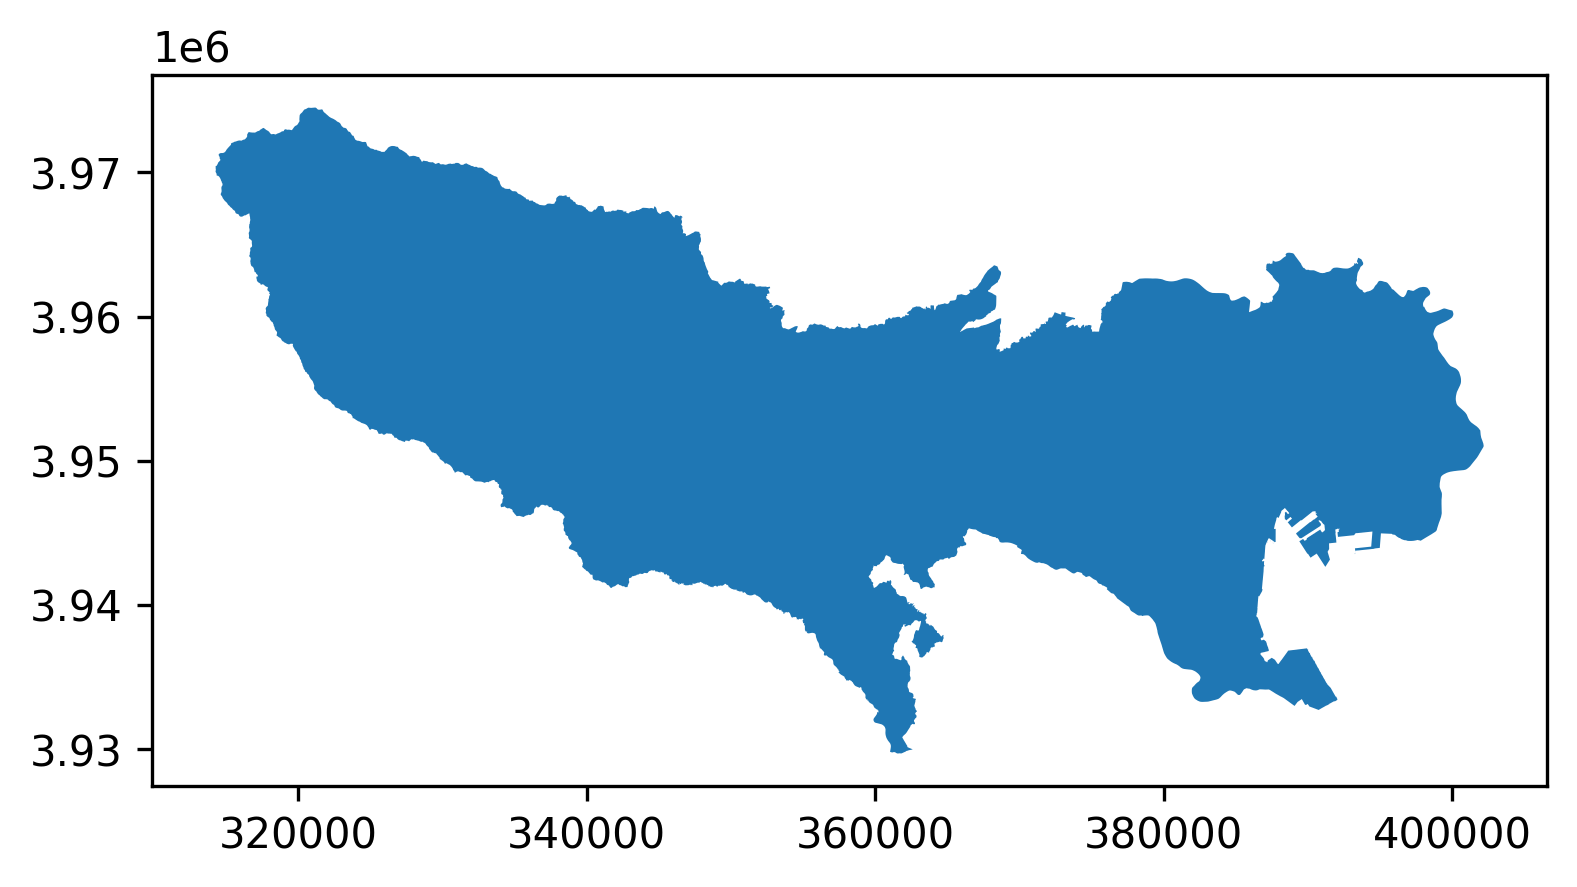
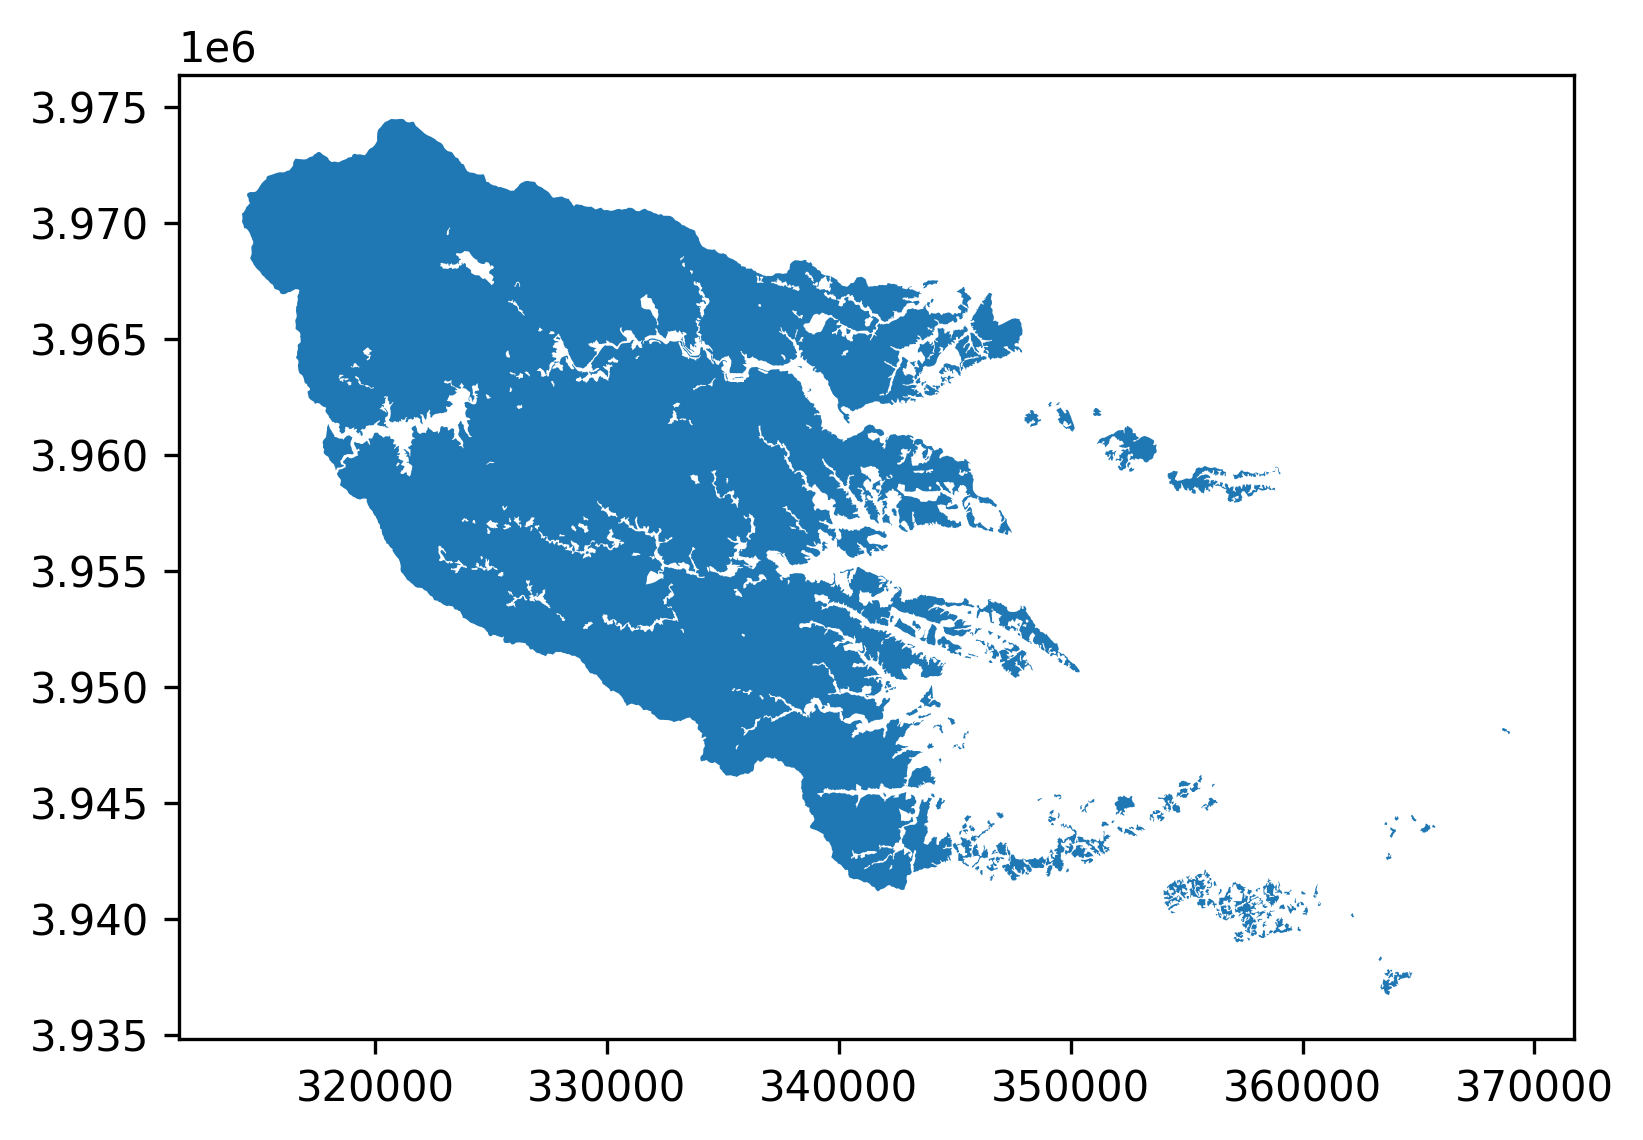
(今回は衛星画像や都道府県のポリゴンデータは同一のフォルダに格納しています。)input[5]# 衛星画像の読み込み DATA_PATH = 'ドライブ上のデータ保存先' file_path = glob.glob(os.path.join(DATA_PATH, '*.zip')) ziplst = [] for f in file_path: print(f[76:136]) ziplst.append(f[76:136]) for file_title in ziplst: print('--------------------------------') print('start unzip:', file_title) file_name = file_title + '.SAFE.zip' file_pass = os.path.join(DATA_PATH + file_name) print(file_pass) print('file unzip') with zipfile.ZipFile(file_pass) as zf: zf.extractall() print('unzip done') print('All file unzip done')input[5]# 東京都ポリゴンの読み込み in_shape = gpd.read_file(os.path.join(DATA_PATH + "TokyoPref.geojson"),encoding="utf-8") # 画像に合わせて投影変換 out_file = os.path.join(DATA_PATH + "re_TokyoPref.geojson") re_shape = in_shape.to_crs({"init": "epsg:32654"}) re_shape.to_file(driver="GeoJSON",filename=out_file,encoding='utf-8') print("done") f,ax = plt.subplots(1, figsize=(6,6)) ax = re_shape.plot(axes=ax) plt.show();input[6]# 森林地域ポリゴンの読み込み in_shape = gpd.read_file(os.path.join(DATA_PATH + "only_MainLand_a001130020160207.geojson"),encoding="utf-8") #画像に合わせて投影変換 out_forest_file = os.path.join(DATA_PATH + "re_only_MainLand_a001130020160207.geojson") re_shape = in_shape.to_crs({"init": "epsg:32654"}) #出力 re_shape.to_file(driver="GeoJSON",filename=out_file,encoding='utf-8') print("done") #GeoDataFrameを描画 f,ax = plt.subplots(1, figsize=(6,6)) ax = re_shape.plot(axes=ax) plt.show(); -
1.で取得した森林地域を用いて衛星画像をクリップ(切り出し)を行って、クリップした画像からNDVIを算出
input[7]for file_title in ziplst: print("Start make NDVI " +'<'+ file_title +'>') path_A = str(file_title) + '.SAFE/GRANULE/' f1 = os.listdir(path_A) path_B = str(file_title) + '.SAFE/GRANULE/' + str(f1[0]) f2 = os.listdir(path_B) path_C = str(file_title) + '.SAFE/GRANULE/' + str(f1[0]) + '/IMG_DATA/R10m/' f3 = os.listdir(path_C) b4 = rio.open(str(file_title) + '.SAFE/GRANULE/' + str(f1[0]) +'/IMG_DATA/R10m/' +str(f3[0][0:23] +'B04_10m.jp2')) b8 = rio.open(str(file_title) + '.SAFE/GRANULE/' + str(f1[0]) +'/IMG_DATA/R10m/' +str(f3[0][0:23] +'B08_10m.jp2')) red = b4.read() nir = b8.read() ndvi = np.where(((red != 0) & (nir != 0)), (nir.astype(float) - red.astype(float)) / (nir.astype(float) + red.astype(float)), 0) out_meta = b4.meta out_meta.update(driver='GTiff') out_meta.update(dtype=rio.float32) NDVI_path = os.path.join(NDVI_DIR, 'sentinel-2_'+str(f3[0][7:15])+'_ndvi.tif') with rio.open(NDVI_path, 'w', **out_meta) as dst: dst.write(ndvi.astype(rio.float32)) print("---masking---") with fiona.open(out_file, "r") as mask: masks = [feature["geometry"] for feature in mask] with rio.open(NDVI_path) as src2: out_image_ndvi, out_transform = rasterio.mask.mask(src2, masks, crop=True) out_meta = src2.meta out_meta.update({"driver": "GTiff", "height": out_image_ndvi.shape[1], "width": out_image_ndvi.shape[2], "transform": out_transform}) with rio.open(NDVI_path, "w", **out_meta) as dst2: dst2.write(out_image_ndvi)- 各月のNDVI解析結果を出力
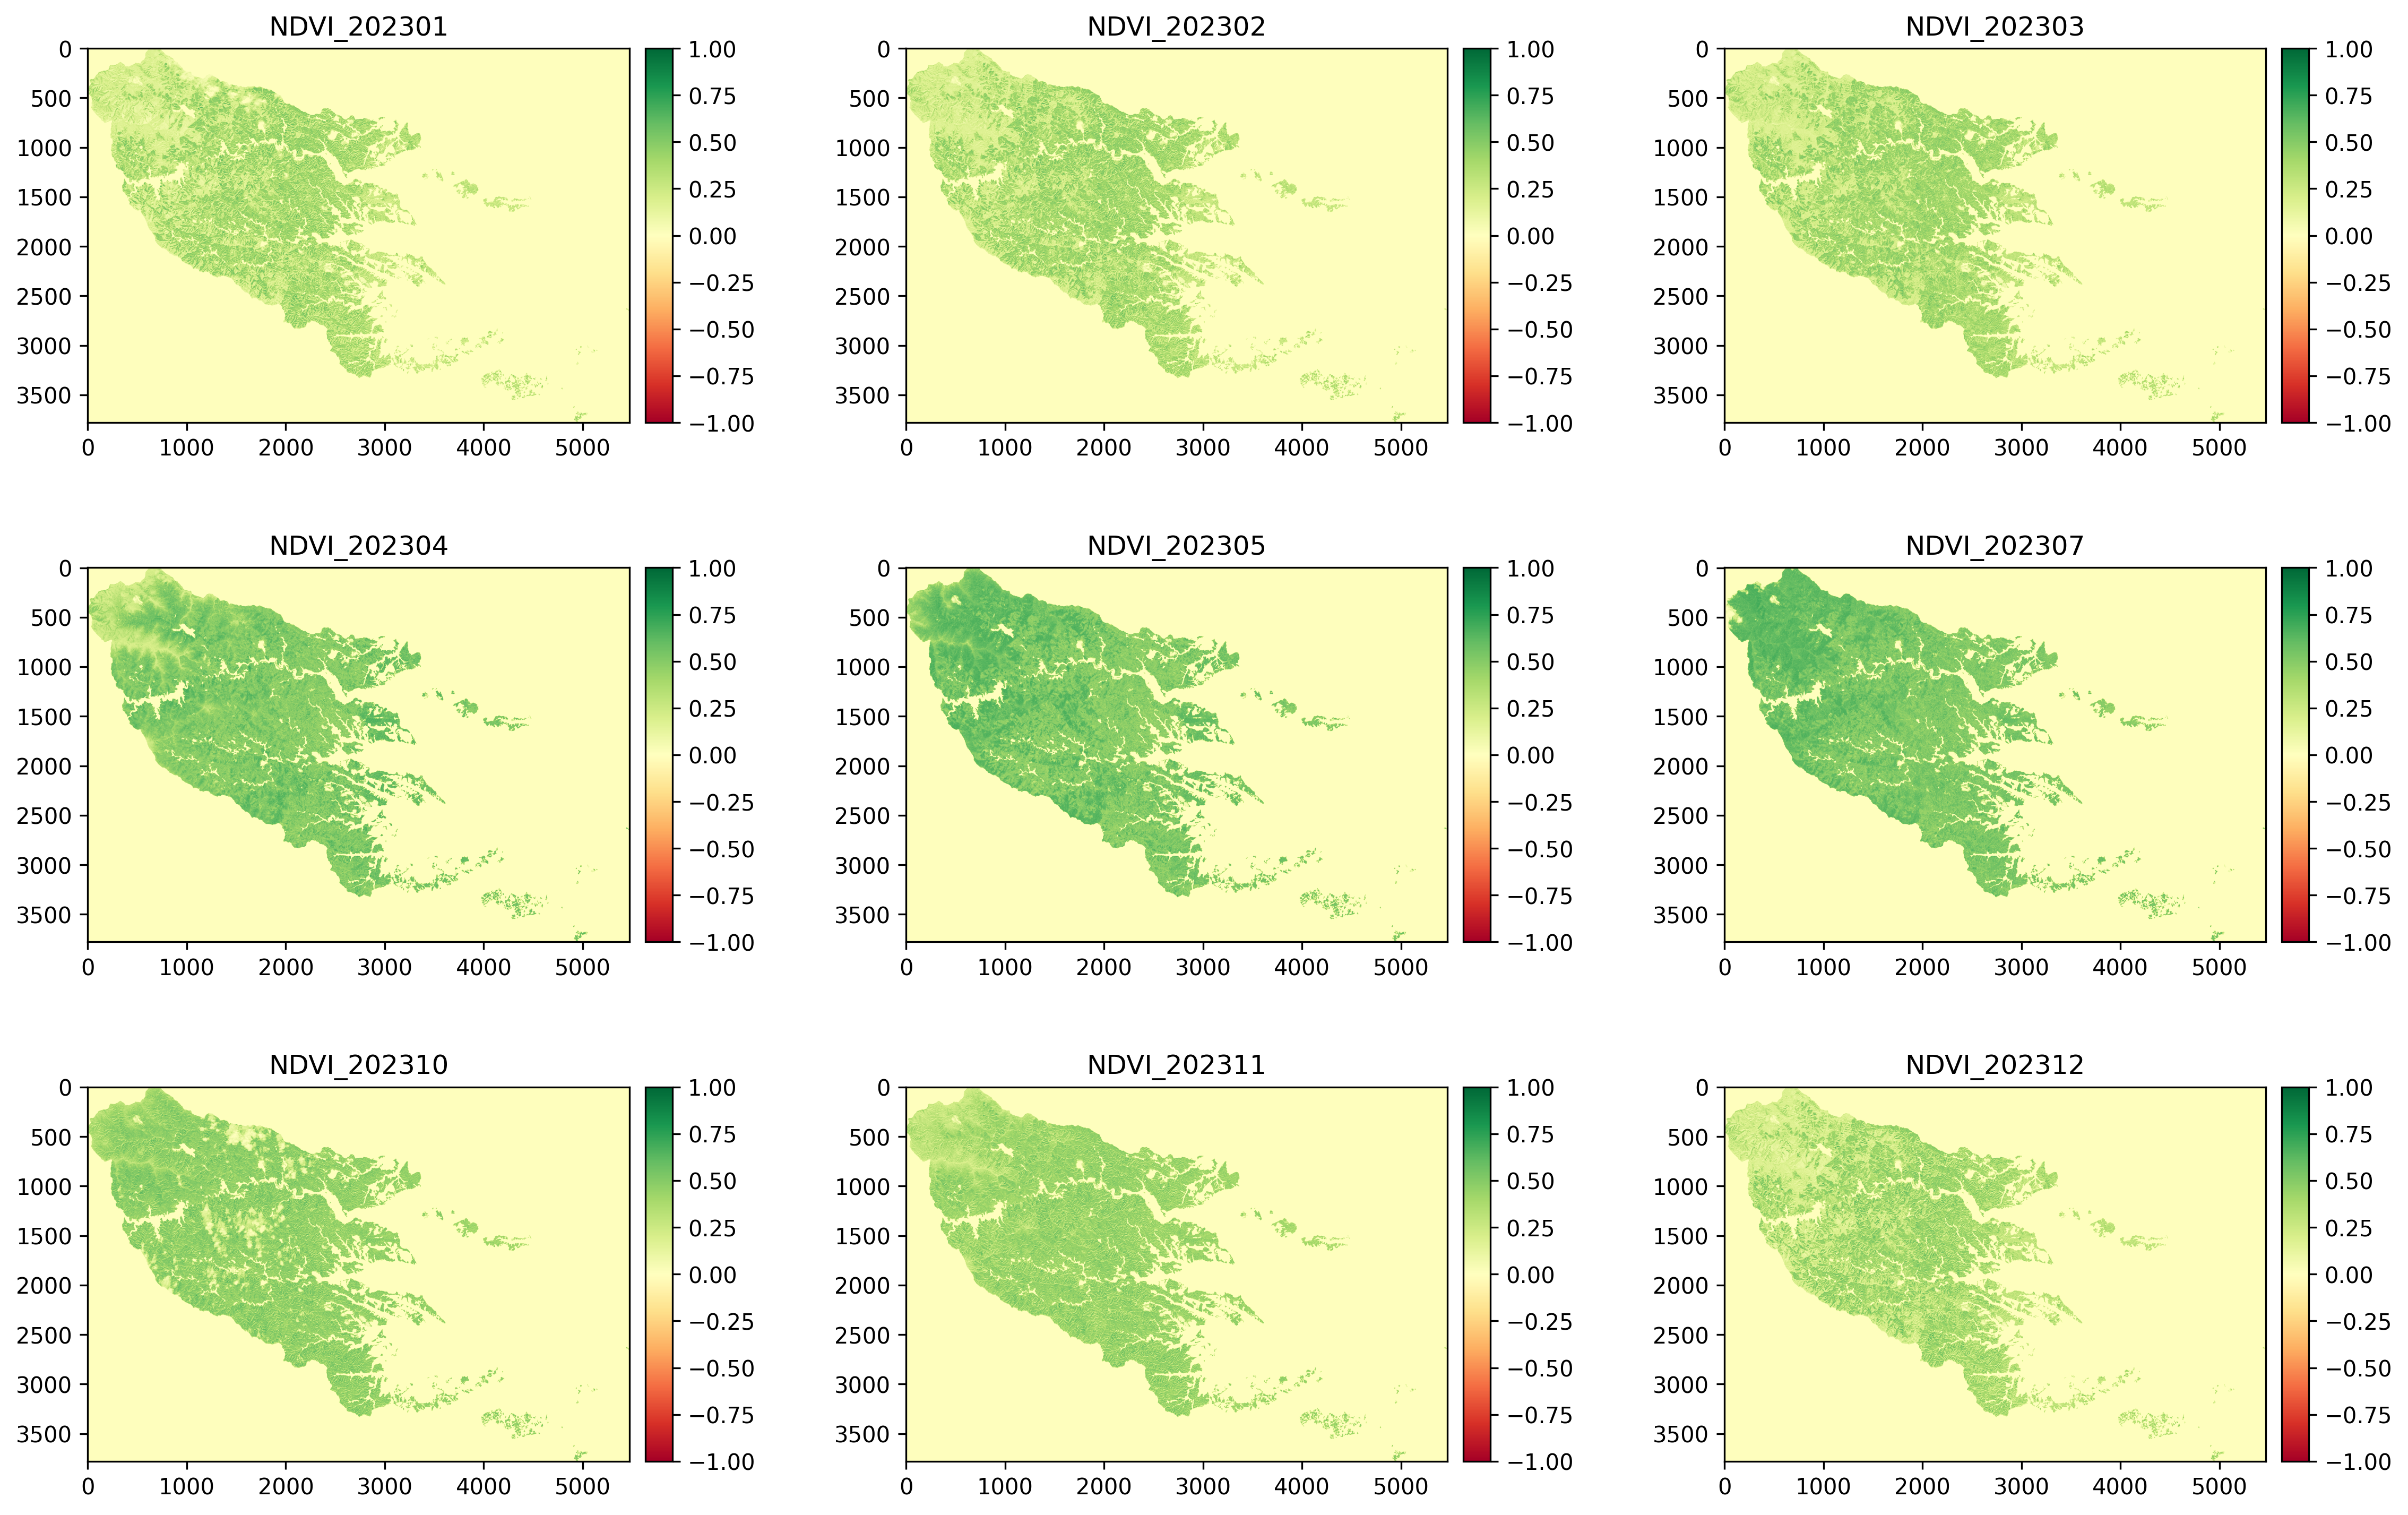
input[]fig, ((ax1, ax2, ax3), (ax4, ax5, ax6), (ax7, ax8, ax9))=plt.subplots(3, 3, figsize=(18, 12)) plt.subplots_adjust(wspace=0.4) NDVI_202301 = rio.open(NDVI_DIR + '/sentinel-2_20230102_ndvi.tif') (以降、各月分) .... NDVI_202301 = NDVI_202301.read(1) (以降、各月分) .... ndvi1 = ax1.imshow(NDVI_202301, cmap='RdYlGn') ax1.set_title('NDVI_202301') ndvi1.set_clim(vmin=-1, vmax=1) divider = make_axes_locatable(ax1) ax_cb = divider.new_horizontal(size='5%', pad=0.1) fig.add_axes(ax_cb) plt.colorbar(ndvi1, cax=ax_cb); (以降、各月分) .... -
月ごとのNDVIを算出
作成したNDVI画像を用いて森林地域の変化を推定し、可視化する。
今回はポリゴンによって抜き出した範囲を森林地域として、範囲内のNDVI変化を見ることで森林の状態変化を推定する。まずは森林地域のNDVI値を集計して平均値、最大値、最小値を算出し、計算した結果を用いて、各時期のNDVI平均値を正規化する。
9時期の中で、NDVIの値が最も高いと考えられる7月のNDVI平均値を全体の最大値とし、最も低いと考えられる2月のNDVI平均値を全体の最小値とする。input[]# NDVI値の集計 NDVI_list = os.listdir(NDVI_mask_DIR) NDVI_files = [] ind = [] col = [] NDVI_max=[] NDVI_min=[] value_ave=[] for seane in sorted(NDVI_list): NDVI_files.append(seane) for seane in sorted(NDVI_files): print("Start " +'<'+ seane +'>') NDVI_image = rio.open(NDVI_mask_DIR +"/"+ seane) NDVI_image_2 = NDVI_image.read() ind.append('NDVI_forest' + '_' + str(seane[11:19])) col.append('NDVI_' + str(seane[15:22])) NDVI_max.append(np.max(NDVI_image_2)) NDVI_min.append(np.min(NDVI_image_2)) NDVI_value = NDVI_image_2[np.nonzero(NDVI_image_2)].mean() value_ave.append(NDVI_value) # NDVI平均値の正規化 NDVI_normalized = [] for va in value_ave: nor = ((va - NDVI_min[1]) / (NDVI_max[5] - NDVI_min[1])) NDVI_normalized.append(nor) -
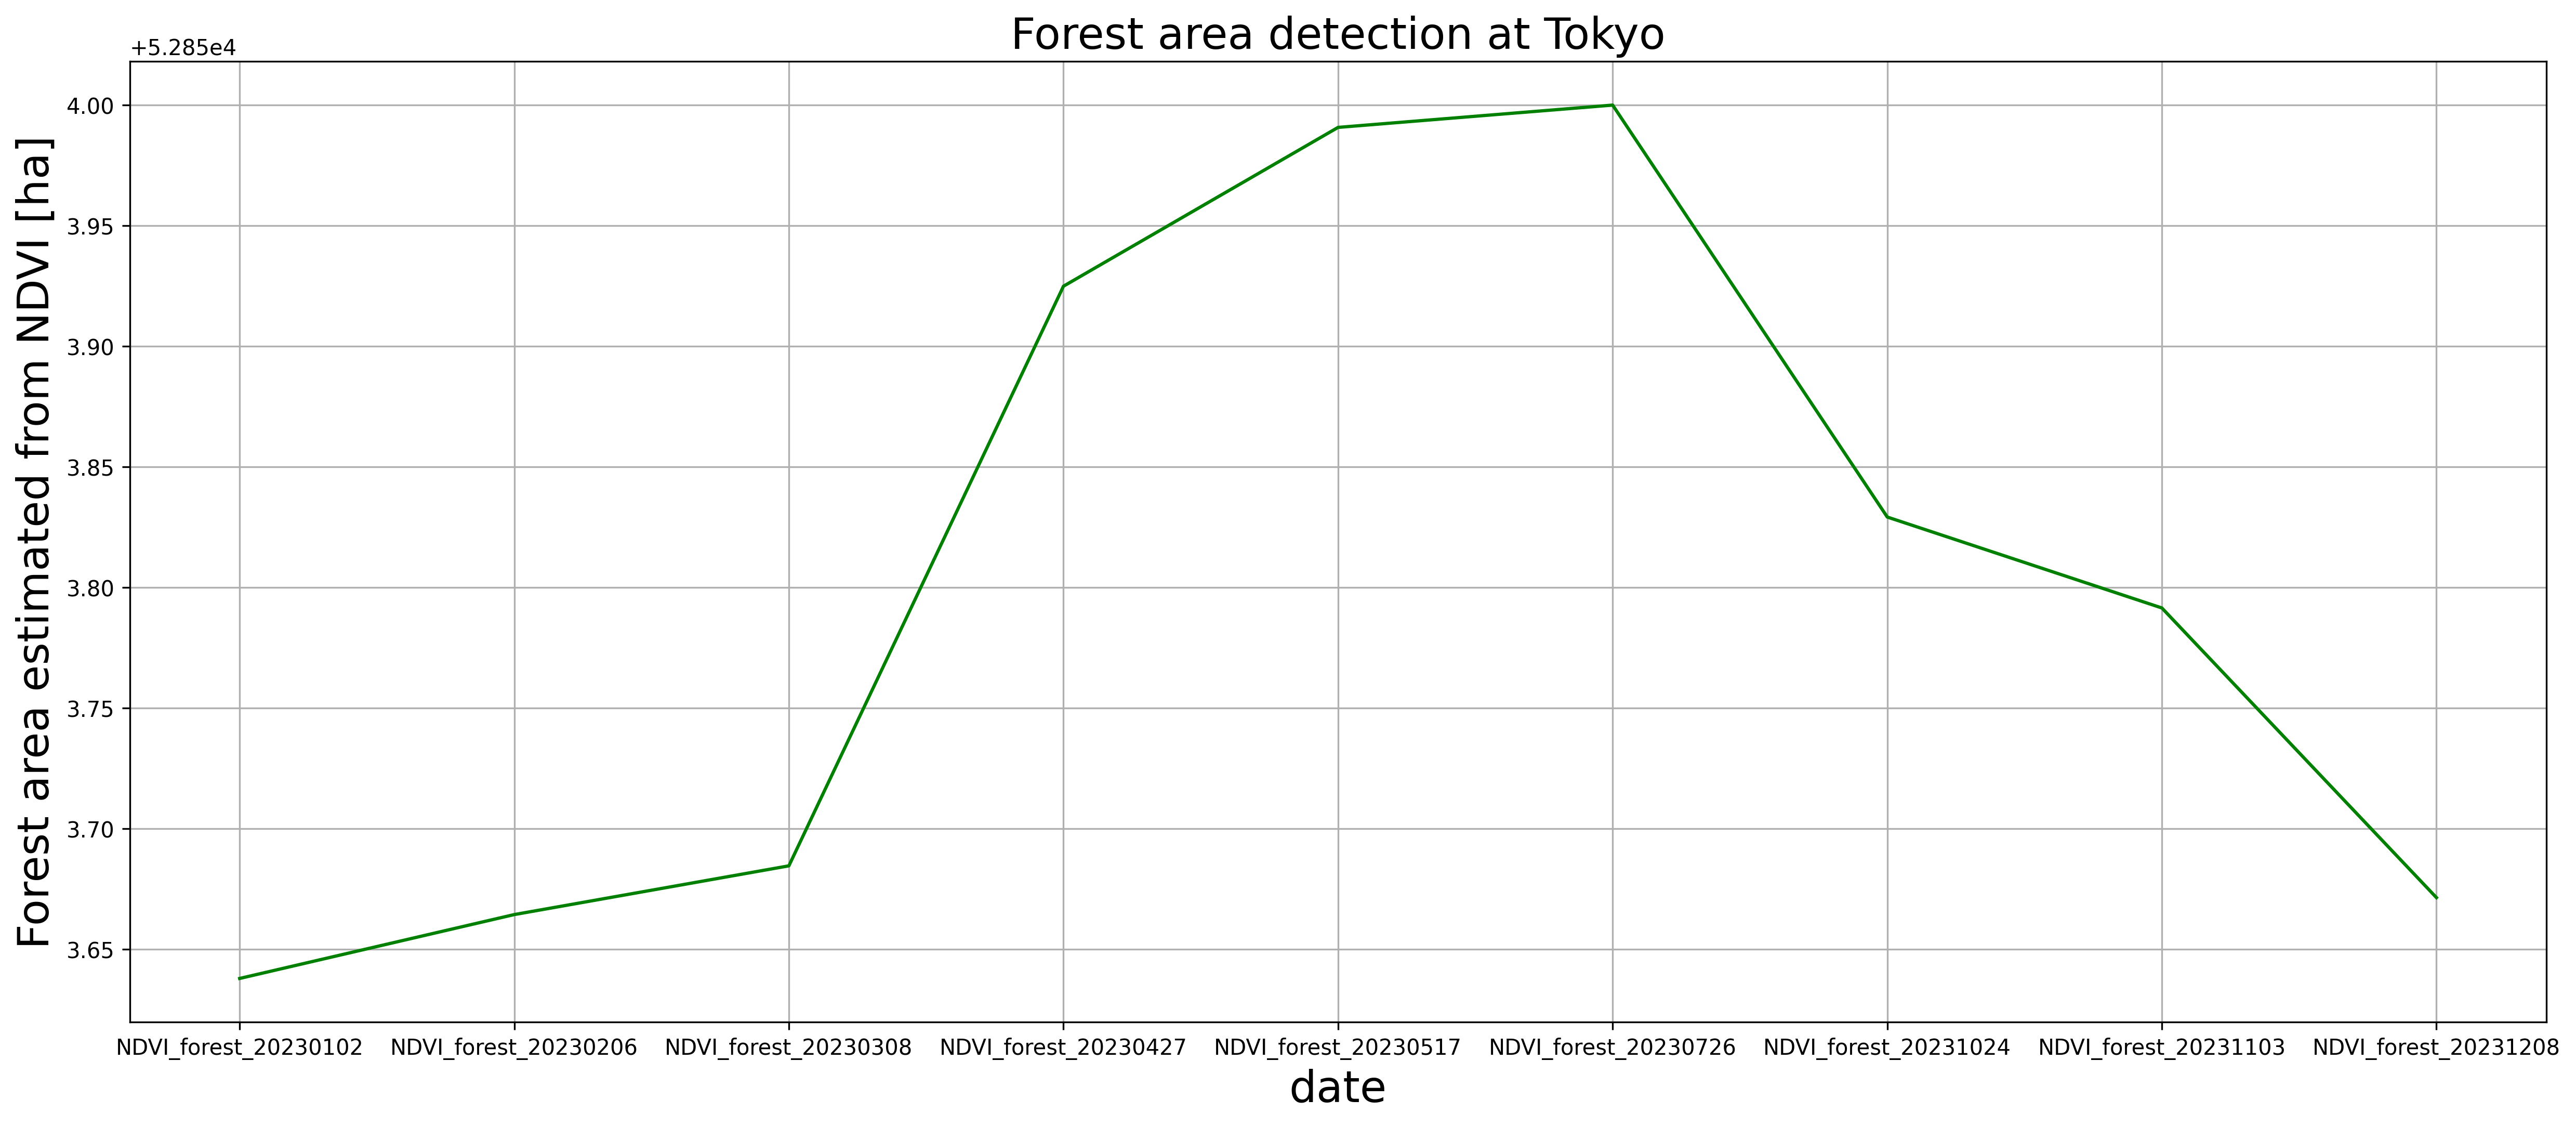
正規化した値の中で、植生が最も活性化する夏季(今回は7月)の正規化NDVI平均値を基準に東京都における森林面積に対し、各季節と夏季の比率を積算することで、季節変化におけるNDVI推移を算出する。
ここで東京都における森林面積は森林域をマスクする際に使用した国土数値情報および東京都産業労働局のデータを参照し52,853haとする。(2022年4月時点)
input[]forest_area = 52853 forest = [] for seasonal_data in NDVI_normalized: est_fore = forest_area + (seasonal_data/NDVI_normalized[5]) forest.append(est_fore)
結果
12ヶ月分の結果ではなく、また雲量が取得時期によって差があるため正確な解析結果とは言えませんが、 植生のピークとなる夏季(7月)にNDVIもピークを迎えている ため算出そのものは概ね大丈夫そうです。
最後に
衛星画像データの取得は会員登録や、もちろん衛星画像の知識(どの衛星だとどんなデータが取得できるか等...)が必要となりますが、解析の環境はクラウド上でもお手軽に構築できます。
今回はNDVIを解析しましたが他にも合成開口レーダーによって取得される SAR画像 など多様なデータがあるのが衛星画像の魅力だと思います。
衛星画像データの取得やより精度の高い解析方法など、説明上省略してしまっているものが多めですが参考にしていただけると幸いです。
参考資料
-
WEBページ
-
初心者向けTellus学習コース
応用編:地理空間情報解析について Lesson11 林業での衛星データの使い方 - 解析実例とともに学ぶNDVI(正規化植生指標)の基本と扱う上での注意点【コード付き】 | 宙畑
- [衛星データだけでグランドスラムのテニスコート素材を当てる! | 宙畑] (https://sorabatake.jp/889/)
- 東京都産業労働局 東京の森林
-
初心者向けTellus学習コース
-
書籍
