前回の投稿に引き続きdataquestを進めていこうと思います。今回はpandasを触りながら備忘録としてメモを。
今回取り扱うデータ
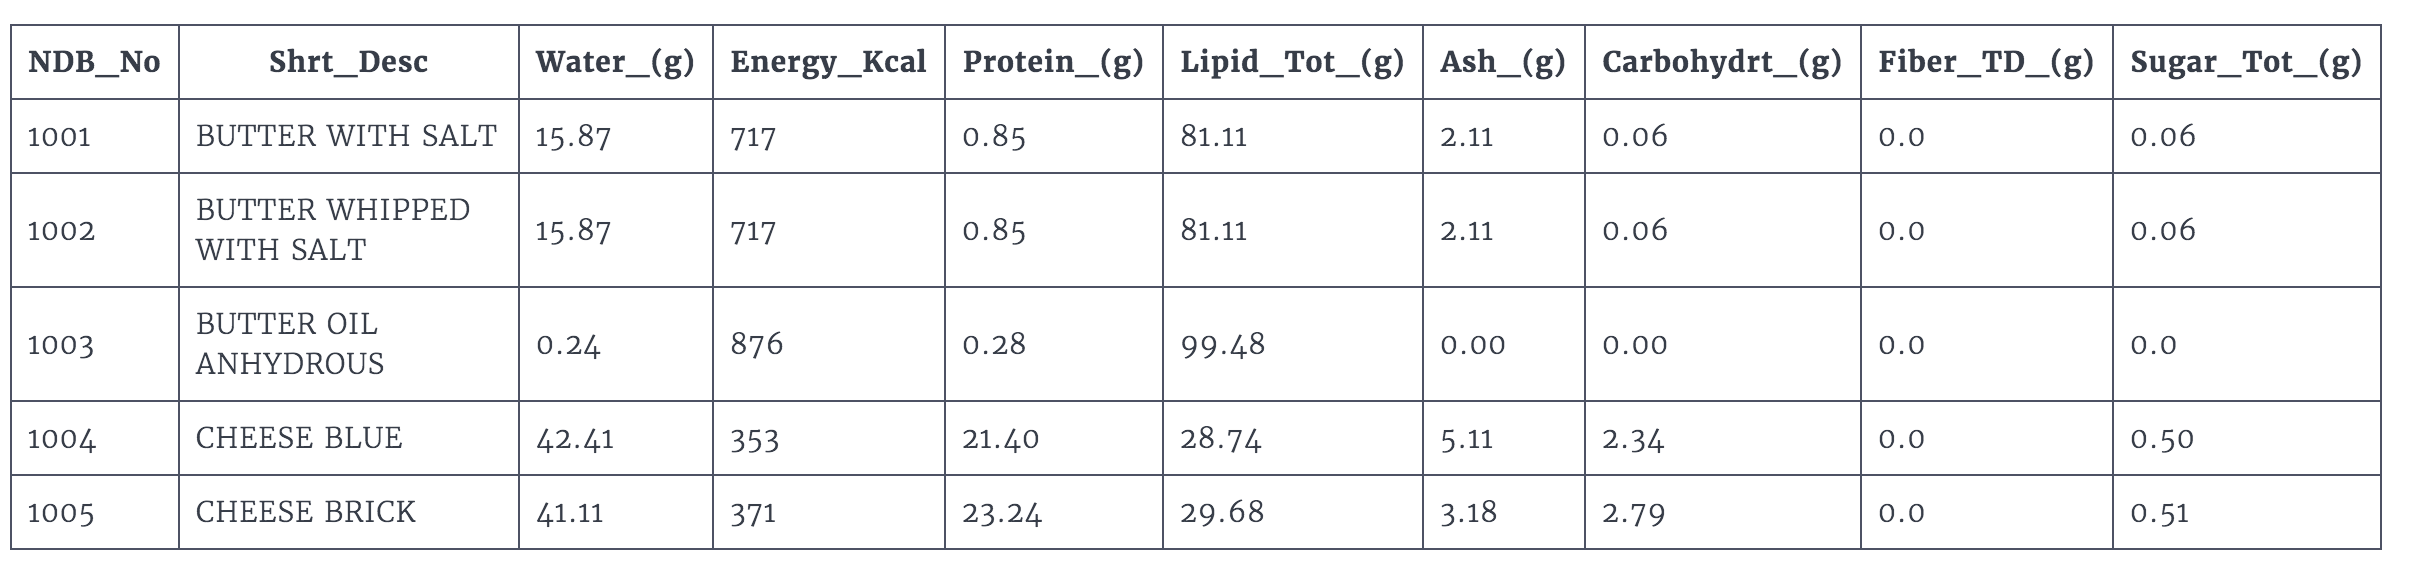
USDAより取ってきた農業収穫高に関するデータを扱います。詳しくリンク先から取得してもらうとしてぱっと見こんな感じのテーブルになっているかと思います。
-
NDB_No- unique id of the food. -
Shrt_Desc- name of the food. -
Water_(g)- water content in grams. -
Energ_Kcal- energy measured in kilo-calories. -
Protein_(g)- protein measured in grams. -
Cholestrl_(mg)- cholesterol in milligrams.
pandasのきほん
pandasとは
データサイエンティストがデータ解析の際に使う便利なツールがたくさん詰まったライブラリ。Tabular Data(列と行で表せるデータのこと。tableからきてると思われ)処理にはもってこいらしい。Tabular Dataを扱う上でpandasは__dataframe__というデータ構造を用いる。Numpyの2D配列に近いものはあるがpandasの方がライブラリが充実していてできることもたくさんあるとか。
Numpyとの違い
表記されている主な相違点は:
- pandasは一つの配列に異なる種類のデータをしまうことができる。よりpythonに近い扱い方ができそう。
- Numpyの
nanに変わってNaNを使う。
詳しい相違点はググってみることを推奨しておきます。
使い方
ファイルの読み込み
import pandas

food_info = pandas.read_csv("food_info.csv")
データの覗き見
データ/ファイルの中身を確認をしたい時などテーブルの最初の数行だけをチラ見したい時はdata.head()を使う。かっこの中に表示させたい件数を入れることもできるし何も入れなければデフォルトで頭から5つ表示される。列の情報を全て引き出したい場合はdata.columnsを使う。また配列の次元数を取得した時は.shapeで。info.head(20)だと頭20個(19個ではない)が表示される。
# Returns the tuple (8618,36) and assigns to `dimensions`.
dimensions = food_info.shape
# The number of rows, 8618.
num_rows = dimensions[0]
# The number of columns, 36.
num_cols = dimensions[1]
用語解説
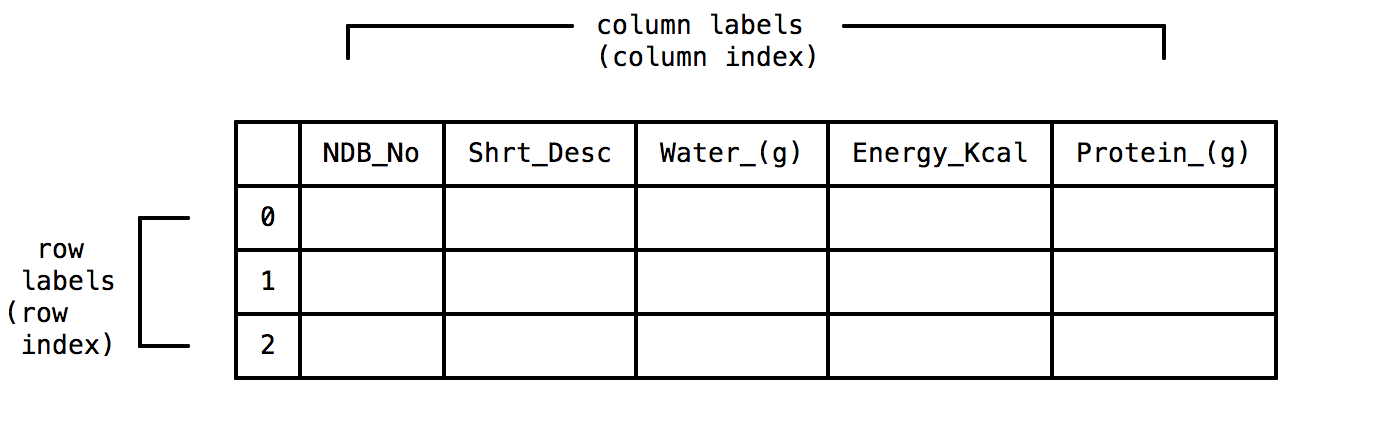
Labels
インデックスとも呼ばれる。
When you read in a file into a dataframe, pandas uses the values in the first row (also known as the header) for the column labels and the row number for the row labels. Collectively, the labels are referred to as the index. dataframes contain both a row index and a column index.
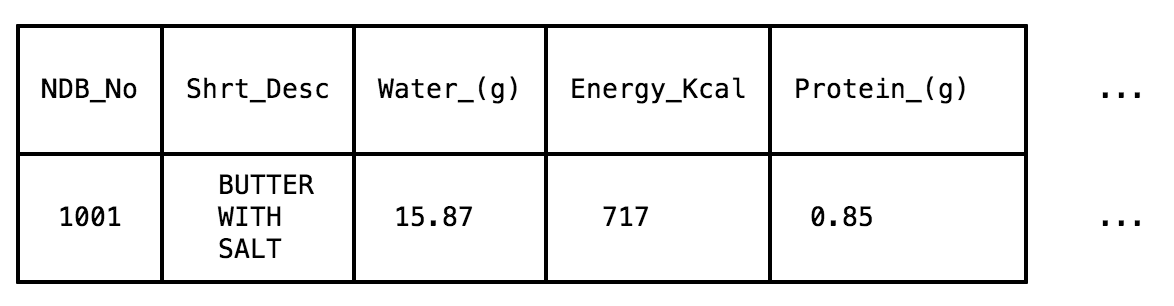
Series
A Series is a labelled collection of values similar to the NumPy vector. The main advantage of Series objects is the ability to utilize non-integer labels. NumPy arrays can only utilize integer labels for indexing.
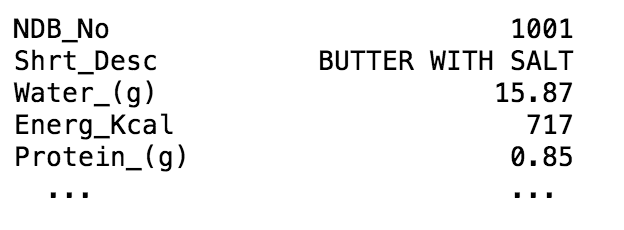
Pandasはこのseriesオブジェクトを用いているためデータの出力の形がNumpyと比べて多少異なる。例えばテーブル一行目のデータを取得したい場合:
以下のように出力される。
Seriesとdataframeの違い
両者の違いが曖昧だったので調べてみたところ:
pandas.DataFrame(data=None, index=None, columns=None, dtype=None, copy=False)
DataFrame is Two-dimensional size-mutable, potentially heterogeneous tabular data structure with labeled axes (rows and columns). Arithmetic operations align on both row and column labels. Can be thought of as a dict-like container for Series objects. The primary pandas data structure...
So the Series is the data structure for a single column of a DataFrame, not only conceptually, but literally i.e. the data in a DataFrame is actually stored in memory as a collection of Series.
Analogously: We need both lists and matrices, because matrices are built with lists. Single row matricies, while equivalent to lists in functionality still cannot exists without the list(s) they're composed of.
They both have extremely similar APIs, but you'll find that DataFrame methods always cater to the possibility that you have more than one column. And of course, you can always add another Series (or equivalent object) to a DataFrame, while adding a Series to another Series involves creating a DataFrame.
import pandas as pd
ds = pd.Series(data, index=index)
# DataFrame is a 2-dimensional labeled data structure with columns of potentially different types.

import pandas as pd
df = pd.DataFrame(data, index=index)

,country,popuplation,area,capital
BR,Brazil,10210,12015,Brasile
RU,Russia,1025,457,Moscow
IN,India,10458,457787,New Delhi
To read above data as series and data frame:

import pandas as pd
file_data = pd.read_csv("file_path", index_col=0)
d = pd.Series(brics.country, index=['BR','RU','IN','US'])
# output:

>>> d
BR           Brazil
RU           Russia
IN            India
US    United States

df = pd.DataFrame(brics.area, index=['BR','RU','IN','US'])
# output:

>>> df
      area
BR   12015
RU     457
IN  457787
US  457326
データの取得
Numpyでは通常通りnumpy.array()[i]でアクセスするのに対しPandasでは以下の通り:
# Series object representing the row at index 0.
food_info.loc[0]

# Series object representing the seventh row.
food_info.loc[6]
hundredth_row = food_info.loc[99]
print(hundredth_row)

NDB_No                                  1111
Shrt_Desc          MILK SHAKES THICK VANILLA
Water_(g)                              74.45
Energ_Kcal                               112
Protein_(g)                             3.86
Lipid_Tot_(g)                           3.03
Ash_(g)                                 0.91
Carbohydrt_(g)                         17.75
Fiber_TD_(g)                               0
Sugar_Tot_(g)                          17.75
Calcium_(mg)                             146
Iron_(mg)                                0.1
Magnesium_(mg)                            12
Phosphorus_(mg)                          115
Potassium_(mg)                           183
Sodium_(mg)                               95
Zinc_(mg)                               0.39
Copper_(mg)                            0.051
Manganese_(mg)                         0.014
Selenium_(mcg)                           2.3
Vit_C_(mg)                                 0
Thiamin_(mg)                            0.03
Riboflavin_(mg)                        0.195
Niacin_(mg)                            0.146
Vit_B6_(mg)                            0.042
Vit_B12_(mcg)                           0.52
Vit_A_IU                                  91
Vit_A_RAE                                 25
Vit_E_(mg)                              0.05
Vit_D_mcg                                1.2
Vit_D_IU                                  48
Vit_K_(mcg)                              0.2
FA_Sat_(g)                             1.886
FA_Mono_(g)                            0.875
FA_Poly_(g)                            0.113
Cholestrl_(mg)                            12
Name: 99, dtype: object
データのアクセスの仕方はpythonとのスライシング表記が若干異なる。
# DataFrame containing the rows at index 3, 4, 5, and 6 returned.
food_info.loc[3:6]
# DataFrame containing the rows at index 2, 5, and 10 returned. Either of the following work.
# Method 1
two_five_ten = [2,5,10]
food_info.loc[two_five_ten]
# Method 2
food_info.loc[[2,5,10]]
例題1
Select the last 5 rows of food_info and assign to the variable last_rows.
答え
num_rows = food_info.shape[0]
last_five = num_rows
last_rows = food_info.loc[last_five-5:num_rows]
tailを使うのが一般的らしいが。。。
特定の列にアクセスしたい
直接その列の名前を入れてしまえばいい。
# Series object representing the "NDB_No" column.
ndb_col = food_info["NDB_No"]

# You can instead access a column by passing in a string variable.
col_name = "NDB_No"
ndb_col = food_info[col_name]
複数の列にアクセスしたい
When selecting multiple columns, the order of the columns in the returned dataframe matches the order of the column names in the list of strings that you passed in. This allows you to easily explore specific columns that may not be positioned next to each other in the dataframe.
columns = ["Zinc_(mg)", "Copper_(mg)"]
zinc_copper = food_info[columns]

# Skipping the assignment.
# [[]]の形になっていることに注意!
zinc_copper = food_info[["Zinc_(mg)", "Copper_(mg)"]]
データの種類
上に書いてあるdtype: objectという表記について気になった人もいるかもしれない。Seriesオブジェクトのデータの種類を指している。
The object dtype is equivalent to the string type in Python. Pandas borrows from the NumPy type system and contains the following dtypes:
-
object- for representing string values. -
int- for representing integer values. -
float- for representing float values. -
datetime- for representing time values. -
bool- for representing Boolean values.
ちなみにinfo.dtypesで指定した列のデータタイプを出力してくれる。
例題2
- Select and display only the columns that use grams for measurement (that end with "(g)"). To accomplish this:
- Use the columns attribute to return the column names in food_info and convert to a list by calling the method tolist()
- Create a new list, gram_columns, containing only the column names that end in "(g)". The string method endswith() returns True if the string object calling the method ends with the string passed into the parentheses.
- Pass gram_columns into bracket notation to select just those columns and assign the resulting dataframe to gram_df
- Then use the dataframe method head() to display the first 3 rows of gram_df.
答え
column_names = food_info.columns
column_names_lst = column_names.tolist()
gram_columns = []
for column_name in column_names_lst:
    if column_name.endswith("(g)"):
        gram_columns.append(column_name)

gram_df = food_info[gram_columns]
gram_df.head(3)