Background
We often want to check for EC2 instance pricing data. Since the volume of instance types are vast and there are also many additional dimensions like Region, Operation, UsageType, etc to define the pricing factors, it's been a time-consuming and terrible experience to find the exact pricing we want to know quickly.
Where to find pricing data
There are many places to find pricing data:
- AWS EC2 Pricing Page this is the official page on showing prices, but it's kinda slow and hard to find the information you need unless you clicked a fleet of buttons and select boxes. And there is still no way you can search.
- AWS Cost Calculator grab instance type and along with other costs to define the budget.
- ec2instances.info A third-party site that you can query and search for pricing data on various dimensions.
- AWS Price List API This is what I want to share in this post.
AWS Price List API
This API contains all services pricing data which Amazon offer.
To get the offer code and URLs for all supported services by accessing the Offer Index:
https://pricing.us-east-1.amazonaws.com/offers/v1.0/aws/index.json
It returns like:
{
  "formatVersion" : "v1.0",
  "disclaimer" : "This pricing list is for informational purposes only. All prices are subject to the additional terms included in the pricing pages on http://aws.amazon.com. All Free Tier prices are also subject to the terms included at https://aws.amazon.com/free/",
  "publicationDate" : "2015-11-19T02:10:02Z",
 "offers" : {
    "AmazonS3" : {
      "offerCode" : "AmazonS3",
      "currentVersionUrl" : "/offers/v1.0/aws/AmazonS3/current/index.json"
    },
    "AmazonRedshift" : {
      "offerCode" : "AmazonRedshift",
      "currentVersionUrl" : "/offers/v1.0/aws/AmazonRedshift/current/index.json"
    },
    "AmazonEC2" : {
      "offerCode" : "AmazonEC2",
      "currentVersionUrl" : "/offers/v1.0/aws/AmazonEC2/current/index.json"
    },
    "AmazonCloudWatch" : {
      "offerCode" : "AmazonCloudWatch",
      "currentVersionUrl" : "/offers/v1.0/aws/AmazonCloudWatch/current/index.json"
    }
  }
}
To take EC2 price index as an example, it contains a huge list of around 400,000 items and a single API call won't return that all information within a body. Luckily, AWS provides all of the data in a CSV format (file size around 304MB), it can be download from this link (don't open it if you are running on a low spec laptop):
A screenshot of the CSV (opened on my Mac):
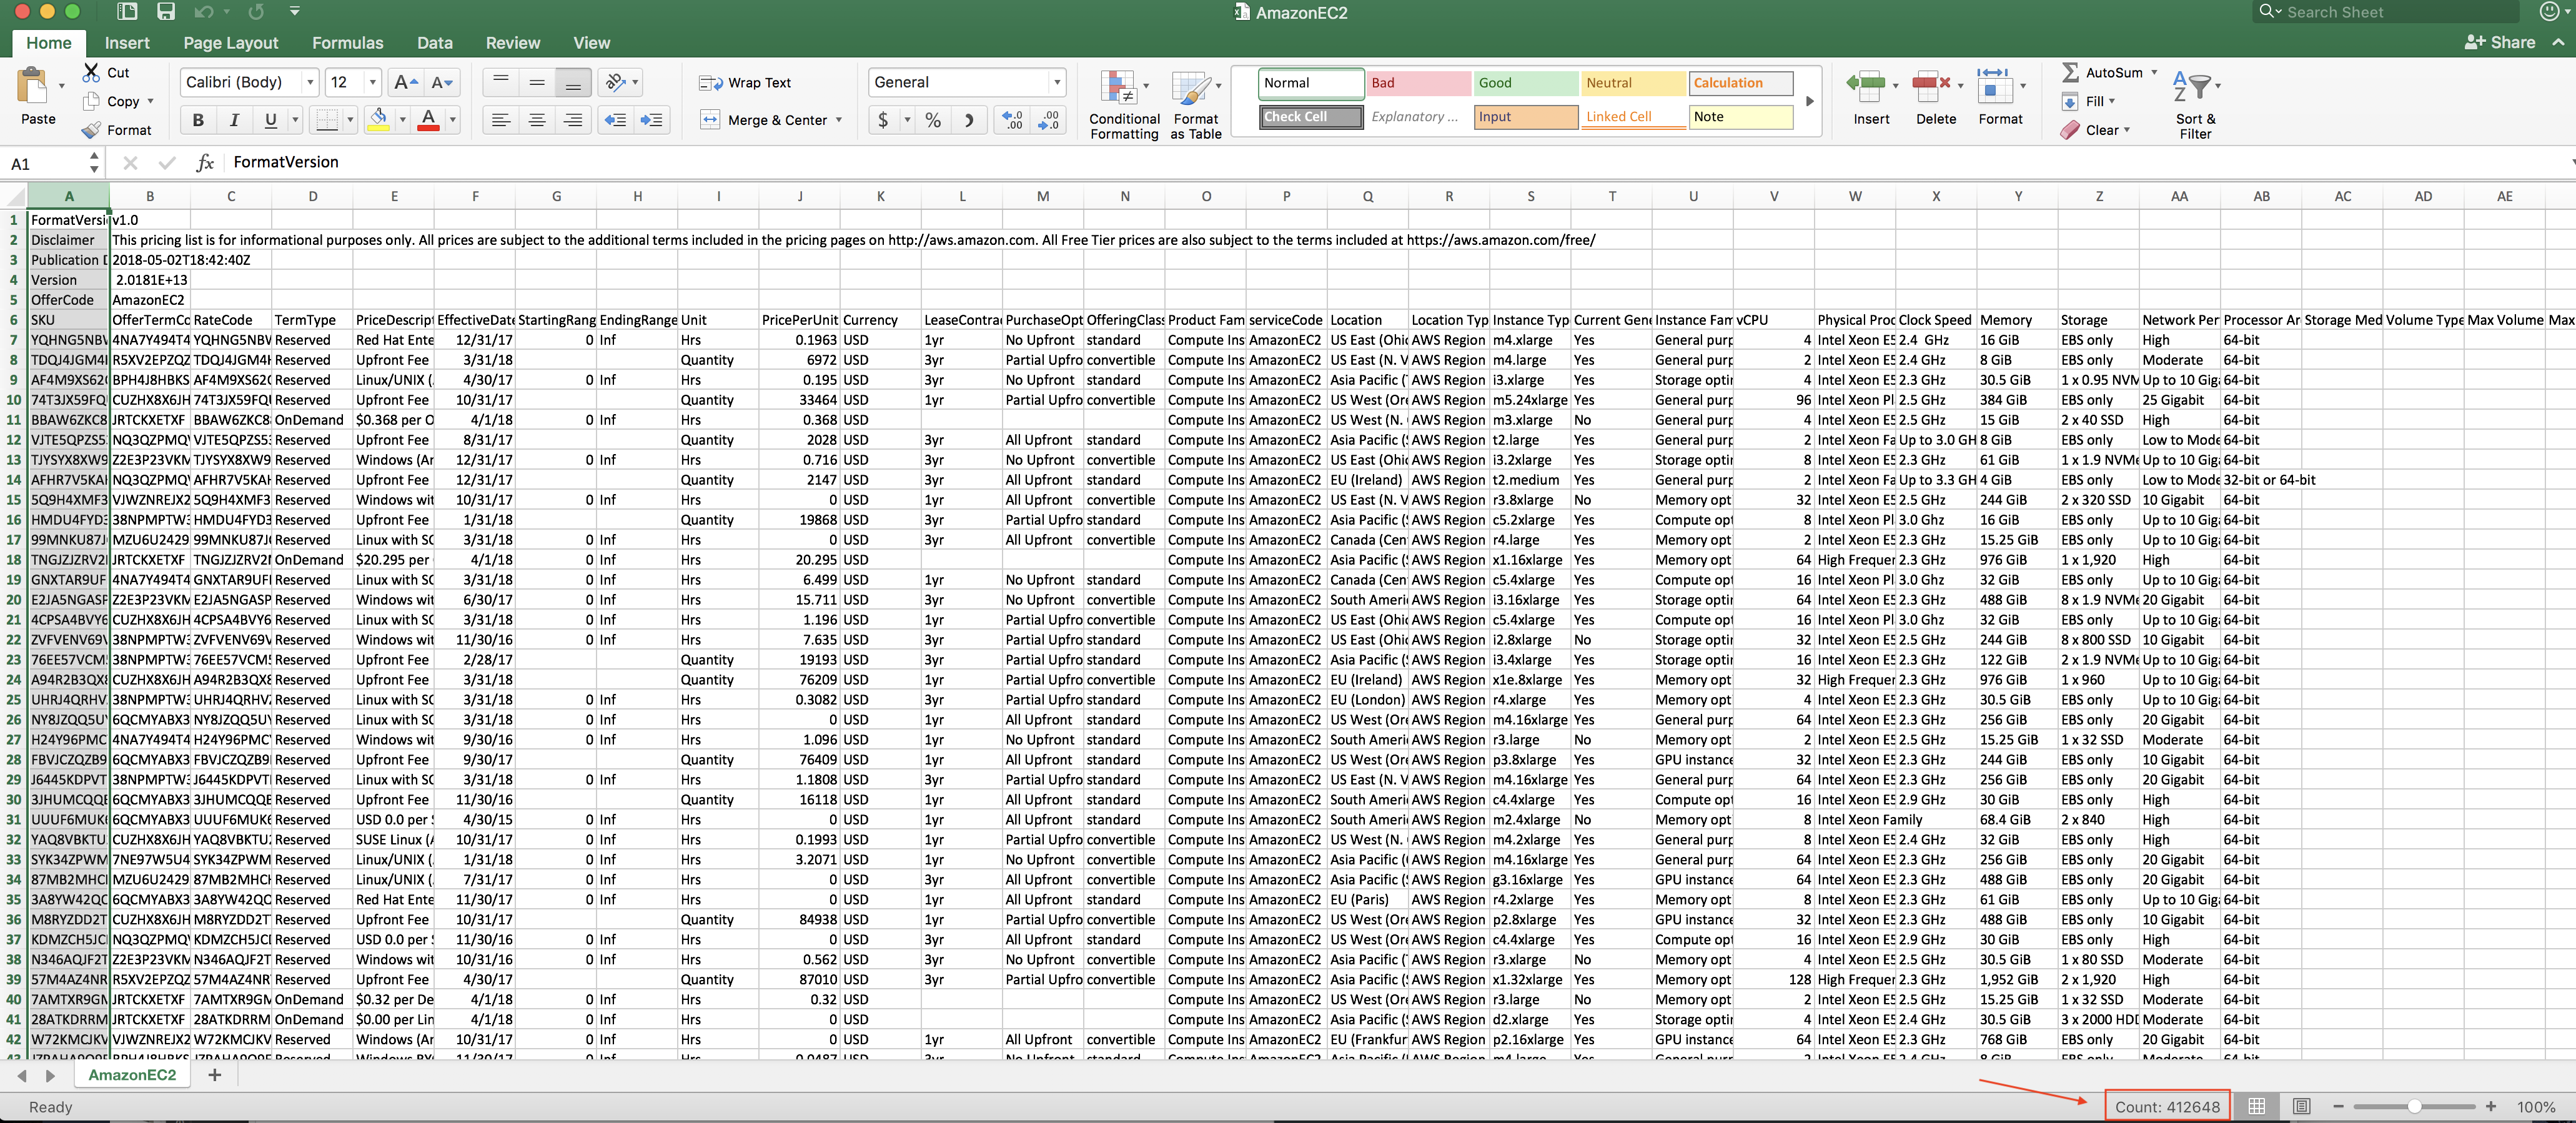
As you can see, the count of items is more than 400,000! And why are there so many pricing rates data?
While I filtered the CSV by columns like
-
InstanceType, -
Operation, -
Location, -
TermType, -
UsageType, -
Tenancy, ...
then I got few lines left which contain the pricing data in a column called PricePerUnit, and the number on this cell is presenting the pricing rate for that specific instance in a specific region with specific dimensions. For example:
After filtering
RegionandInstanceType, an m3.medium instance in Tokyo region contains 204 pricing rate items . And the 204 pricing rate items of m3.medium instance are with different rate because there are dimensions like Operation System (Windows, Linux/Unix, SUSE, Enterprise Linux, etc are with different prices), Reservation Terms (either 3-year or 1-year with upfront option like No-upfront, Partial-upfront and Full-upfront, under Convertible or Standard types), Pre-installed Softwares, etc to factor the pricing.
Dump CSV into dynamoDb
There are many big data solutions to visualize a huge CSV. Stuff like BigQuery, QuickSight, etc. But I decided to dump that into DynamoDb for the sake of fast querying. So after filtered some unused values, I got 309,365 items of EC2 offering data available globally:

Click on an Item, the pricing data of this specific m5.12xlarge rate info looks like this:
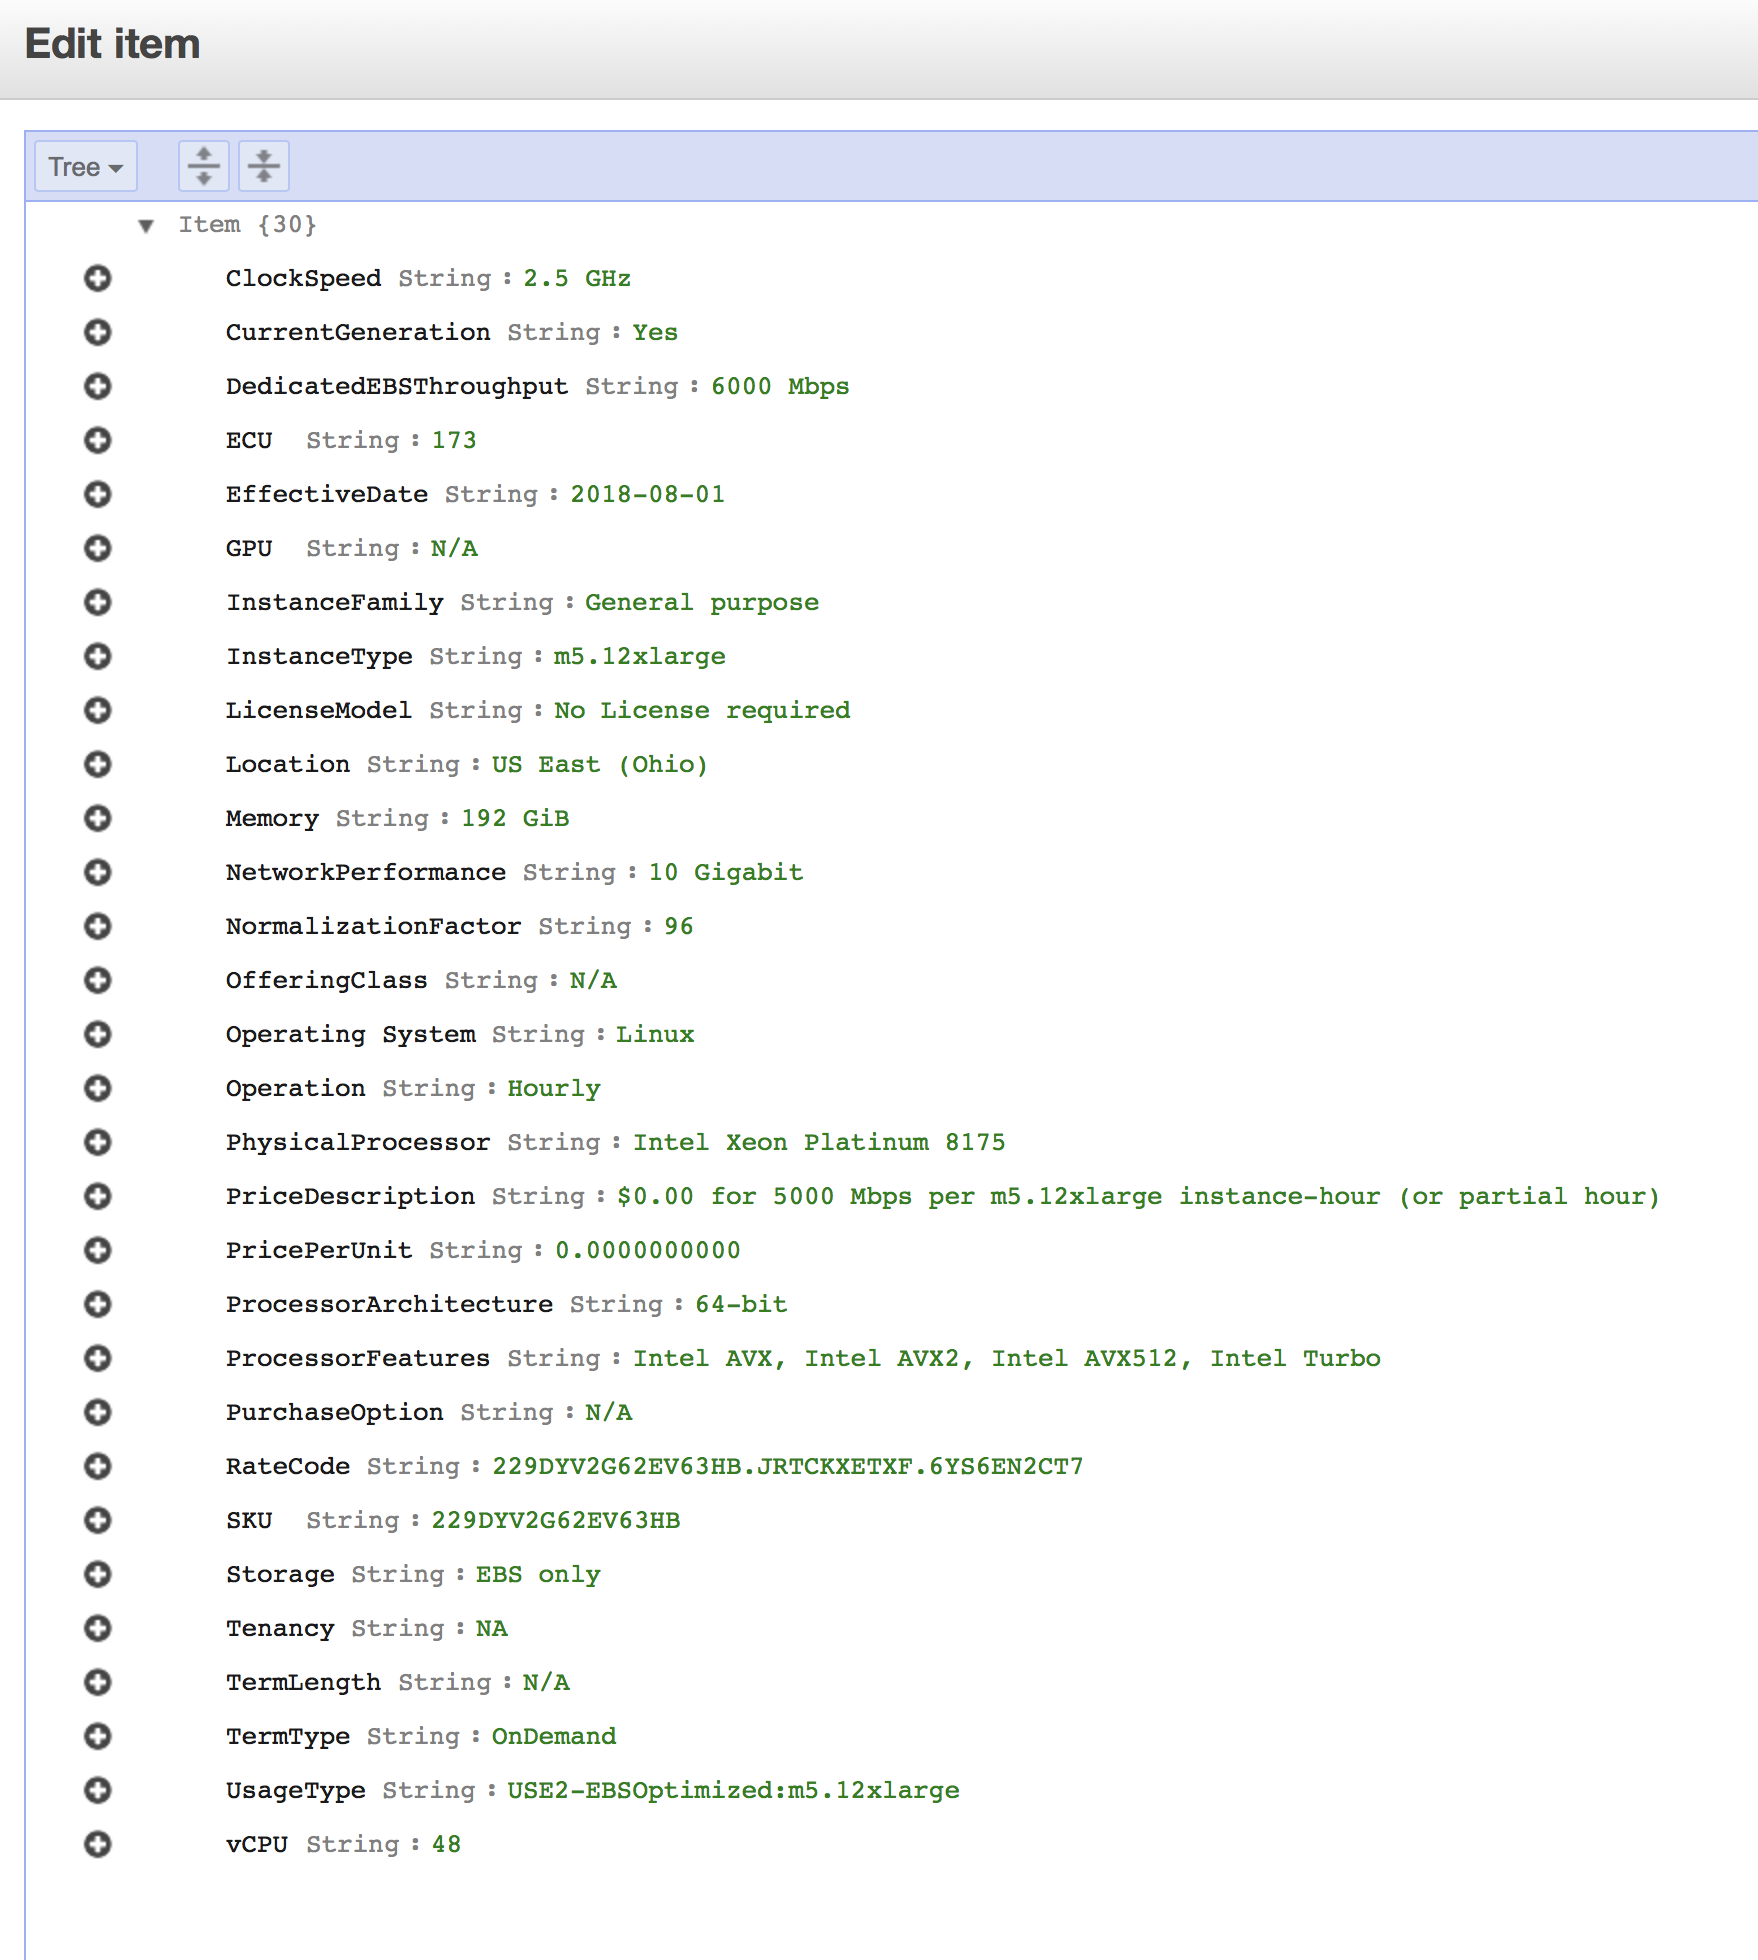
Now, I can easily query the pricing info against the instance I wish to search:

Interesting Dimensions
The pricing data are so vast because of dimensions. And when you are about to calculate the true unblended cost by yourself you gotta understand all of these dimensions. I picked some of the most important ones:
-
TermType: OnDemand, or Reserved -
PriceDescription: The description of the pricing item -
ProductFamily: Compute Instance, Data Transfer or EBS Storage, etc -
serviceCode: AmazonEC2 -
Location: Region, eg: Asia Pacific (Tokyo) -
InstanceType: The type of instance, eg: c1.large -
UsageType: This is the dimension used by AWS officially to calculate your monthly invoices. By matching this dimension with the column found in your monthly CUR csv, aws applies the unit price and generate the total usage cost. -
Tenancy: Shared, Dedicated, or Host -
Operation: This defines what OS is the instance running, eg:-
RunInstancesAmazon EC2 running Linux/UNIX -
RunInstances:000gAmazon EC2 running SUSE Linux -
RunInstances:0010Amazon EC2 running Red Hat Enterprise Linux -
RunInstances:0002Amazon EC2 running Windows -
RunInstances:0006Amazon EC2 running Windows with SQL Server Standard -
RunInstances:0102Amazon EC2 running Windows with SQL Server Enterprise -
RunInstances:0202Amazon EC2 running Windows with SQL Server Web -
RunInstances:0800Amazon EC2 running Windows (Bring your own license) -
RunInstances:SV006Amazon EC2 running Linux/UNIX Spot Instance-hour in US East (Virginia) in VPC Zone #6 ... - ...
-
About CUR & Self-calculation
CUR (Cost and Usage Report) is a CSV file which aws provides to our S3 bucket (via payer account) on an hourly/daily basis. This CSV file contains all of the services usage data in detail.
We can hence calculate the cost base on that CUR csv file and get detailed insight of what our AWS usage is allocated to. More detail on understanding CUR and consolidated billing on this AWS documentation page.
Self-calculation can be tough and human intensive. Especially when the RI blending happens across multiple aws accounts we will have to re-calculate the correct true usage.
Luckily there are SaaS vendors who are providing such insight services:
I'm working at Mobingi team, and we've been helping many aws customers to calculate their billings every month in a total of multi-million dollars. The getting started guide on Mobingi Wave is very simple.
I'll share more on the CUR csv format in another article.