RでSNS分析
Twitterの分析をする必要が出てきたため
備忘録のため記述。
データ取得から可視化まで
filename.rb
# ライブラリー
library("twitteR")
library("lubridate")
library("ggplot2")
library("ggmap")
library("stringr")
library("tm")
library("RColorBrewer")
library("wordcloud")
# APIkey入力・認証
# 参考:https://www.itti.jp/web-direction/how-to-apply-for-twitter-api/
APIKey <- ""
APISecret <- ""
accessToken <- ""
accessSecret <- ""
options(httr_oauth_cache = TRUE)
setup_twitter_oauth(APIKey, APISecret, accessToken, accessSecret)
# ツイート取得
tw.Covid = searchTwitter("Covid-19", n=500)
# データフレーム化・変換
trendingTweets.df <- twListToDF(tw.Covid)
trendingTweets.df$text <- sapply(trendingTweets.df$text,
                                 function(x)iconv(x, to = "UTF-8"))
trendingTweets.df$created <- ymd_hms(trendingTweets.df$created)
# 時間ごとにプロット
ggplot(data = trendingTweets.df, aes(x = created))+
  geom_histogram(aes(fill = ..count..))+
  theme(legend.position = "none")+
  xlab("Time")+ ylab("Number of tweets") +
  scale_fill_gradient(low = "midnightblue", high ="aquamarine4")
# 国特定関数#
mapCountry <- function(x) {
  if(!is.na(str_match(tolower(x),"japan")) |!is.na(str_match(tolower(x),"fukushima")) ){
    "japan"
  }else if(!is.na(str_match(tolower(x),"new zealand")) |!is.na(str_match(tolower(x),"nz"))){
    "new zealand"
  }else if(!is.na(str_match(tolower(x),"india"))){
    "india"
  }else if(!is.na(str_match(tolower(x),"italy")) |!is.na(str_match(tolower(x),"italia"))){
    "italy"
  }else if(!is.na(str_match(tolower(x),"spain"))){
    "spain"
  }else if(!is.na(str_match(tolower(x),"mexico"))){
    "mexico"
  }else if(!is.na(str_match(tolower(x),"philippine"))){
    "philippines"
  }else if(!is.na(str_match(tolower(x),"china"))){
    "china"
  }else if(!is.na(str_match(tolower(x),"korea"))){
    "korea"
  }else if(!is.na(str_match(tolower(x),"indonesia"))){
    "indonesia"
  }else if(!is.na(str_match(tolower(x),"argentina"))){
    "argentina"
  }else if(!is.na(str_match(tolower(x),"unitedstates"))|!is.na(str_match(tolower(x),"united states"))){
    "US"
  }else {
    "rest_of_the_world"
  }
}


# トレンド特定
trendingTweets.df$covid_country <- sapply(trendingTweets.df$text,mapCountry)
# 登場国可視化
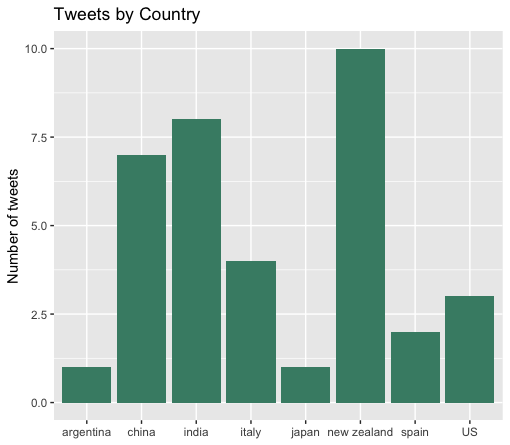
ggplot(subset(trendingTweets.df,covid_country != 'rest_of_the_world'), aes(covid_country)) +
  geom_bar(fill = "aquamarine4") +
  theme(legend.position="none", axis.title.x = element_blank()) +
  ylab("Number of tweets") +
  ggtitle("Tweets by Country")
アプトプット

Twitterに位置情報が付加されていなくともある程度どこの国
から発信されたかわかるようになります。
参考文献
2020年度版 Twitter API利用申請の例文からAPIキーの取得まで詳しく解説
https://www.itti.jp/web-direction/how-to-apply-for-twitter-api/