現在進めている、アドベントカレンダーに記載しているPOP Analyzer ですが、現在より広い範囲を扱う規格としてCustomer Analyzer として進めています。
その中で、プロトタイピングに特化したクラウドファンディングである、CAMPFIREのSPARKSに投稿することとしました。
今回は企画の進捗と、作成した機能について、記事を作成しました
必要な機能の分析
お客さまの行動を可視化するという目的であり、現状の整理としては①お客さまの動きをカメラでとらえる、②数値を簡単に分析するという二段階あることがわかります。それぞれで必要な機能を洗い出すと、
-
お客さまの動きをカメラでとらえる
- お客さまの行動を分類する機能
- 一定時間ごとに売場写真を撮影
- 判定結果の数値化
-
数値を簡単に分析する
- 数値化したデータの蓄積
- 蓄積しているデータの取り出し
- データの可視化
- データの統計的な分析
- データを使いやすいように書き出す
ここで、企画を人に伝えるという観点で考えると、後半の数値分析部分を実装することが必要と考えました。機械学習モデルで行動を分析するといえば、モデルの精度・測定手段といった課題はあるものの、やりたいことがイメージしやすい一方、そのデータを分析するといっても、実際のレポートイメージがなければ全く伝わらないからです。
また、企画を伝えるという意味では、細かい統計分析よりも視覚に訴える機能を優先的に実装が必要と言えます。
長くなりましたが、今回実装を試みた機能は3つです
- デモ用ダミーデータの生成
- ボタン一つでのデータ可視化
- スプレッドシートへのデータ転記
今回のプロダクト
See the Pen customer analyzer by watanabe-tsubasa (@watanabe-tsubasa) on CodePen.
CodePenで作成したwebアプリとなります。
結構重いので、以下のアドレスから使用していただいた方が無難かもしれません。
個別に説明します。
なお、グローバルで定義している変数は以下の通りです。
let span = [];//日付
let customerAll = [];//来店客数
let customerThrough = [];//通過客数
let customerSeeing = [];//視認客数
let customerCatching = [];//アプローチ客数
let rateThrough = [];//通過率
let rateSeeing = [];//視認率
let rateCatching = [];//アプローチ率
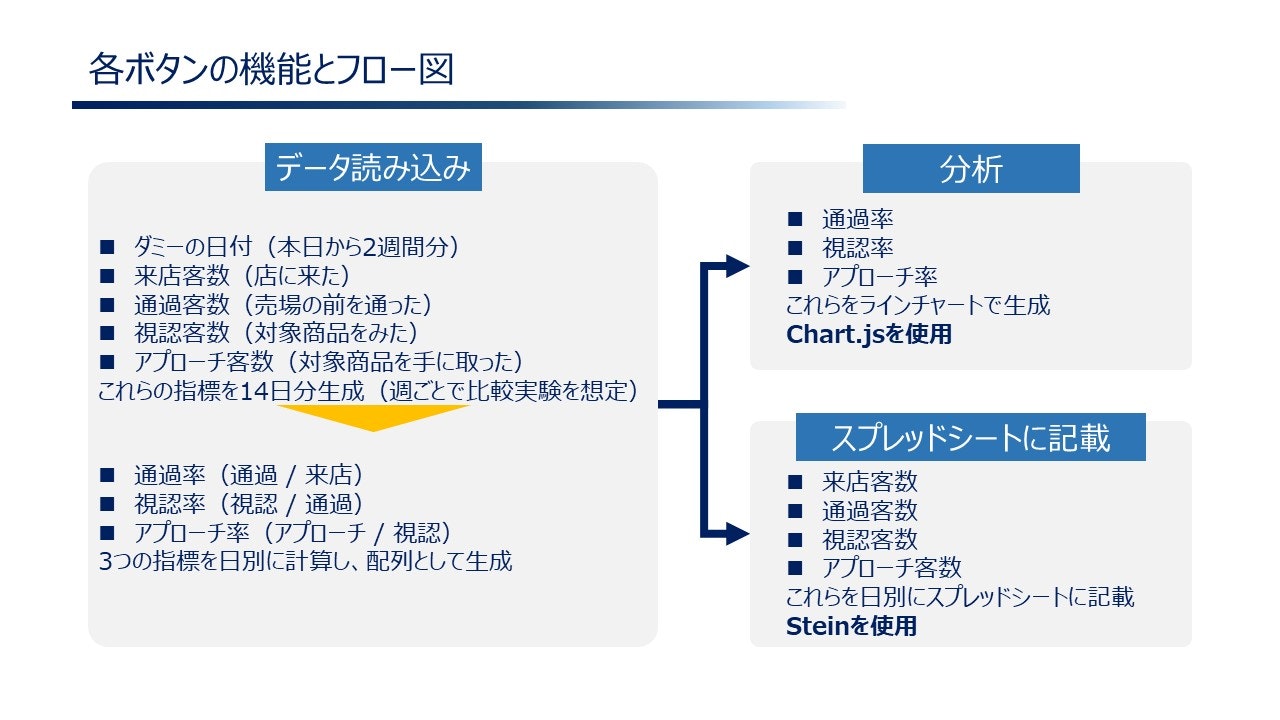
共通の変数として使用しますので、グローバルの変数として宣言。データ読みこみの部分で各変数にデータを渡して、その後に、分析、スプレッドシートに記載の役割を持つ関数で引数的に使用しています。
データ読み込み
デモ用のダミーデータを生成する部分です。
実際のプロダクトでは、店舗で取得したデータの読み込みを行う想定です。
コード
const buttonRead = () => {
//日付の取得
let day = new Date();
span = [];

for (let i = 0; i < 14; i++){
    day.setDate(day.getDate() + 1);
    //console.log(day); //チェック用
    let year = day.getFullYear();
    let month = day.getMonth() + 1;
    let date = day.getDate() - 1;
    //console.log(`${year}/${month}/${date}`); //チェック用
    span.push(`${year}/${month}/${date}`);
}
console.log(span);

customerAll = [];
customerThrough = [];
customerSeeing = [];
customerCatching = [];
rateThrough = [];
rateSeeing = [];
rateCatching = [];

let custGenerate = (day,custNumber) => {
    let rate;
    let customer;
    let customerArray = [];
    for(let i = 0; i < day; i++){
        rate = custNumber / 10 * Math.random();
        rate = Math.floor(rate);
        customer = custNumber * 0.95 + rate;
        if(i % 7 === 5 || i % 7 === 6){
            customer = Math.floor(1.3 * customer); //簡易的土日処理 1.3倍
        }
        customerArray.push(customer);
    }
    return customerArray
}

customerAll = custGenerate(14,10000); //来店客数
customerThrough = custGenerate(14,1000); //通過客数
customerSeeing = custGenerate(14,700); //視認客数
customerCatching = custGenerate(14,300); //アプローチ客数

console.log(customerAll);
console.log(customerThrough);
console.log(customerSeeing);
console.log(customerCatching);

let rateCalcurate = (array1,array2) => {
    let rate;
    let rateArray = [];
    for(let i = 0; i < 14; i++){
        rate = array2[i] / array1[i];
        rate = Math.floor(10000 * rate) / 100; //小数点以下2桁で計算
        rateArray.push(rate);
    }
    return rateArray;
}

rateThrough = rateCalcurate(customerAll,customerThrough); //通過率
rateSeeing = rateCalcurate(customerThrough,customerSeeing); //視認率
rateCatching = rateCalcurate(customerSeeing,customerCatching); //アプローチ率

console.log(rateThrough);
console.log(rateSeeing);
console.log(rateCatching);
}
客数生成
平均客数に対して前後5%の誤差で乱数を生成。
土日の客数を1.3倍に設定。
custGenerateという関数を設定しているので詳細は御確認ください。
各割合計算
日別で客数割合を計算。
小数点以下第2位で四捨五入
こちらはrateCalcurateという関数を設定しました。
分析
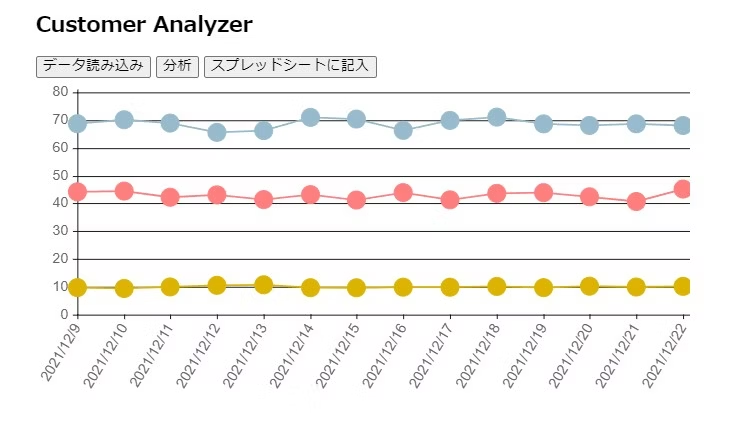
通過率、視認率、アプローチ率の3つの数値を日別でグラフ上にプロットします。
コード
const buttonAnalyze = () => {
    const lineChartData = {
        labels: span,
        datasets: [{
            fillColor: "rgba(220,220,220,0)",
            strokeColor: "rgba(220,180,0,1)",
            pointColor: "rgba(220,180,0,1)",
            data: rateThrough,
        }, {
            fillColor: "rgba(151,187,205,0)",
            strokeColor: "rgba(151,187,205,1)",
            pointColor: "rgba(151,187,205,1)",
            data: rateSeeing
        }, {
            fillColor: "rgba(255,127,127,0)",
            strokeColor: "rgba(255,127,127,1)",
            pointColor: "rgba(255,127,127,1)",
            data: rateCatching,
        }]
    }

    Chart.defaults.global.animationSteps = 50;
    Chart.defaults.global.tooltipYPadding = 16;
    Chart.defaults.global.tooltipCornerRadius = 0;
    Chart.defaults.global.tooltipTitleFontStyle = "normal";
    Chart.defaults.global.tooltipFillColor = "rgba(0,160,0,0.8)";
    Chart.defaults.global.animationEasing = "easeOutBounce";
    Chart.defaults.global.responsive = true;
    Chart.defaults.global.scaleLineColor = "black";
    Chart.defaults.global.scaleFontSize = 16;


    const ctx = document.getElementById("canvas").getContext("2d");
    let LineChartDemo = new Chart(ctx).Line(lineChartData, {
        pointDotRadius: 10,
        bezierCurve: false,
        scaleShowVerticalLines: false,
        scaleGridLineColor: "black"
    });
}
一から作ると大変ですCodePenのテンプレートを使いましょう
テンプレートであればライブラリを入れ忘れることもありません。今回はChart.jsを使用しているテンプレートです。
一から作成にチャレンジする型は
https://cdnjs.cloudflare.com/ajax/libs/Chart.js/1.0.2/Chart.min.js
こちらのライブラリのインポートを忘れないようにしましょう。
ライブラリの埋め込みはこの記事に記載しております。

凡例抜けてしまいましたが
青が視認率
赤がアプローチ率
黄色が通過率
となります。ダミーデータですので、実際の数値がこの程度のサイズとなるかは不明です。
#スプレッドシートに記入
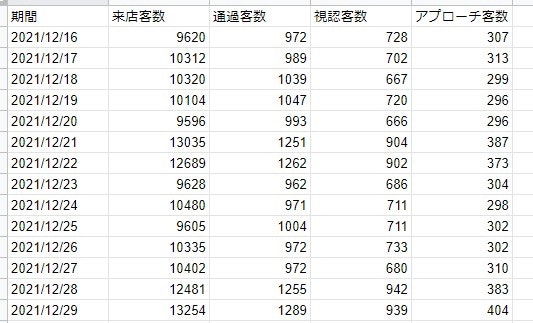
4つの客数数値をSteinでスプレッドシートに転記します。

コード
const store = new SteinStore(`Stein API`);

const buttonSheet = async () => {
  for(let i = 0; i < span.length; i++){
    await store.append('シート1',[
      {期間: span[i],
       来店客数: customerAll[i],
       通過客数: customerThrough[i],
       視認客数: customerSeeing[i],
       アプローチ客数: customerCatching[i],
      }
    ]);
    console.log(i)
  }
}
単純に繰り返すと、データの出力とスプレッドシートへの記入にラグがあるため、次々とセルの上に上書きされるような挙動となります。
async / await で非同期処理としましょう
失敗コード①
正常に動かないコード
 const buttonSheet = async () => {
   for(let i = 0; i < span.length; i++){
     store.append('シート1',[
       {期間: span[i],
        来店客数: customerAll[i],
        通過客数: customerThrough[i],
        視認客数: customerSeeing[i],
        アプローチ客数: customerCatching[i],
       }
     ]);
     await console.log(i)
   }
 }
具体的な挙動としては、Googleシートへの入力中に、同じ列に入力してしまったり、順番が前後して入力されたりと、分析に使えるデータセットとはなりませんでした。
明らかにデータが目詰まりを起こしている状態でしたので、for文の中で非同期処理を行うことを目指し、次のコードを作成しました。
失敗コード②
//VS コード上では想定通り動くが、CodePenで動かないコード
const buttonSheet = () => {
function triangle (base,height) {
  return new Promise(resolve => {
    setTimeout(() => {
      const area = base * height / 2;
      console.log(area);
      resolve(area);
    }, 500);
  });
}

(async () => {
  let areas = []
  for (const i of array) {
    const area = await triangle(i, i);
    areas.push(array[13-i]); //チェック用。うまく動いていれば13から0の順に並んだ配列が生成される
  }
  console.log(areas);
})();
}
for と awaitを組みあわあせた形。まずは動かすために、ネットに置いていた関数を流用しました。
https://crieit.net/posts/for-await-Promise-all
原文は三角形の面積を3秒ごとに計算し、結果をpromiseとして受け取ることで、処理を遅らせているのですが、原文における三角形処理の後に、スプレッドシートへの転記を行えば、ひとまずデータの目詰まりは解消できるのではと考えました。
コメントアウトでも記載しましたが、うまくいけばareas.push(array[13-i])が動作し、最後に配列が出力されることになります。
結果として、VS Code上では動きましたが、CodePenに記述して、ボタンを押してスタートという形式にすると、数値を拾うこともなく動きませんでした。
初めて見る人は何言ってるのかよくわからないかもしれませんが、for await of も使えるように、忘備録として残します。
結びに
今回は非同期処理への理解の浅さが露呈して悔しいですね。
クラウドファンディングページにも記載しましたが、小売業は、売上以外の指標としてお客さまの行動を分析することで、まだまだ伸びしろがあると考えています。
引き続き企画のブラッシュアップと、実装報告をさせていただきますので、よろしくお願いします。
