vscode-chrome-debug - Attachと同じことをWebStormでやる方法です。公式ドキュメント含め誰も書いてないっぽいのでメモ。
vscode-chrome-debug - Attachの方法でChromeを起動して、Port 9229でChrome Debugging protocolをlistenさせます。Linuxの場合は google-chrome --remote-debugging-port=9229 実行後、以下のコマンドでちゃんとlistenしているか確認。
$ netstat -an | grep 9229
tcp        0      0 127.0.0.1:9229          0.0.0.0:*               LISTEN

$ lsof -i :9229
COMMAND   PID USER   FD   TYPE DEVICE SIZE/OFF NODE NAME
chrome  18347  wsh  132u  IPv4 729759      0t0  TCP localhost:9229 (LISTEN)
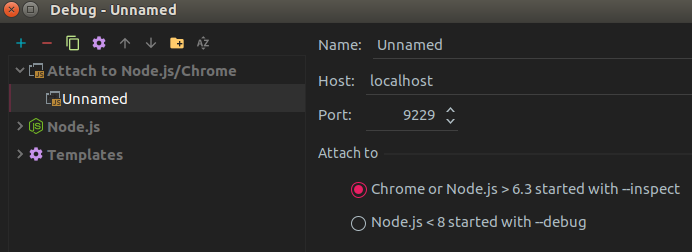
WebStormでConfiguration "Attach to Node.js/Chrome" を作成:
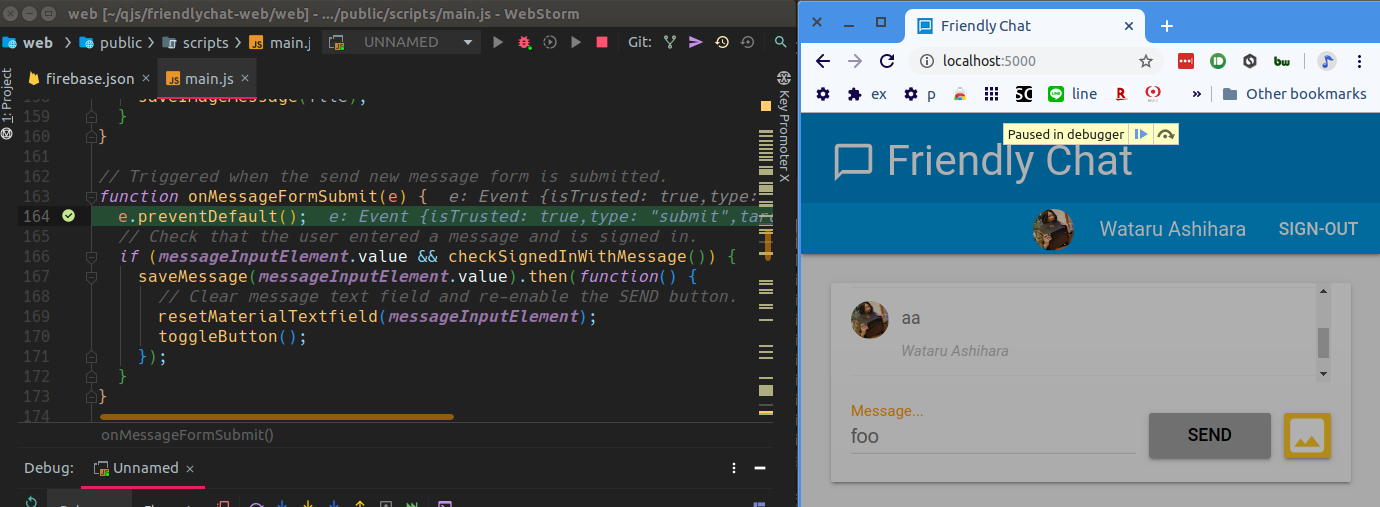
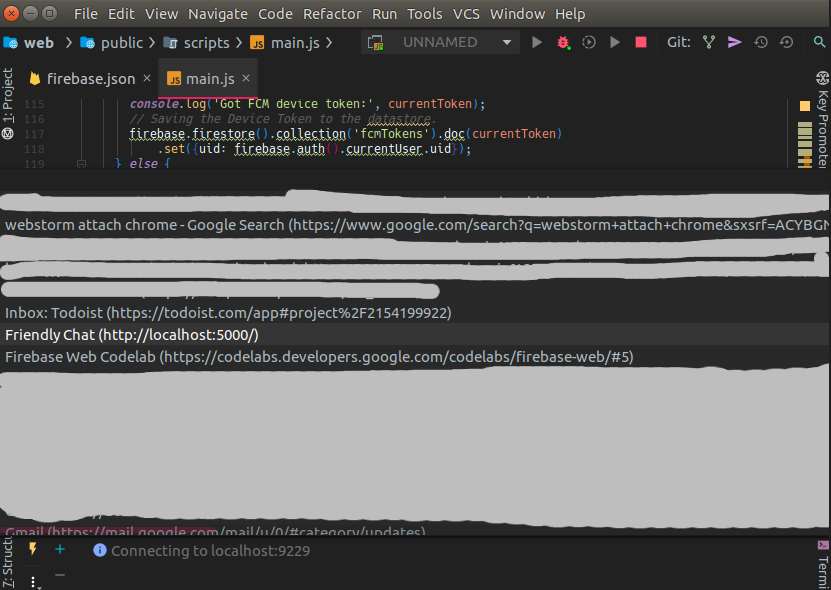
作成したConfigurationでDebugを開始すると、Chromeで開いているタブ一覧が表示されるので、デバッグしたいタブを選びます。今回はFirebaseチュートリアルのFriendly Chat。
無事ブレークポイントにヒットして人権を手にしました。