線幅を指定したラインプロファイルの取得法
自身の研究の都合上、画像データを取り扱うことが多く、ラインプロファイルを取得したくなるときがあります。
画像中の二点を指定し、離散的な画像データを補完しながら二点間でのラインプロファイルを1ピクセルの間隔で取得するプログラム
How to extract an arbitrary line of values from a numpy array?を参考にして、
任意の線幅でラインプロファイルを描けるようにしましたので、サンプルコードとその結果を紹介したいと思います。
サンプルコードは、
import numpy as np
import scipy.ndimage
import matplotlib.pyplot as plt

# -- Generate some data...
x, y = np.mgrid[-5:5:0.1, -5:5:0.1]
z = np.sqrt(x**2 + y**2) + np.sin(x**2 + y**2)

# -- Extract the line...
# Make a line with "num" points...
x0, y0 = 12, 12.5 # These are in _pixel_ coordinates!!
x1, y1 = 60, 75

num = int(round(np.hypot(x1-x0, y1-y0))) #二点間の距離をピクセル数に変換
x, y = np.linspace(x0, x1, num), np.linspace(y0, y1, num)

if x1-x0 == 0:# This type of Lines is parallel to y-axis
    factorx = 1
    factory = 0
elif y1-y0 == 0:# This type of Lines is parallel to x-axis
    factorx = 0
    factory = 1
else:# Evaluate the slops of the line and the orthogonal one...
    a = (y1-y0)/(x1-x0)
    inv_a = - 1/a
    factor = pow(pow(a,2)/(pow(a,2)+1),1/2)
    factorx = factor
    factory = inv_a*factor

# Extract the values along the line, using cubic interpolation
z1 = scipy.ndimage.map_coordinates(z, np.vstack((x,y))) #width = 1

width=10 # even number
SumZ = z1/(int(width/2)*2+1)
for i in range(1,int(width/2)+1):
    zi = scipy.ndimage.map_coordinates(z, np.vstack((x+round(i*factorx),y+round(i*factory))))
    SumZ = SumZ + zi/(int(width/2)*2+1)
    zi = scipy.ndimage.map_coordinates(z, np.vstack((x-round(i*factorx),y-round(i*factory))))
    SumZ = SumZ + zi/(int(width/2)*2+1)
avZ = SumZ

# -- Plot...
plt.figure(figsize=(12,9))
plt.subplot(2,1,1)
plt.imshow(z)
plt.plot([x0, x1], [y0, y1], 'ro-',linewidth = width,label='width='+str(width))
plt.plot([x0, x1], [y0, y1], 'bo-',linewidth = 1, label='width=1')
plt.legend()

plt.subplot(2,1,2)
plt.rcParams["font.size"] = 18
plt.tick_params(labelsize=18)
plt.plot(z1,label='width=1')
plt.plot(avZ,label='width='+ str(width))
plt.legend()
plt.xlabel('pixel')
plt.ylabel('hight')

plt.show()
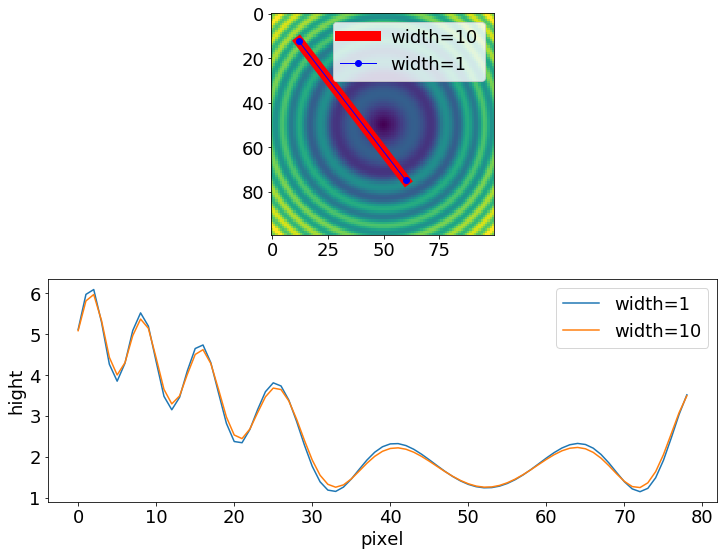
この通りです。出力結果は、
となります。
私のサンプルコードでは、元のプログラムを参考に、線幅を変えることができるようにしました。そのために、二点間を結ぶ直線をその直線に対して垂直な方向に平行移動させています。平行移動後の位置でプロファイルを平行移動する距離を変えながら取得して、それらの平均を取ることで、線幅を太くしています。
もう少し詳しく説明します。
# Evaluate the slops of the line and the orthogonal one...
a = (y1-y0)/(x1-x0)
inv_a = - 1/a
まず、ある直線の傾きとその直線に直交する直線の傾きの積が$-1$になる事実を利用し、垂直な方向を求めました。この知識を利用したのは中学数学以来かもしれません…(笑)懐かしいですね。
factor = pow(pow(a,2)/(pow(a,2)+1),1/2)
factorx = factor #Delta x
factory = inv_a*factor #Delta y
次に、垂直方向への平行移動を実現するために、n pixelだけ平行移動した際に、その直線の(x,y)座標の組にどのような影響がでるか、factorという因子を用いて評価してます。
元の直線の(x,y)座標からのズレを$\Delta x$と$\Delta y$として、
 n ^2 = \Delta x ^2 + \Delta y ^2
   = \Delta x ^2 (1+\frac{1}{a^2})
三平方の定理が成り立つため、
\Delta x = \pm (\frac{a^2}{a^2+1}) ^ \frac{1}{2} \times n = \pm factor ^ \frac{1}{2} \times n
\Delta y = \mp \frac{1}{a} \times factor ^ \frac{1}{2} \times n
n pixelだけ平行移動した直線のx,y座標はfactorを用いて上記のように書けます。
$+-$両方の符号が出てくる理由は、ある直線に対して垂直方向は2方向で定義できるためです。
このことを考慮して、$+\Delta x$と$+\Delta y$、$-\Delta x$と$-\Delta y$ の両方を場合で、ラインプロファイルを取得しました。
# Extract the values along the line, using cubic interpolation
z1 = scipy.ndimage.map_coordinates(z, np.vstack((x,y)))#width = 1

width=10 # even number
SumZ = z1
for i in range(1,int(width/2)+1):
    zi = scipy.ndimage.map_coordinates(z, np.vstack((x+round(i*factorx),y+round(i*factory))))
    SumZ = SumZ + zi
    zi = scipy.ndimage.map_coordinates(z, np.vstack((x-round(i*factorx),y-round(i*factory))))
    SumZ = SumZ + zi
avZ = SumZ/(int(width/2)*2+1)
(この方法だと偶数倍の長さのラインプロファイルしか、取れないのが難点ではあるのですが・・・)
以上 少しでも参考になれば幸いです。
追記 04/03 訂正
# Extract the values along the line, using cubic interpolation
width = 11
SumZ =np.zeros(num)
for i in range(0,width):
    zi = scipy.ndimage.map_coordinates(z, np.vstack((x+i-int(width/2),y+round(inv_a*(i-int(width/2))))))
    SumZ = SumZ + zi
    print(i-int(width/2),round(inv_a*(i-int(width/2))))
avZ = SumZ/width
の部分を
# Extract the values along the line, using cubic interpolation
z1 = scipy.ndimage.map_coordinates(z, np.vstack((x,y)))#width = 1

width=10 # even number
SumZ = z1
for i in range(1,int(width/2)+1):
    zi = scipy.ndimage.map_coordinates(z, np.vstack((x+round(i*factor),y+round(inv_a*factor*i))))
    SumZ = SumZ + zi
    zi = scipy.ndimage.map_coordinates(z, np.vstack((x-round(i*factor),y-round(inv_a*factor*i))))
    SumZ = SumZ + zi
avZ = SumZ/(width+1)
に訂正しました。
追記 04/07 訂正
04/03で訂正した部分を
# Extract the values along the line, using cubic interpolation
z1 = scipy.ndimage.map_coordinates(z, np.vstack((x,y)))#width = 1

width=10 # even number
SumZ = z1
for i in range(1,int(width/2)+1):
    zi = scipy.ndimage.map_coordinates(z, np.vstack((x+round(i*factorx),y+round(i*factory))))
    SumZ = SumZ + zi
    zi = scipy.ndimage.map_coordinates(z, np.vstack((x-round(i*factorx),y-round(i*factory))))
    SumZ = SumZ + zi
avZ = SumZ/(int(width/2)*2+1)
にさらに訂正しました。x軸やy軸に垂直な直線に対しても対応できるようにしました。0で割ることのないように…💦
そのため、1 pixelだけ直線を平行移動した際、x座標とy座標の変化をそれぞれfactorx,factoryで表すことにしました。
if x1-x0 == 0:# This type of Lines is parallel to y-axis
    factorx = 1
    factory = 0
elif y1-y0 == 0:# This type of Lines is parallel to x-axis
    factorx = 0
    factory = 1
else:# Evaluate the slops of the line and the orthogonal one...
    a = (y1-y0)/(x1-x0)
    inv_a = - 1/a
    factor = pow(pow(a,2)/(pow(a,2)+1),1/2)
    factorx = factor
    factory = inv_a*factor
にfactorx,factoryの計算法が載っています。
追記 05/24 訂正
scipy.ndimage.map_coordinatesでは、ndarrayがreturnされます。このarray中の値が255を超えるとオーバーフローすることに気づきました。本ラインプロファイルでは、for文で、このarrayの和を取るので、array中の値が大きいとオーバーフローする可能性がありました。そこで、ラインプロファイルの規格化を最後にまとめて行うのではなく、予め規格化したラインプロファイルの和を取ることにしました。コードとしては、
# Extract the values along the line, using cubic interpolation
z1 = scipy.ndimage.map_coordinates(z, np.vstack((x,y)))#width = 1

width=10 # even number
SumZ = z1
for i in range(1,int(width/2)+1):
    zi = scipy.ndimage.map_coordinates(z, np.vstack((x+round(i*factorx),y+round(i*factory))))
    SumZ = SumZ + zi
    zi = scipy.ndimage.map_coordinates(z, np.vstack((x-round(i*factorx),y-round(i*factory))))
    SumZ = SumZ + zi
avZ = SumZ/(int(width/2)*2+1)
から
# Extract the values along the line, using cubic interpolation
z1 = scipy.ndimage.map_coordinates(z, np.vstack((x,y)))#width = 1

width=10 # even number
SumZ = z1/(int(width/2)*2+1)
for i in range(1,int(width/2)+1):
    zi = scipy.ndimage.map_coordinates(z, np.vstack((x+round(i*factorx),y+round(i*factory))))
    SumZ = SumZ + zi/(int(width/2)*2+1)
    zi = scipy.ndimage.map_coordinates(z, np.vstack((x-round(i*factorx),y-round(i*factory))))
    SumZ = SumZ + zi/(int(width/2)*2+1)
avZ = SumZ
としました。ndarrayのdtypeを見てもfloat64と出てくるのに、このような振る舞いをするのは、なぜなのか・・・。わかったら報告します。
