地理院地図Vectorのベクトルタイルデータ
国土地理院から地理院地図のベクトルバージョンが試験公開されました。
https://github.com/gsi-cyberjapan/gsimaps-vector-experiment
地理院地図の基本図と同じ内容がベクトルデータとして取得できることで、好きな情報を好きなスタイルで表現した地図を作ることができます。2019年7月の段階では、関東の一部地域のみですが、地域が拡大されることを期待したいです。(追記:2020/3/19 全国版データが公開されました☺️)
画像のタイルデータと同じ方法でタイル単位のベクトルデータがオンラインで提供されるもので、ベクトルデータの形式は、Mapboxのベクトルタイルに従っているようです。
Mapboxを利用して表示等を行う場合は、内部のデータ構造について理解する必要は無いと思いますが、ここでは独自にタイルデータを取得して利用する方法について解説します。
Mapboxのベクトルタイルデータ
Mapboxのベクトルタイルの仕様はこちらにあります。
https://github.com/madefor/vector-tile-spec/blob/master/2.1/README.md
これによると、データは Google Protocol Buffers で符号化されているとあります。
まずこの仕様に従ってデコードする必要があります。
Google Protocol Buffers
Protocol Buffersの仕様についてはこちら。
https://developers.google.com/protocol-buffers/
これは、Googleが策定した、構造化データをバイナリデータとして効率よく扱うためのものです。名前のついた型付のデータのグループ(message)を入れ子にして表現することができます。
Protocol Buffersでは、スキーマの定義に従ってエンコード/デコードをします。スキーマ定義ファイルが、protoという拡張子になっています。
Mapboxデータのスキーマ定義は、上記の仕様のところにある、vector_tile.proto というファイルです。
package vector_tile;

option optimize_for = LITE_RUNTIME;

message Tile {

        // GeomType is described in section 4.3.4 of the specification
        enum GeomType {
             UNKNOWN = 0;
             POINT = 1;
             LINESTRING = 2;
             POLYGON = 3;
        }

        // Variant type encoding
        // The use of values is described in section 4.1 of the specification
        message Value {
                // Exactly one of these values must be present in a valid message
                optional string string_value = 1;
                optional float float_value = 2;
                optional double double_value = 3;
                optional int64 int_value = 4;
                optional uint64 uint_value = 5;
                optional sint64 sint_value = 6;
                optional bool bool_value = 7;

                extensions 8 to max;
        }

        // Features are described in section 4.2 of the specification
        message Feature {
                optional uint64 id = 1 [ default = 0 ];

                // Tags of this feature are encoded as repeated pairs of
                // integers.
                // A detailed description of tags is located in sections
                // 4.2 and 4.4 of the specification
                repeated uint32 tags = 2 [ packed = true ];

                // The type of geometry stored in this feature.
                optional GeomType type = 3 [ default = UNKNOWN ];

                // Contains a stream of commands and parameters (vertices).
                // A detailed description on geometry encoding is located in
                // section 4.3 of the specification.
                repeated uint32 geometry = 4 [ packed = true ];
        }

        // Layers are described in section 4.1 of the specification
        message Layer {
                // Any compliant implementation must first read the version
                // number encoded in this message and choose the correct
                // implementation for this version number before proceeding to
                // decode other parts of this message.
                required uint32 version = 15 [ default = 1 ];

                required string name = 1;

                // The actual features in this tile.
                repeated Feature features = 2;

                // Dictionary encoding for keys
                repeated string keys = 3;

                // Dictionary encoding for values
                repeated Value values = 4;

                // Although this is an "optional" field it is required by the specification.
                // See https://github.com/mapbox/vector-tile-spec/issues/47
                optional uint32 extent = 5 [ default = 4096 ];

                extensions 16 to max;
        }

        repeated Layer layers = 3;

        extensions 16 to 8191;
}
だいたい見れば自明だと思います。
Tileというmessageは、複数のLayerから成っていて、Layerには、version,name,features,keys,valuesといった内容が含まれています。message Featureには、id,tags,type, geometry,extentが含まれます。後述しますが、このtypeとgeometryで実際のベクトルの座標データを表すことになります。
地理院地図vectorのタイルデータを読む
地理院地図vectorのタイルデータをこのMapboxのスキームに従って読み込めばいいことになります。流石にProtocol Buffersのデコードまで自前でやるのは車輪の再発明に過ぎるので、javascriptのライブラリを利用します。
実装はいくつかあるようですが、これが使いやすそうだったのでこれでやってみます。
https://github.com/protobufjs/protobuf.js#using-proto-files
まず、タイルデータをバイナリデータとして取得するために、XMLHttpRequestで読み込む関数を用意しておきます。
function load(path) {
	return new Promise(function(resolve,reject){
		var req = new XMLHttpRequest();
		req.open("get",path,true) ;
		req.responseType = "arraybuffer" ;
		req.onload = () => {
			if(req.status==200) {
				resolve(req.response) ;
			} else {
				reject("file cannot load") ;
			}
		}
		req.send() ;
	})
}
読み込んだデータをprotobuf.jsを使ってデコードします。
とりあえずテストに固定のタイルパスを指定して読み込んでみます。
const tilepath = "//cyberjapandata.gsi.go.jp/xyz/experimental_bvmap/13/7273/3226.pbf"
protobuf.load("vector_tile.proto", function(err, root) {
    if (err)
        throw err
    const tile = root.lookupType("vector_tile.Tile")
    load(tilepath).then(data => {
		const buf = new Uint8Array(data)
		const msg = tile.decode(buf)
		console.log(tile.toObject(msg))
	})
})
まず、Mapboxのスキーマファイルを読み込むために protobuf.load を呼びます。コールバックの中で、lookupTypeでTileのスキーマを取り出しておきます。
準備ができたら、タイルデータをload関数で読み込みます。
protobufのデコーダは、Uint8Arrayを入力とするので、読み込んだデータをUint8Arrayにして、tile.decodeでデコードします。デコードしたものを、toObjectメソッドでjavascriptのオブジェクトに変換することができます。
取得したオブジェクトをconsoleにダンプした結果が以下のようになりました。
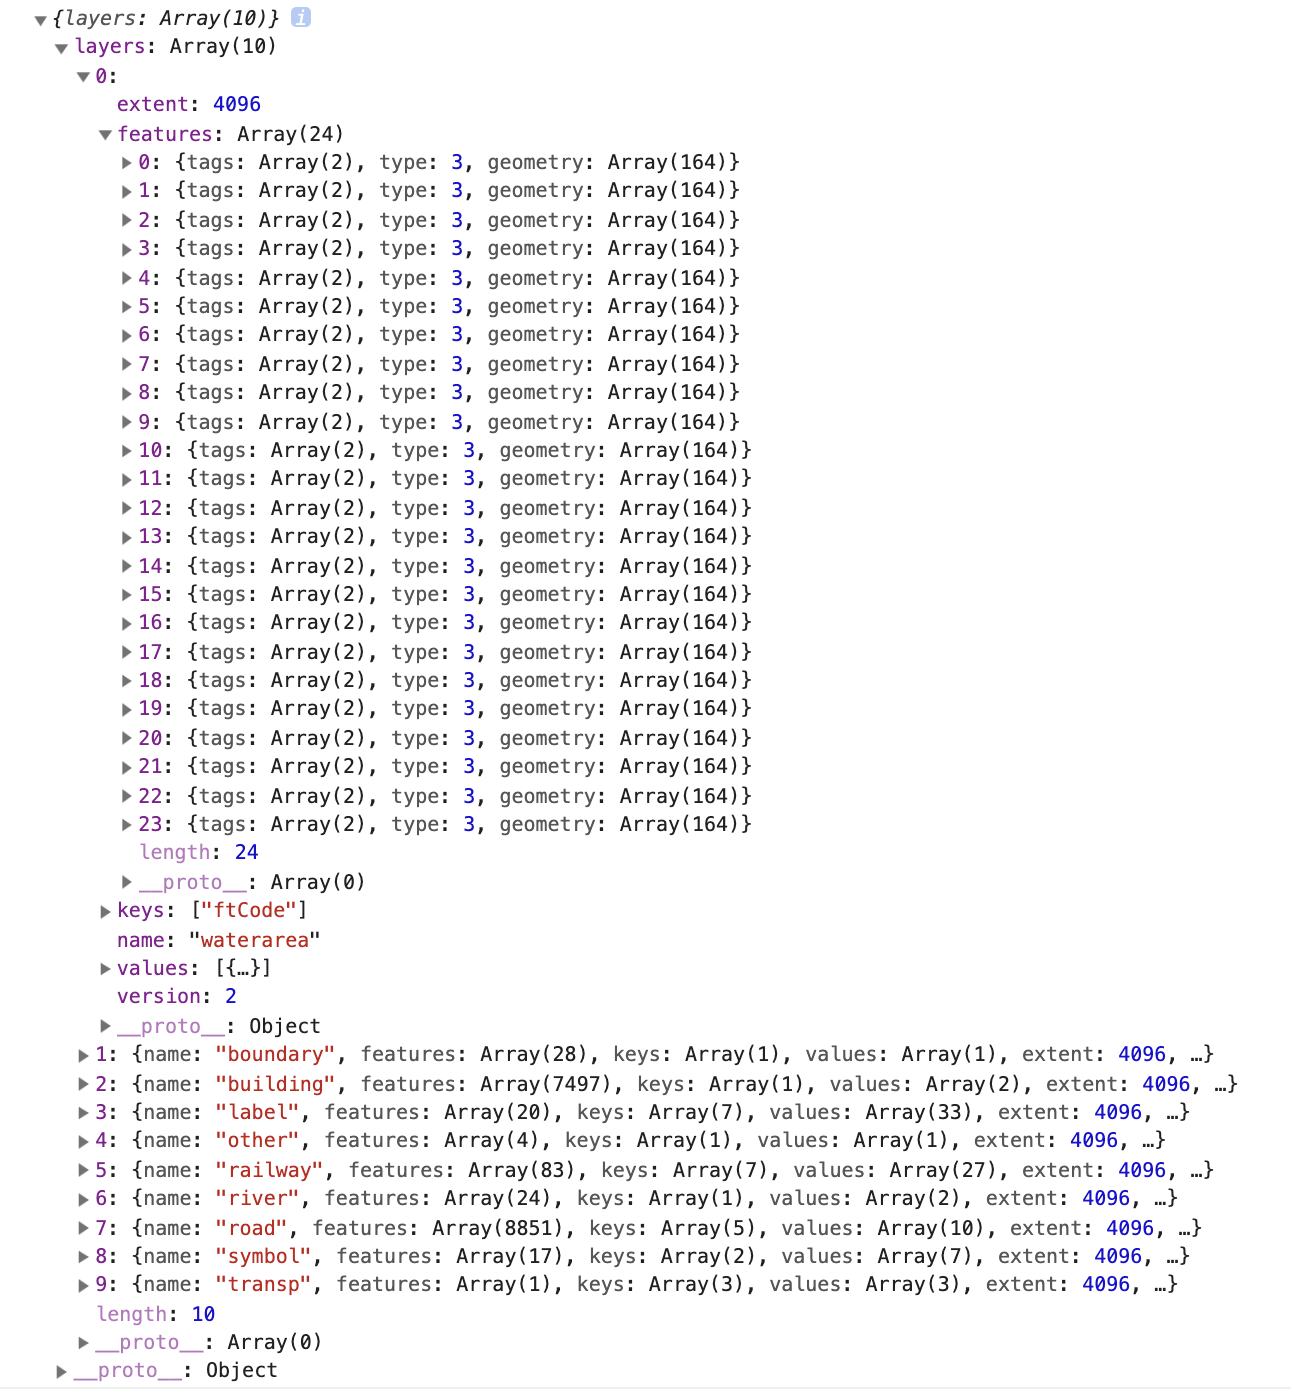
layer.nameを見ればどの情報のレイヤであるかはすぐわかりますね。
タイルデータの解釈と描画
必要なLayerから属性値と座標データを取り出せばいいわけですが、これらのデータの持ち方も独特になっています。
属性値
まずLayerの中の個々の地物であるfeaturesは、属性値を持っていますが、そのkey-value値がそれぞれLayerの中に配列としてまとめられて、各featureはそのインデックスを参照する、という構造になっています。こうすることで、属性のkeyやvalueの共通するものが1つにまとめられ、データサイズの効率が良くなっています。
layer.keysが属性値のキーの配列、layer.valuesが値の配列で、feature.tagがkeyとvalueのインデックス2つの整数を単位とする配列になっています。
各々の属性値の意味については、地理院vectorの仕様書の「属性等の仕様詳細」を参照してください。
描画コマンド
feature.geometoryが実際に描画されるベクトルデータです。moveToやlineToなどのコマンドと繰り返し回数、それに続く座標値が、整数の配列としてシリアライズされています。この辺りの詳細は、Mapboxのデータの仕様を参照してください。
独特なのが数値の表現で、符号付整数の符号が最下位ビットに来るようになっています。これによって絶対値の小さな値の上位ビットが0になることで、圧縮効率が上がることを期待してると思われます。
この数値データをデコードするのは次のようなコードになります。
function decodeint(value) {
    return (value >> 1) ^ (-(value & 1))
}
描画コマンドの座標値は各タイルの左上を原点として、右下は、layer.extentの値で規定されます。地理院タイルでは4096になっているので、1つのタイルあたりのベクトル分解能は縦横4096ということになります。
描画サンプル
以上を踏まえて、1つのlayerの線分をcanvasに描画するサンプルです。"road"の道路レイヤー専用で汎用にはなっていません。
属性rnkWidthに道路の幅が入っているので、これを使って描画する線幅lineWidthを決めています。
function draw(layer) {
	const ext = layer.extent
	const can = document.getElementById("target")
	const ctx = can.getContext("2d")
	ctx.fillStyle = "rgb(250,250,250)"
	ctx.fillRect(0,0,can.width,can.height)
	ctx.lineWidth = 1
	ctx.strokeStyle = "black"
	let lc = 0 ;
	const wx = can.width/ext, wy = can.height/ext // axis scale
	for(let i in layer.features) {
		//decode tags
		let tags = layer.features[i].tags
		let attr = {}
		for(let i=0;i<tags.length;i+=2) {
			attr[layer.keys[tags[i]]] = layer.values[tags[i+1]]
		}

		//decode geometory
		let geo = layer.features[i].geometry
		let gi = 0
		let cx = 0
		let cy = 0
		ctx.lineWidth = attr.rnkWidth.intValue + 1
		ctx.beginPath()
		while( gi < geo.length) {
			let c = geo[gi++]
			let cmd = c & 7		//command
			let count = c >> 3 	//count
			switch(cmd) {
				case 1://moveto
					for(let i=0;i<count;i++) {
						cx += decodeint(geo[gi])
						cy += decodeint(geo[gi+1])
						ctx.moveTo(cx*wx,cy*wy)
					}
					gi += count*2
					break
				case 2://liento
					for(let i=0;i<count;i++) {
						cx += decodeint(geo[gi++])
						cy += decodeint(geo[gi++])
						ctx.lineTo(cx*wx,cy*wy)
						lc++
					}
					break
				case 7://close
					break
			}
		}
		ctx.stroke()
	}
}
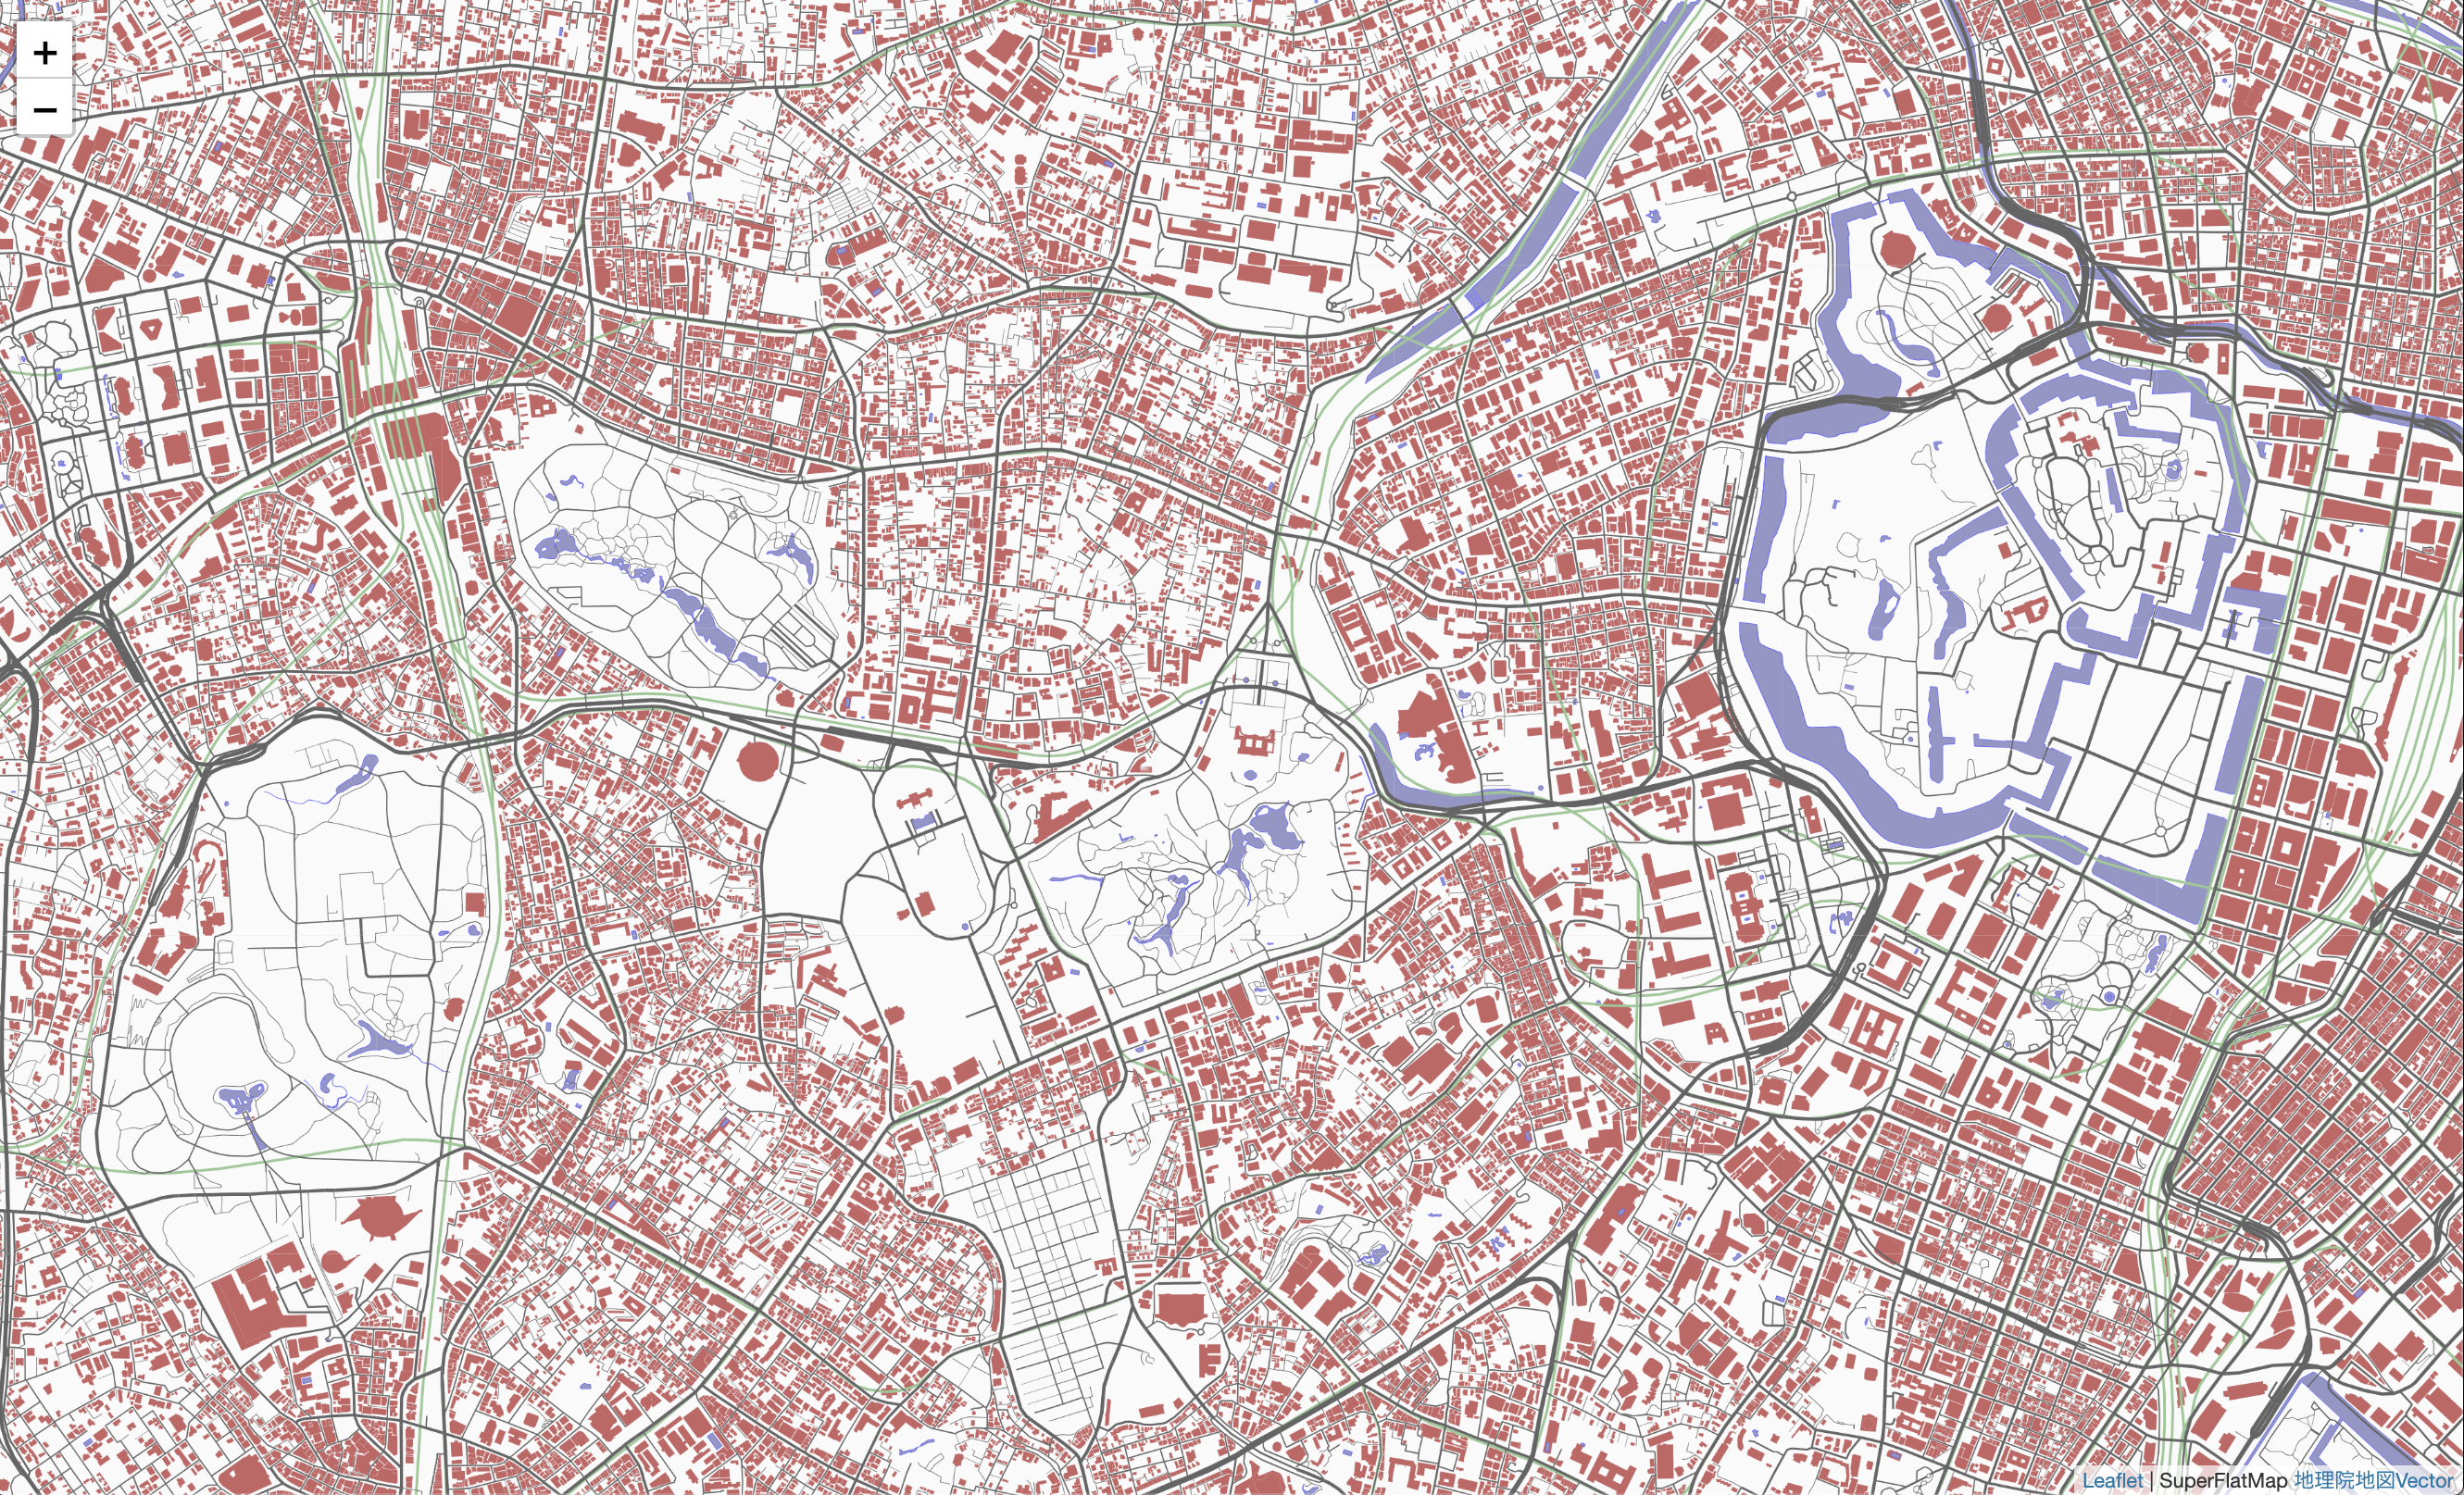
これで描画したものと、地理院地図の画像タイルデータを並べて出してみるとこんな感じになります。

この例では、単一の線の幅を変えただけですが、地理院地図では、太い道路は輪郭のラインと中の塗りつぶしラインの2つのラインを描画する、といったことをしています。
地理院地図の画像タイルとベクトルデータの情報内容は、ベクトルデータの方がzoom値で1段階詳細になっています。上の図は、zoom14の画像タイル4枚分(512x512px)と、zoom13のベクトルデータを並べています。
実際に動くページはこちらで見られます。
https://wakufactory.jp/map/gsivec/test0.html
Leafletを使って描画する
地図フレームワークのLeafletを使って、ベクトルデータを地図として表示してみます。
https://leafletjs.com/
ここでは、canvasのレイヤー1つにベクトルデータから必要な情報を描画することにします。
Leafletで独自のcanvasレイヤを追加するには、GridLayerを拡張して新しいクラスを作成します。createTileというメソッドを実装して、その中でcanvasエレメントを生成して、そこに描画すればいいことになります。
この中でタイルデータの読み込みもするので非同期に処理する必要があります。読み込みと描画が終わった時点で、doneのコールバックを呼び出せばOKです。
描画関係は上の例と同じような感じですが、GSIVというクラスにまとめてあります。
	const gsiv = new GSIV()
	await gsiv.init()
	var CanvasLayer = L.GridLayer.extend({
		createTile: function(coords,done){
			let error
			// create a <canvas> element for drawing
			const tile = L.DomUtil.create('canvas', 'leaflet-tile');
			// setup tile width and height according to the options
			const size = this.getTileSize();
			tile.width = size.x*2
			tile.height = size.y*2
			const ctx = tile.getContext("2d")
			gsiv.loadtile(coords.z-1,coords.x,coords.y).then(layers=>{
				ctx.fillStyle = "rgb(250,250,250)"
				ctx.fillRect(0,0,tile.width,tile.height)
				if(layers.waterarea) gsiv.draw(tile,layers.waterarea)
				if(layers.lake) gsiv.draw(tile,layers.lake)
				if(layers.river) gsiv.draw(tile,layers.river)
				if(layers.railway) gsiv.draw(tile,layers.railway)
				if(layers.building) gsiv.draw(tile,layers.building)
				if(layers.road) gsiv.draw(tile,layers.road)
				done(error,tile)
			}).catch(e=>{
				ctx.fillStyle = "rgb(150,150,150)"
				ctx.fillRect(0,0,tile.width,tile.height)
				done(error,tile)
			})
			return tile;
		}
	})
描画クラスの準備ができたら、Leafletを初期化して、レイヤのインスタンスを作ってaddすれば地図として出来上がりです。
mapの初期化オプションで、zoomSnapを0にしておくと、シームレスなズームになります。
レイヤ生成では、タイルのサイズを512にしています。上の描画クラスの中で、canvasのサイズをタイルサイズの2倍にしているので、canvasはタイル1枚あたり1024x1024の解像度になります。これでretinaのディスプレイでも高精細な描画になります。
タイルサイズを256から変えると、zoomの値と地理院タイルのzoom値がずれるので注意してください。512にしたので、Leafletのzoom-1からタイルURLを生成しています。
	const map = L.map('map',{
		zoom:14,
		minZoom:13.5,
		maxZoom:17.4,
		zoomSnap:0,
		center:[35.657741,139.742269]
	});

	const vlayer = new CanvasLayer({
		tileSize:512,
		attribution: "<a href='https://github.com/gsi-cyberjapan/gsimaps-vector-experiment' target='_blank'>国土地理院ベクトルタイル提供実験</a>"})
	vlayer.addTo(map)
道路、鉄道と建物だけを描いたシンプルな地図にしてみました。
以上の実際に動くページはこちら。全体はソースを参照してください。
https://wakufactory.jp/map/gsivec/leaf0.html