はじめに
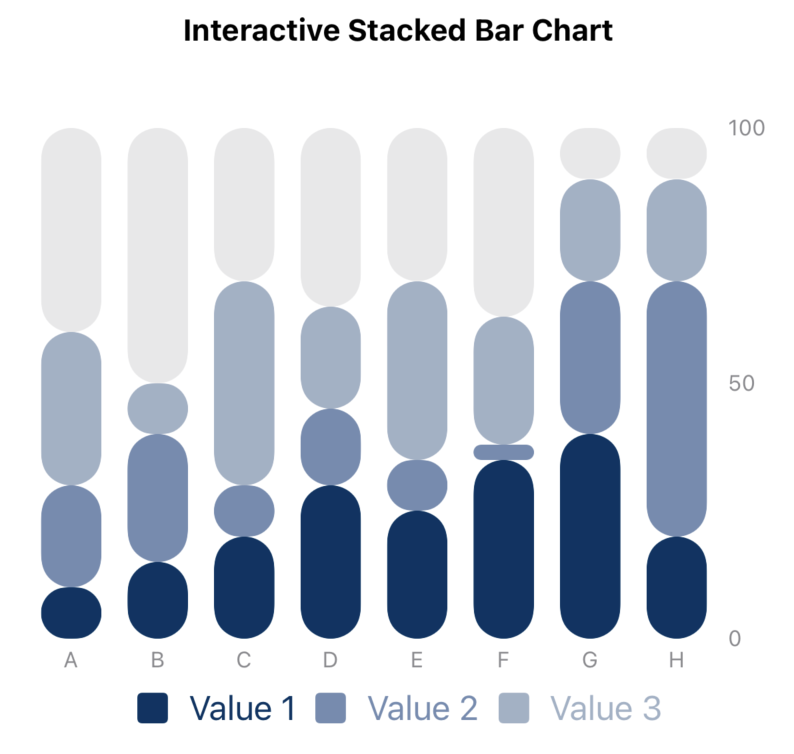
Swiftの積み上げ棒グラフであまり見たことのないけど便利そうなものを作ったので共有する。
動機としては、アプリデザインの一貫性を保つために同一系の色にしたいが、同一系の色にすると積み上げ棒グラフの視認性が大きく下がることに対して対策を考えていた。デザインの一貫性と視認性を両方鑑みた結果今回作ったものに行き着いた。
今回作ったもの


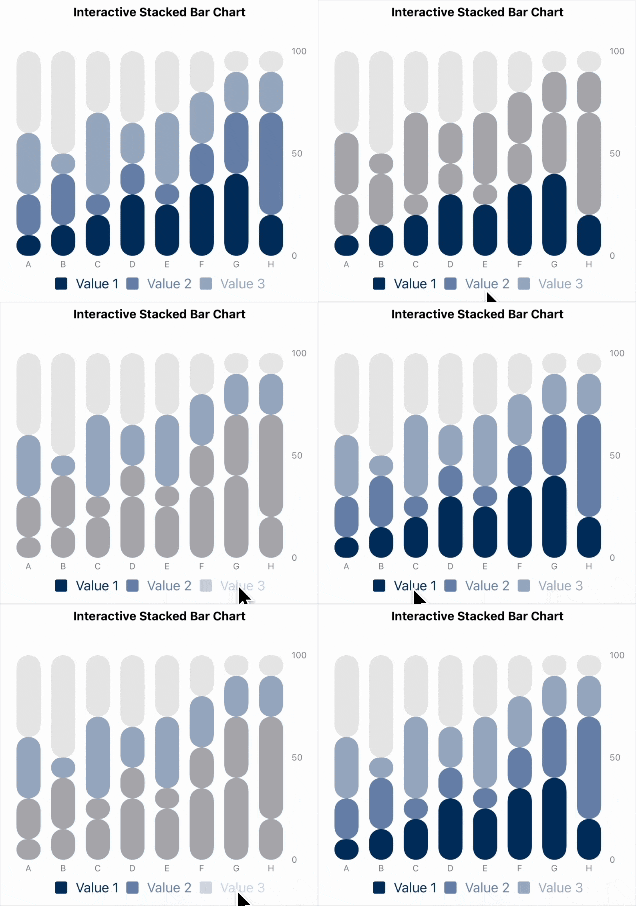
通常時は積み上げ棒グラフを表示し、凡例を押すことによってインタラクティブに積み上げ棒グラフの色が変わるように設定した。コードは下に貼り付けている。適宜データを変える必要があるがそのまま動くと思う。
注意点
角丸がうまく機能しない時がある
角丸は各四角の大きさによって角丸具合が左右される。下記の写真ではFの下から2番目の部分が他の部分と異なった角丸具合になっていることで少し違和感を感じる。データの割合がどれほど偏るかで角丸具合を調整する必要があると思う。

凡例ボタンが押しにくいandわかりにくい
凡例はあくまで凡例なのでうまくボタンの範囲を増やすことができず、押しにくさが残る。凡例の文字の大きさを調整して、できるだけ押すことができるように配慮する必要がある。また、おそらく凡例を押そうと思う人はなかなかいないため、押したくなるようなインターフェースにする必要がある。(影をつけたりするなど、、)
コード
import SwiftUI
import Charts

struct ContentView: View {
    @State private var selectedStacked: String = ""

    var body: some View {
        VStack {
            Spacer()
            Text("Interactive Stacked Bar Chart")
                .font(.subheadline)
                .fontWeight(.bold)
                .padding()

            Chart {
                ForEach(sampleData) { dataPoint in
                    BarMark(
                        x: .value("Category", dataPoint.category),
                        y: .value("Value", dataPoint.value1)
                    )
                    .foregroundStyle((selectedStacked == "" || selectedStacked == "1") ? getColor(for: "Value 1") : Color.gray.opacity(0.7))
                    .clipShape(RoundedRectangle(cornerRadius: 15, style: .continuous))
                    .foregroundStyle(by: .value("Legend", "Value 1"))
                    BarMark(
                        x: .value("Category", dataPoint.category),
                        y: .value("Value", dataPoint.value2)
                    )
                    .foregroundStyle((selectedStacked == "" || selectedStacked == "2") ? getColor(for: "Value 2") : Color.gray.opacity(0.7))
                    .clipShape(RoundedRectangle(cornerRadius: 15, style: .continuous))
                    .foregroundStyle(by: .value("Legend", "Value 2"))

                    BarMark(
                        x: .value("Category", dataPoint.category),
                        y: .value("Value", dataPoint.value3)
                    )
                    .foregroundStyle((selectedStacked == "" || selectedStacked == "3") ? getColor(for: "Value 3") : Color.gray.opacity(0.7))
                    .clipShape(RoundedRectangle(cornerRadius: 15, style: .continuous))
                    .foregroundStyle(by: .value("Legend", "Value 3"))

                    BarMark(
                        x: .value("Category", dataPoint.category),
                        yStart: .value("Start", dataPoint.value1 + dataPoint.value2 + dataPoint.value3),
                        yEnd: .value("End", 100)
                    )
                    .foregroundStyle(.gray.opacity(0.2))
                    .clipShape(RoundedRectangle(cornerRadius: 15, style: .continuous))
                }
            }
            .chartLegend(position: .bottom, alignment: .center, content: {
                HStack {
                    Button(action: {
                        print("push value 1")
                        selectedStacked = "1"
                    }) {
                        Label("Value 1", systemImage: "square.fill")
                            .foregroundStyle(getColor(for: "Value 1"))
                    }
                    Button(action: {
                        print("push value 2")
                        selectedStacked = "2"
                    }){
                        Label("Value 2", systemImage: "square.fill")
                            .foregroundStyle(getColor(for: "Value 2"))
                    }
                    Button(action: {
                        print("push value 3")
                        selectedStacked = "3"
                    }) {
                        Label("Value 3", systemImage: "square.fill")
                            .foregroundStyle(getColor(for: "Value 3"))
                    }
                }
            })
            .chartYAxis {
                AxisMarks(values: [0, 50, 100]) { value in
                    AxisValueLabel {
                        if let intValue = value.as(Int.self) {
                            Text("\(intValue)")
                        }
                    }
                }
            }
            .chartXAxis {
                AxisMarks(position: .bottom) { _ in
                    AxisValueLabel()
                }
            }
            .frame(height: 300)
            .padding()
            Spacer()
        }
        .onTapGesture{
            selectedStacked = ""
        }
    }

    // カテゴリに基づいて色を返す関数
    func getColor(for legend: String) -> Color {
        switch legend {
        case "Value 1":
            return Color(red: 0/255, green: 52/255, blue: 100/255)
        case "Value 2":
            return Color(red: 114/255, green: 140/255, blue: 177/255)
        case "Value 3":
            return Color(red: 160/255, green: 177/255, blue: 198/255)
        default:
            return Color.gray
        }
    }
}

#Preview {
    ContentView()
}

// Sample data structure
struct DataPoint: Identifiable {
    let id = UUID()
    let category: String
    let value1: Double
    let value2: Double
    let value3: Double
}

// Increased sample data
let sampleData: [DataPoint] = [
    DataPoint(category: "A", value1: 10, value2: 20, value3: 30),
    DataPoint(category: "B", value1: 15, value2: 25, value3: 10),
    DataPoint(category: "C", value1: 20, value2: 10, value3: 40),
    DataPoint(category: "D", value1: 30, value2: 15, value3: 20),
    DataPoint(category: "E", value1: 25, value2: 10, value3: 35),
    DataPoint(category: "F", value1: 35, value2: 3, value3: 25),
    DataPoint(category: "G", value1: 40, value2: 30, value3: 20),
    DataPoint(category: "H", value1: 20, value2: 50, value3: 20)
]
