In the previous 2 articles, we detailed the steps on how to build a trading strategy on SmartTrade from scratch, and one using ta-lib and one using our own custom functions. If you have not read it yet, please click here. Below assumes you already know the basics on how to build and run a strategy on SmartTrade.
Today, we would like to show an example implementing a strategy using the statsmodel library instead. Specifically, we will be using the AR model (Autoregressive model).
What is Autoregressive Model?
The concept of the model is that the future price of the stock depends linearly on the one or more of the previous prices plus some unknown, stochastic term. Mathematically:
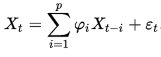
where X is the stock price and p is the number of historical prices and e is the stochastic noise term. From the perspective of trading strategy, if past prices provide confidence in predicting short-term price movements, we will use it for buy and sell signals. For more details about the math and concept of AR model, please visit Wikipedia.
Using AR Model on SmartTrade
Firstly, we import the required library as follow:
from statsmodels.tsa.ar_model import AR
Then in the signal definition, we specify two parameters:
- Order - AR(p) :
This defines how many previous prices (p) to use for the autoregressive model. In our example, we use p = 20 - n-Days Ahead Forecasting :
This defines how many days (n) to forecast ahead using the model. In our example, we use n = 5.
In other words, we will use previous 20 days of prices to forecast next 5 days. We also define other dataframes based on the closing value of the stock price:
  close = data["close_price_adj"].fillna(method='pad')
  pred = pd.DataFrame(data=0,columns=close.columns, index=close.index)
  result = pd.DataFrame(data=0,columns=close.columns, index=close.index)
  P = 20
  N = 5
Next we loop through each symbol and time period and run the AR model as follow:
for (sym,val) in close.items():
        Y = val.values.astype(np.double)
        for i in range(1,len(Y)-P-1):
          train  = Y[i:i+P]
          model = AR(train)
          model_fit = model.fit()
This will generate the fit of the model using a rolling 20-day period of prices for each stock. After that, we create a prediction using the model fit:
          try:
            predictions = model_fit.predict(start=len(train), end=len(train)+N-1, dynamic=False)
The predictions variable is an array of 5 elements containing the predicted prices in the next 5 days. Next, we derive a logic to generate a buy and sell signal. For simplicity, we use this logic:
            pred[sym][i+P-1] = sum(predictions)/N
            if ( sum(predictions)/N > train[P-1]*1.02) :
        	    result[sym][i+P-1] = 1
            elif ( sum(predictions)/N < train[P-1]*.99) :
          	  result[sym][i+P-1] = -1
            	#ctx.logger.debug('predicted=%f' % (predictions[j]))
          except:
            pass

      buy_sig = result[ (result>=1) ]
      sell_sig = result[ (result<=-1) ]
In brief, we initiate a buy signal if the average prediction price is at least 2% greater than the current price. On the other hand, we sell if the average prediction price is at least 1% less than the current price.
Here is an example output comparing the actual vs. predicted prices :
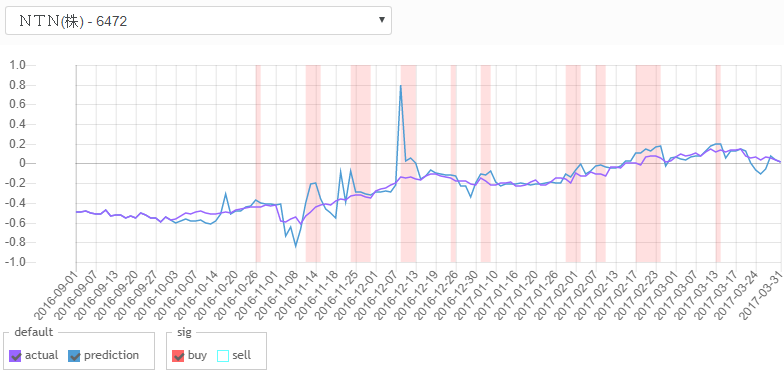
We observe that buy signals are usually initiated during confirmed uptrend, as past prices predict continued up moves in the short-term.
Applying the strategy to 50 stocks, we get the below backtesting results since 2013:
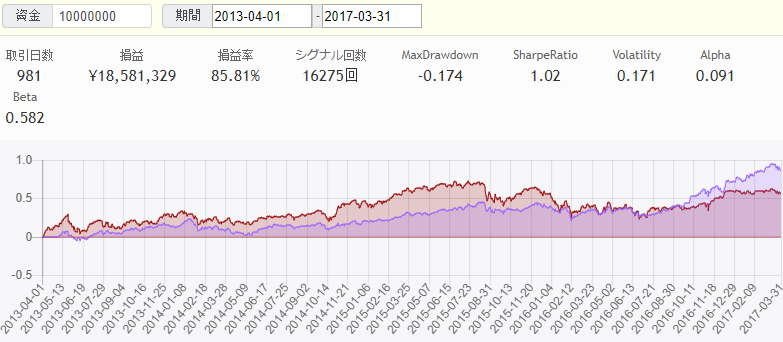
For full code and backtesting results, please visit the strategy on SmartTrade.