概要
Matplotlibを利用してデータを可視化し、画像を出力することは少なくないだろう。その際savefigを使って画像を出力すると若干のメモリリークが起こってしまうようだ。
数百枚~数千枚程度であれば特に問題ないが、かなり大量のデータに対し数万枚~数十万枚の画像を夜通し出力したい場合などに問題になる。
動作環境
Python:3.7.7
Matplotlib:3.2.2
調査
以下のコードを使ってメモリの増加量を調べた。
import os
import numpy as np
import datetime as dt
import matplotlib.pyplot as plt
import psutil

# 計測用データ
memory_start = psutil.virtual_memory().used
time_start = dt.datetime.now()
fw = open('./計測ログ.csv','w')
fw.write('i,time_delta[s],memory[KB]\n')

# 1万枚出力させる
for i in range(10000):
    #適当な2種類のデータを生成
    size = 10000
    x1 = np.random.randn(size)
    y1 = 0.5*x1 + 0.5**0.5*np.random.randn(size)
    x2 = np.random.randn(size)
    y2 = np.random.randn(size)

    #グラフを初期化し散布図を作成
    fig, ax = plt.subplots(figsize=(8,8))
    ax.scatter(x1, y1, alpha=0.1, color='r', label='data1')
    ax.scatter(x2, y2, alpha=0.1, color='g', label='data2')

    #ラベル・凡例をつける
    ax.set_xlabel('X')
    ax.set_ylabel('Y')
    ax.legend(loc='upper right')

    #画像出力
    plt.savefig('./output/{:05}.png'.format(i))

    #グラフデータを解放する※
    #plt.clf()
    #plt.cla()
    plt.close()

    #開始時からのメモリ増加量と1ループの時間を計測
    memory_delta = psutil.virtual_memory().used - memory_start
    time_end = dt.datetime.now()
    time_delta = time_end - time_start
    time_start = time_end
    fw.write('{},{},{}\n'.format(i+1, time_delta.microseconds/1e6, memory_delta/1e3))

fw.close()
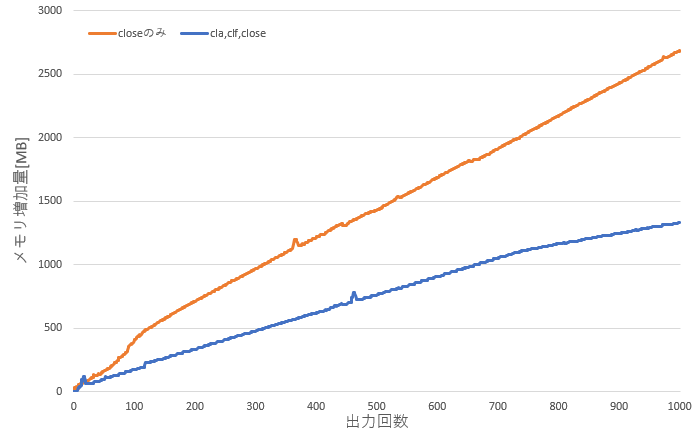
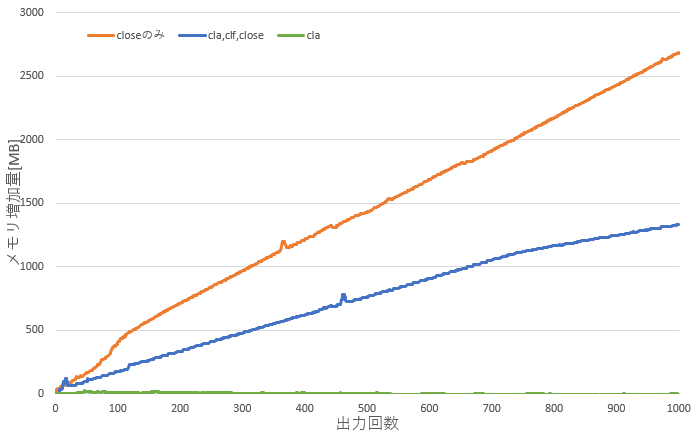
なお、グラフのメモリ解放を行う際、closeのみ行う場合とcla,clfを行ってからcloseした場合で計測した。
closeのみの場合よりもcla,clfを前に行ったほうがメモリの増加量は半分程度に抑えられている。
しかし、どちらの場合でも増加してしまうことが確認できる。
どうする?
何枚画像を出力してもメモリを増加させないためにはどうすればよいか?
いろいろ試した結果以下のようにコードを書き換えることでメモリリークを抑え、
かつきちんと画像の出力を行うことができた。
# 初めに初期化を1回だけ行う
fig, ax = plt.subplots(figsize=(8,8))

for i in range(10000):
    #適当な2種類のデータを生成
    x1 = np.random.randn(size)
    y1 = 0.5*x1 + 0.5**0.5*np.random.randn(size)
    x2 = np.random.randn(size)
    y2 = np.random.randn(size)

    ax.scatter(x1, y1, alpha=0.1, color='r', label='data1')
    ax.scatter(x2, y2, alpha=0.1, color='g', label='data2')

    ax.set_xlabel('X')
    ax.set_ylabel('Y')
    ax.legend(loc='upper right')

    plt.savefig('./output/{:05}.png'.format(i))

    #claのみ行う
    #clf,closeを行ってしまうとその後グラフに書き込めなくなってしまう
    #逆にclaを行わないと前の画像にどんどん重なってしまう
    plt.cla()
画像サイズを途中で変えたい等が無ければおそらくどんなグラフでもこれで対応できるのではないかと思うがあまり確信はないので利用する際はご注意。

