需要予測的なアルゴを数式をいじりつつ少しずつ作ります。
色々な数学を触りつつ脱線しつつ最後は論文になるような物を目指します。
Taylor展開でサインカーブ推定
Teylor展開は以下の式で表されます。
f\left(x\right)=\sum_{n=0}\frac{f^{\left(n\right)}\left(a\right)}{n!}\left(x-a\right)^{n}
上式に$x=a+1$を仮定します。すると、以下の様に成ります。
f\left(a+1\right)=\sum_{n=0}^{\infty}\frac{f^{\left(n\right)}\left(a\right)}{n!}\left(a+1-a\right)^{n}\\=f\left(a\right)+\sum_{n=1}^{\infty}\frac{f^{\left(n\right)}\left(a\right)}{n!}
これである関数$f$に$a$を与えると$a+1$の$f$を得る式になりました。
つまり前の時刻の値が得られると、次の時刻の値を予測するようなものです。
試しにサインカーブを与えます。以下の式に成ります。
\sin\left(a+1\right)=\sin\left(a\right)+\cos\left(a\right)-\frac{\sin\left(a\right)}{2!}-\frac{\cos\left(a\right)}{3!}+\frac{\sin\left(a\right)}{4!}+\cdots
pythonでプロットしてみます。
from numpy import *
from pylab import *
%matplotlib inline

x = arange(100) / 10 * pi
y = sin(x) # 現在


n = 1
z =0 # 予測
for i in range(10):
    if ((i + 2) // 2) % 2:
        op = 1
    else:
        op = -1

    n *= i if  i else 1
    if i % 2:
        z += op * cos(x) / n
    else:
        z += op * sin(x) / n

plot(x, y,"r",label="now");plot(x,z,"b", label="pred");legend();show()
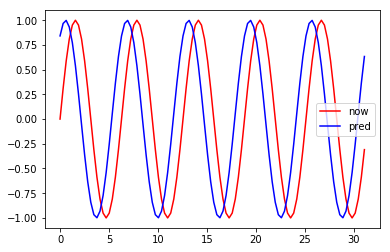
現在(赤:now)の時点で未来(青:pred)を
予測しているので、赤より青が少し左にずれた感じになっています。
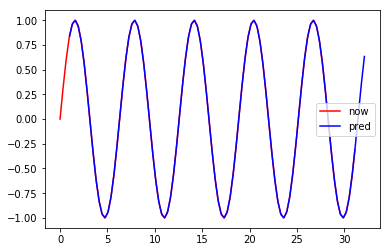
この位相のズレは1なはずなので、1だけ青をずらしてみます。
x2 = arange(100) / 10 * pi + 1 #位相を1ずらす
plot(x, y,"r",label="now");plot(x2,z,"b", label="pred");legend();show()
ぴったり重なりました。予測ができています。
関数形さえ定義できていれば任意の精度(ただし、連続で微分可能なのもに限る)で
予測ができそうです。でも金融データも購買データも事前に関数系が得られていないので
(得られていたらうれしい)、
何らかの予測モデル(数式)を作る必要があります。

