3
5

Delete article

Deleted articles cannot be recovered.

Draft of this article would be also deleted.

Are you sure you want to delete this article?

More than 5 years have passed since last update.

React + chart.jsで「動く」グラフサンプル

Posted at

はじめに

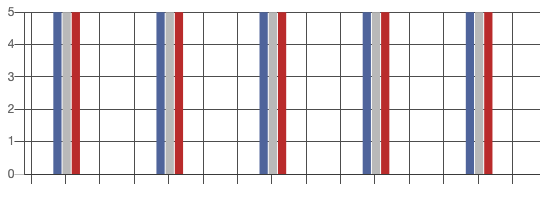
こちらのようなリアルタイムに動いていくグラフを作りたかったのですが、Reactのドキュメントがあまり充実していなかったので色々と調べて動くコードを作ったのでメモしておきます。
(そのままでも動きますがリファクタリングしたほうが良いと思います。)

※blueCount, redCount, whiteCountの値をなにかのタイミングで変えればグラフも変わります。
(Stateを使用して変数の変化を監視する必要がありません)

スクリーンショット 2019-12-18 21.15.17.png

demo.js
import React from 'react'
import { Bar, Chart } from 'react-chartjs-2'
import 'chartjs-plugin-streaming'

let blueCount = 5
let redCount = 5
let whiteCount = 5
let RealTimeChart = (props) => {

  function onRefresh(chart) {
    chart.config.data.datasets.map((dataset) => {
      switch (dataset.label) {
        case 'blue':
          dataset.data.push({
            x: Date.now() - 1,
            y: blueCount,
          })
          return null
        case 'white':
          dataset.data.push({
            x: Date.now(),
            y: whiteCount,
          })
          return null
        case 'red':
          dataset.data.push({
            x: Date.now() + 1,
            y: redCount,
          })
          return null
        default:
          console.log('default')
          return null
      }
    })
  }

  var color = Chart.helpers.color

  return (
    <div>
      <Bar
        height={100}
        data={{
          datasets: [
            {
              label: 'blue',
              stack: 'blue',
              backgroundColor: color('#516897')
                .alpha(1)
                .rgbString(),
              data: [],
            },
            {
              label: 'white',
              stack: 'white',
              backgroundColor: color('#B9B9B9')
                .alpha(1)
                .rgbString(),
              data: [],
            },
            {
              label: 'red',
              stack: 'red',
              backgroundColor: color('#AC3A38')
                .alpha(1)
                .rgbString(),
              data: [],
            },
          ],
        }}
        barSize={100}
        options={{
          responsive: true,
          legend: {
            display: false,
          },

          scales: {
            xAxes: [
              {
                stacked: true,
                type: 'realtime',
                realtime: {
                  duration: 15000,
                  refresh: 3000,
                  delay: 1000,
                  onRefresh: onRefresh,
                },
                gridLines: {
                  color: '#4d4d4d',
                },
                ticks: {
                  display: false,
                },
              },
            ],
            yAxes: [
              {
                stacked: true,
                gridLines: {
                  color: '#4d4d4d',
                },
                ticks: {
                  min: 0,
                  beginAtZero: true,
                  callback: function(value) {
                    if (value % 1 === 0) {
                      return value
                    }
                  },
                },
              },
            ],
          },
        }}
      />
    </div>
  )
}
export default RealTimeChart

3
5
0

Register as a new user and use Qiita more conveniently

  1. You get articles that match your needs
  2. You can efficiently read back useful information
  3. You can use dark theme
What you can do with signing up
3
5

Delete article

Deleted articles cannot be recovered.

Draft of this article would be also deleted.

Are you sure you want to delete this article?