はじめに
最近触る機会少なかったElastic stackが進化して新しくなっていたので最新バージョンの7.8をCentOS7にインストールすることにしました。
KibanaのStack Monitoringを行うまでを目的にインストールしてみます。
環境
CentOS7.8
※インストール初期状態で準備しました
# cat /etc/redhat-release
CentOS Linux release 7.8.2003 (Core)
事前準備
ElasticsearchとlogstashでOpenJDKが必要
事前にJAVAをインストールしておく必要があります。
Elasticsearchでは公式ドキュメントにもあるようにOpenJDKがバンドルされているのでわざわざインストールする必要はないようですがLogstashについてはバンドルされていないため必須です。
Elasticsearchには 、JDKメンテナ(GPLv2 + CE)からのOpenJDKのバンドルバージョンが含まれています。
独自のバージョンのJavaを使用するには、JVMバージョンの要件を参照してください。
ちなみにOpenJDKとは?
OpenJDK(オープンジェイディーケー)とは、プログラミング言語Javaの「Oracle JDK(Java SE)」のオープンソース実装です。
OpenJDKをインストールしよう
# yum install java-1.8.0-openjdk-devel
# java -version
openjdk version "1.8.0_252"
OpenJDK Runtime Environment (build 1.8.0_252-b09)
OpenJDK 64-Bit Server VM (build 25.252-b09, mixed mode)
ElasticStackをインストールしていこう
1. Elasticsearch PGPキーのインストール
# rpm --import https://artifacts.elastic.co/GPG-KEY-elasticsearch
2. リポジトリの登録
ここではあえてリポジトリを有効化してません。
yumでインストールするときはリポジトリを指定します。
勝手にバージョンアップされないようにね!
# vi /etc/yum.repos.d/elasticsearch.repo
[elasticsearch]
name=Elasticsearch repository for 7.x packages
baseurl=https://artifacts.elastic.co/packages/7.x/yum
gpgcheck=1
gpgkey=https://artifacts.elastic.co/GPG-KEY-elasticsearch
enabled=0
autorefresh=1
type=rpm-md
3. インストール
ちゃんとリポジトリを指定しましょう。
# yum install --enablerepo=elasticsearch elasticsearch kibana logstash
4. 最低限の設定
・Elasticsearchのメモリの設定
JAVAで動いているので利用可能なメモリを少し調整します。
メモリに余裕がある場合はしっかりと割り当てましょう。
# vi /etc/elasticsearch/jvm.options

# Xms represents the initial size of total heap space
# Xmx represents the maximum size of total heap space

-Xms2g
-Xmx2g
・Elasticsearchに利用するIPアドレスとシングルノードで動かす設定
とりあえずサーバに割り当てられているIPアドレスにアクセスできるように設定します。
また、シングルノード場合はdiscovery.typeを設定する必要があります。
# vi /etc/elasticsearch/elasticsearch.yml

# Set the bind address to a specific IP (IPv4 or IPv6):
#
# network.host: 192.168.0.1
network.host: 0.0.0.0 ← 追加

discovery.type: single-node ← 追加
・Kibanaに利用するIPアドレスの設定
Elasticsearch同様にサーバに割り当てられているIPアドレスにアクセスできるよう設定します。
# vi /etc/kibana/kibana.yml

# server.host: "localhost"
server.host: "0.0.0.0" ← 追加

# The URL of the Elasticsearch instance to use for all your queries.
# elasticsearch.url: "http://localhost:9200"
※サーバIPを固定する場合はここも変更してください。
5. ファイアウォールの設定
それぞれで利用するポートを開放していきます。
Kibana: 5601
elasticsearch: 9200
logstash: 9600
# firewall-cmd --add-port=5601/tcp --zone=public --permanent
# firewall-cmd --add-port=9200/tcp --zone=public --permanent
# firewall-cmd --add-port=9600/tcp --zone=public --permanent
# firewall-cmd --reload
6. 起動と自動起動の設定
systemctl daemon-reload
systemctl restart elasticsearch kibana logstash
systemctl enable elasticsearch kibana logstash
7. アクセス確認
・Elasticsearchアクセス確認
# curl http://localhost:9200
{
  "name" : "localhost.localdomain",
  "cluster_name" : "elasticsearch",
  "cluster_uuid" : "iWGd48WKTMSKHG2Bq-tVSQ",
  "version" : {
    "number" : "7.8.0",
    "build_flavor" : "default",
    "build_type" : "rpm",
    "build_hash" : "757314695644ea9a1dc2fecd26d1a43856725e65",
    "build_date" : "2020-06-14T19:35:50.234439Z",
    "build_snapshot" : false,
    "lucene_version" : "8.5.1",
    "minimum_wire_compatibility_version" : "6.8.0",
    "minimum_index_compatibility_version" : "6.0.0-beta1"
  },
  "tagline" : "You Know, for Search"
}
・Kibanaアクセス確認
http://サーバのIPアドレス:5601
8. KibanaのダッシュボードでStack Monitoringしたいよね!!(Metricbeat)
公式ドキュメントを見ると最新のMonitoringはMetricbeatを使ったものみたいなのでMetricbeatを使ったMonitoringをやっていきます。
8-1. インストール
同じくElasticsearchのリポジトリを有効にしてインストールしていきます。
# yum install --enablerepo=elasticsearch metricbeat
8-2. モジュールの有効化
Metricbeatのモジュールにそれぞれのxpackのモジュールがあるのでそれを有効化していきます。
metricbeat modules enable elasticsearch-xpack
metricbeat modules enable kibana-xpack
metricbeat modules enable logstash-xpack
8-3. モジュールの設定
各設定は下記の通りです。
サーバのIPアドレスを指定している場合はlocalhostではアクセスできないので、各設定のhostsにIPアドレスを設定してください。
また、セキュリティ機能の認証を実装している場合はユーザ、パスワードの設定も必要です。
ちなみに公式ドキュメントにはいろんなオプションがあるようです。
# cat /etc/metricbeat/modules.d/elasticsearch-xpack.yml
========================================
# Module: elasticsearch
# Docs: https://www.elastic.co/guide/en/beats/metricbeat/7.8/metricbeat-module-elasticsearch.html

- module: elasticsearch
  xpack.enabled: true
  period: 10s
  hosts: ["http://localhost:9200"]
  #username: "user"
  #password: "secret"
========================================

# cat /etc/metricbeat/modules.d/kibana-xpack.yml
========================================
# Module: kibana
# Docs: https://www.elastic.co/guide/en/beats/metricbeat/7.8/metricbeat-module-kibana.html

- module: kibana
  xpack.enabled: true
  period: 10s
  hosts: ["localhost:5601"]
  #basepath: ""
  #username: "user"
  #password: "secret"
========================================

# cat /etc/metricbeat/modules.d/logstash-xpack.yml
========================================
# Module: logstash
# Docs: https://www.elastic.co/guide/en/beats/metricbeat/7.8/metricbeat-module-logstash.html

- module: logstash
  xpack.enabled: true
  period: 10s
  hosts: ["localhost:9600"]
  #username: "user"
  #password: "secret"
========================================
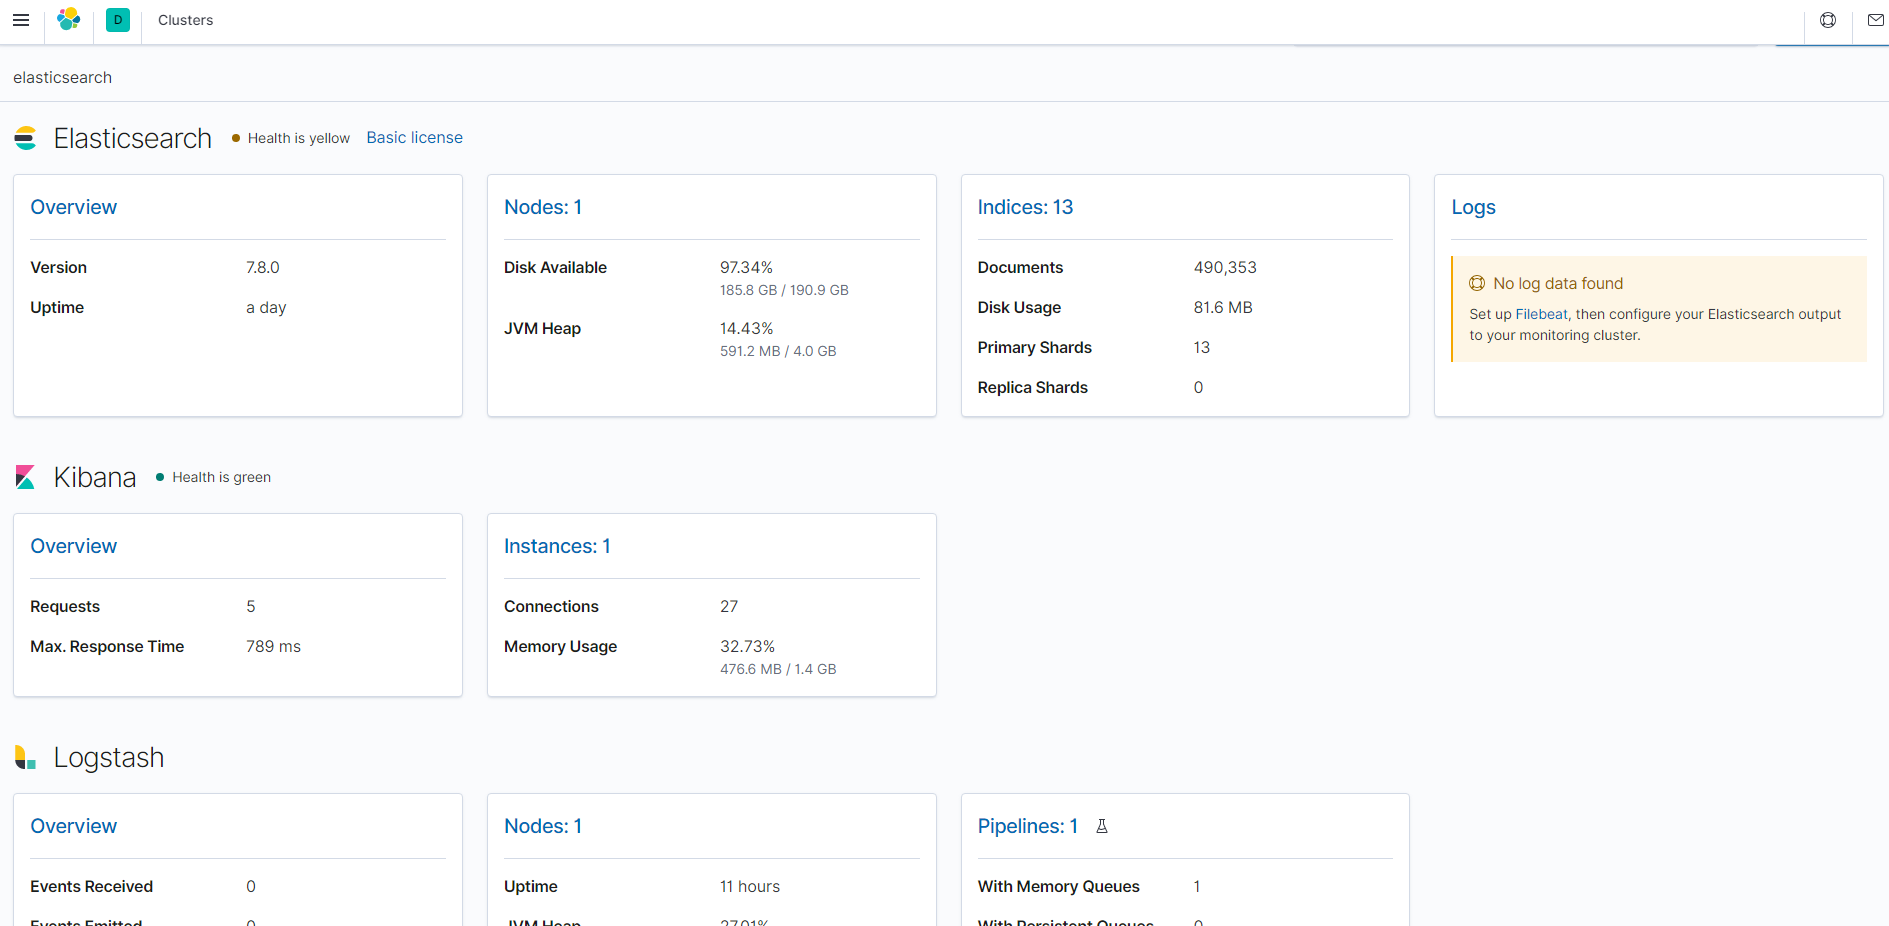
8-4. Metricbeatの再起動して確認!
準備はできました。
ただし、Logstashはなにかしらモジュールが実行されていないと表示されないみたいです。
# systemctl restart metricbeat
# systemctl enable metricbeat
無事表示されました!!
9. ElasticsearchのLogも表示できるといいなあ(Filebeat)
Monitoringを見て思ったんですけど、
ElasticsearcのLogが表示できるみたい。これも見たいよね!!
公式ドキュメントを見てやってみました。
9-1. インストール
とりあえずインストールしなければ始まらない!!
同じくElasticsearchのリポジトリを有効にしてインストールしていきます。
# yum install --enablerepo=elasticsearch filebeat
9-2. filebeatの設定
今回はlocalhostでもアクセスできるので設定は不要そうだけど、hostなどの設定が必要です。
# vi /etc/filebeat/filebeat.yml
========================================
# =================================== Kibana ===================================

# Starting with Beats version 6.0.0, the dashboards are loaded via the Kibana API.
# This requires a Kibana endpoint configuration.
setup.kibana:

  # Kibana Host
  # Scheme and port can be left out and will be set to the default (http and 5601)
  # In case you specify and additional path, the scheme is required: http://localhost:5601/path
  # IPv6 addresses should always be defined as: https://[2001:db8::1]:5601
  #host: "localhost:5601"

# ---------------------------- Elasticsearch Output ----------------------------
output.elasticsearch:
  # Array of hosts to connect to.
  hosts: ["localhost:9200"]
========================================
9-3. モジュールの有効化
同じようにFilebeatにもモジュールがあるので、Elasticsearchのモジュールを有効化していきます。
セットアップは少しだけ長いです。「Loading of config files completed.」が表示されればOKです。
# filebeat modules enable elasticsearch
# filebeat setup -e
9-4. Filebeatの再起動して確認!
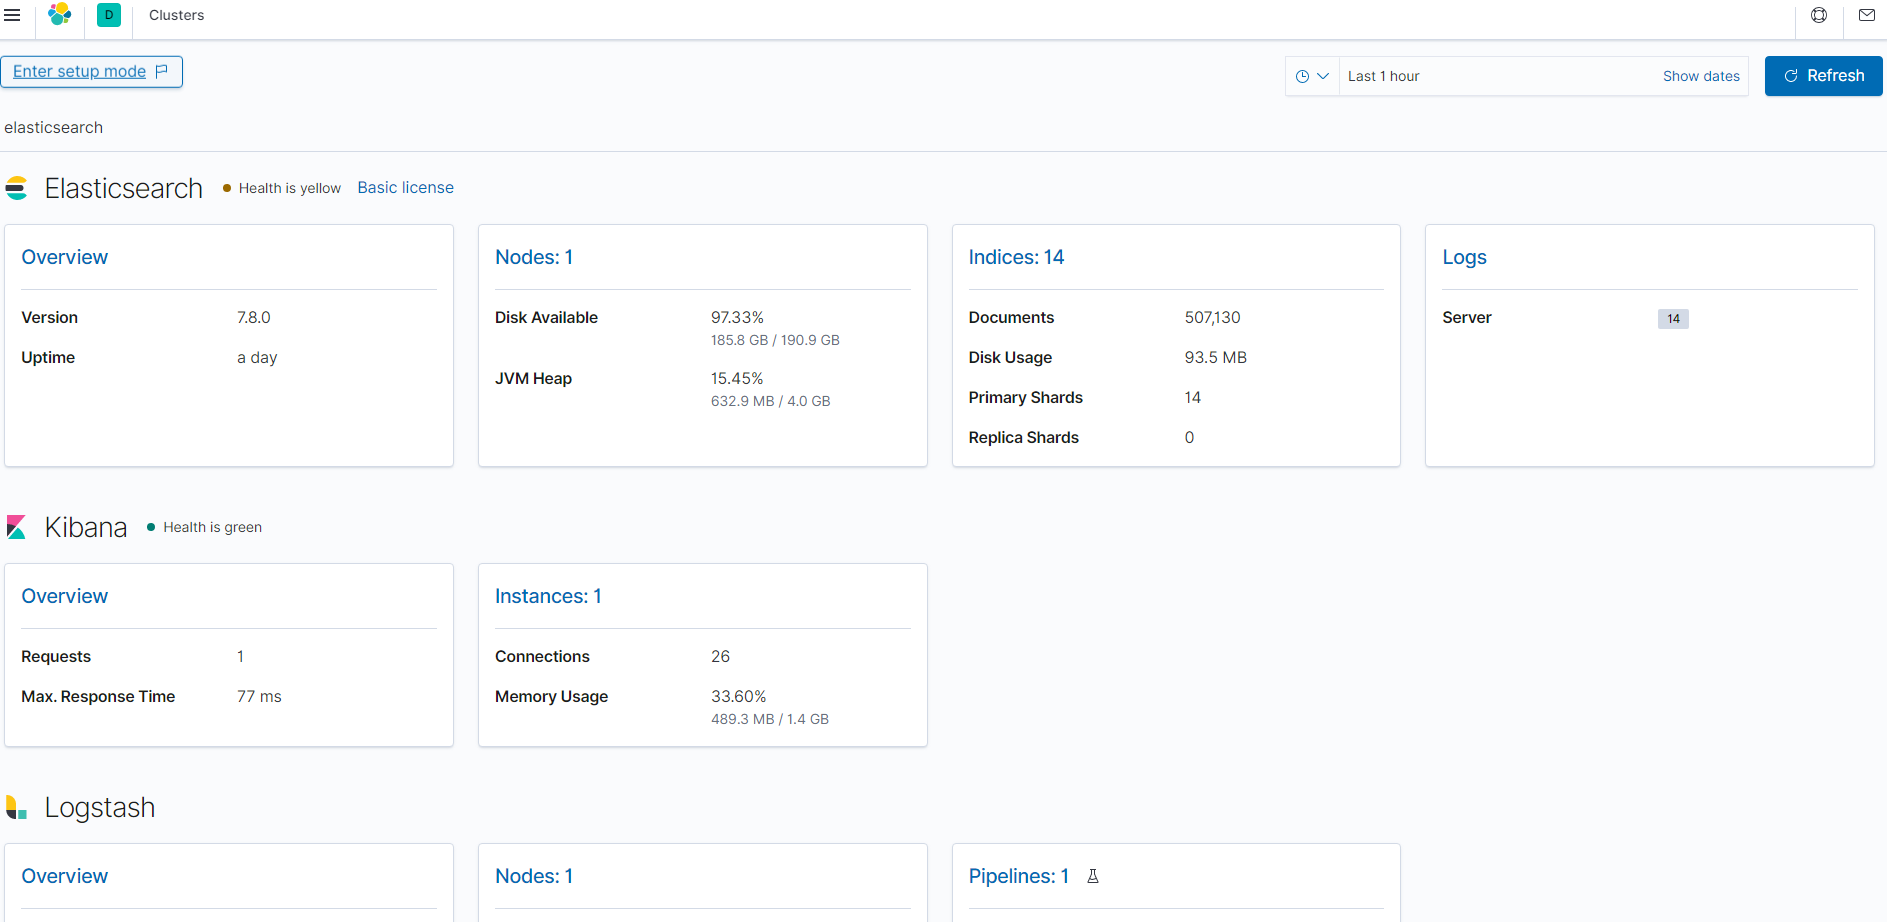
これでいいはず。再起動をしてダッシューボードを確認します。
# systemctl restart filebeat
# systemctl enable filebeat
無事表示されました。
中身を見てみるとこんな感じでログが確認できました。
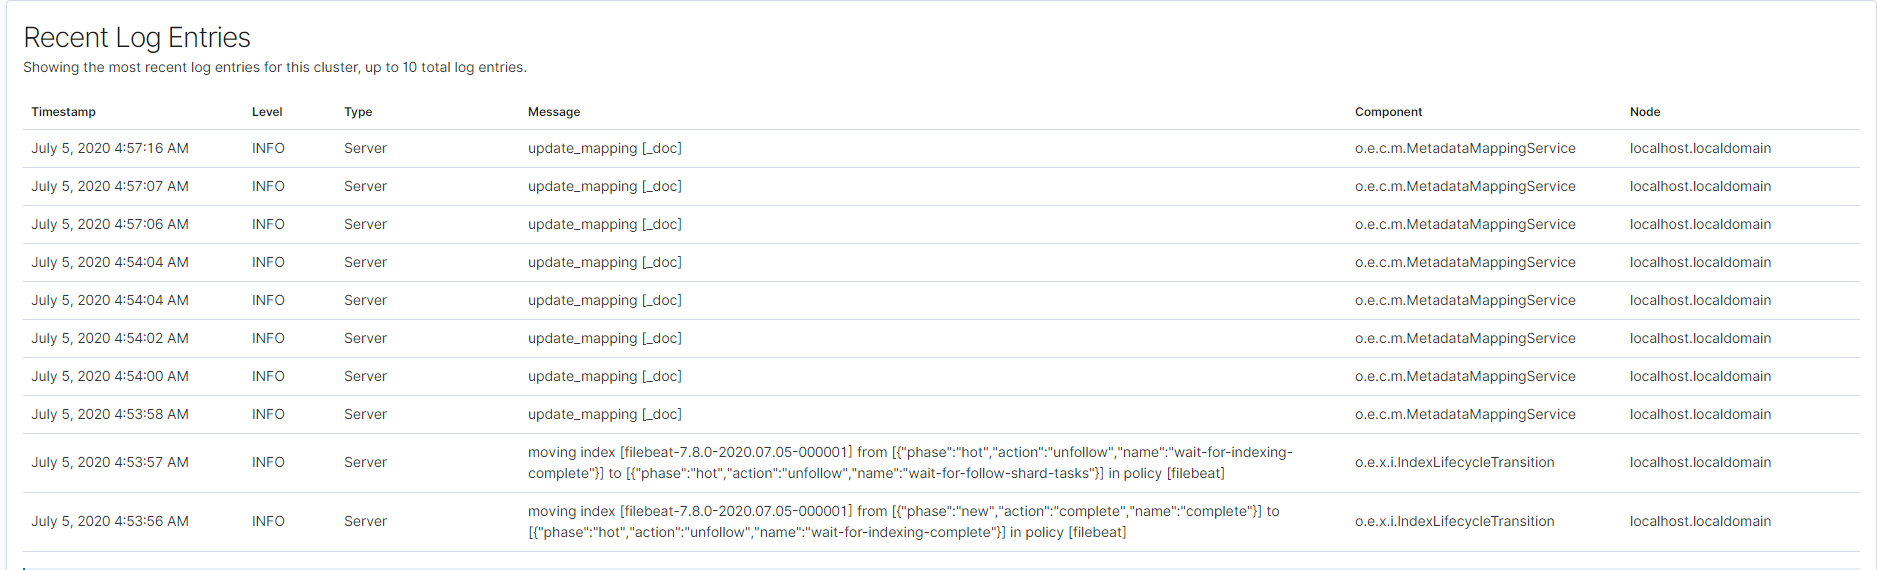
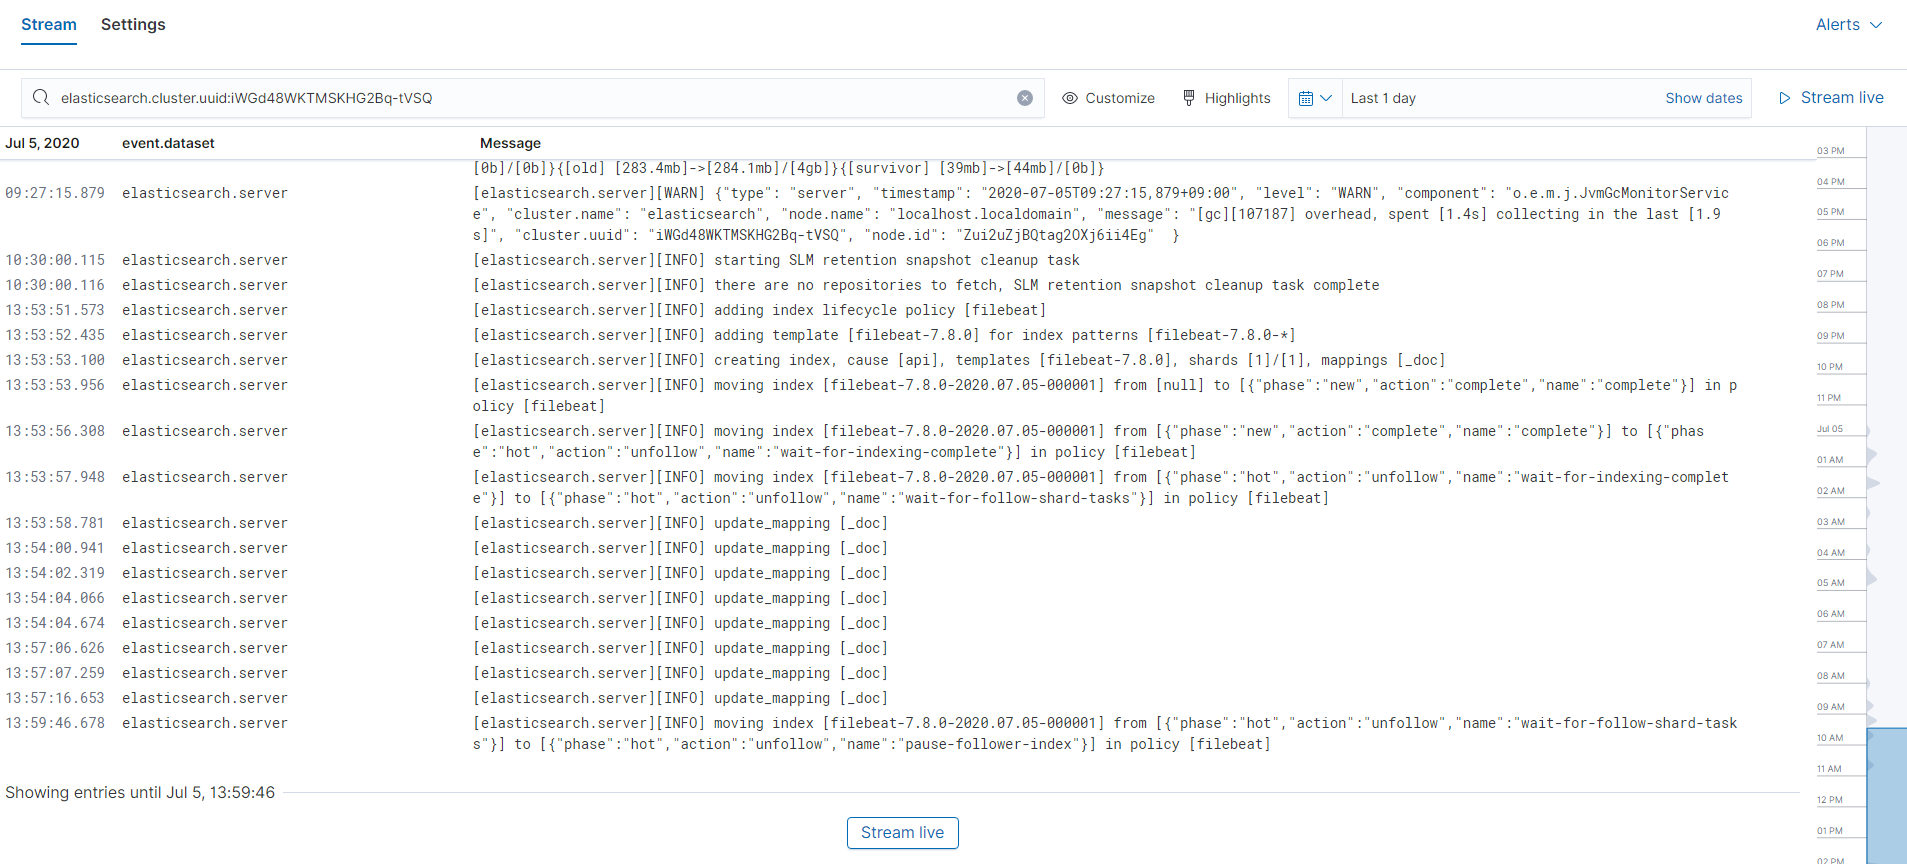
チューニングもしやすく便利になりました。
とりあえずこんな感じで初期セットアップは完了です。
これでElasticstackを存分に楽しめます!!!!!