2024.5.25追記:このライブラリは別プロジェクトに引き継ぎましたので、こちらをご利用ください
https://github.com/usop4/elegantt/
似たようなのは探せばいくらでもありますが、こういうやつです。
import genGanttChart

gchart = GanttChart( (720, 320),(255,255,255) )
gchart.draw_calendar()
gchart.draw_campain("2019-10-15","2019-10-18","こんにちは")
gchart.draw_campain("2019-10-20","2019-10-23","こんにちは")
gchart.draw_campain("2019-10-24","2019-10-30","こんにちは")
gchart.draw_campain("2019-10-28","2019-10-30","こんにちは")
gchart.draw_campain("2019-10-29","2019-10-30","こんにちは")
gchart.show()
gchart.save("test.png")

ポイント還元ポータルpokanpoという、キャッシュレスのポイント還元の開始時期と終了時期が見やすいサイトを作ろうと思って書き始めました。サイトのデザインに合わせて、こんな感じで色やサイズなども調整できます。
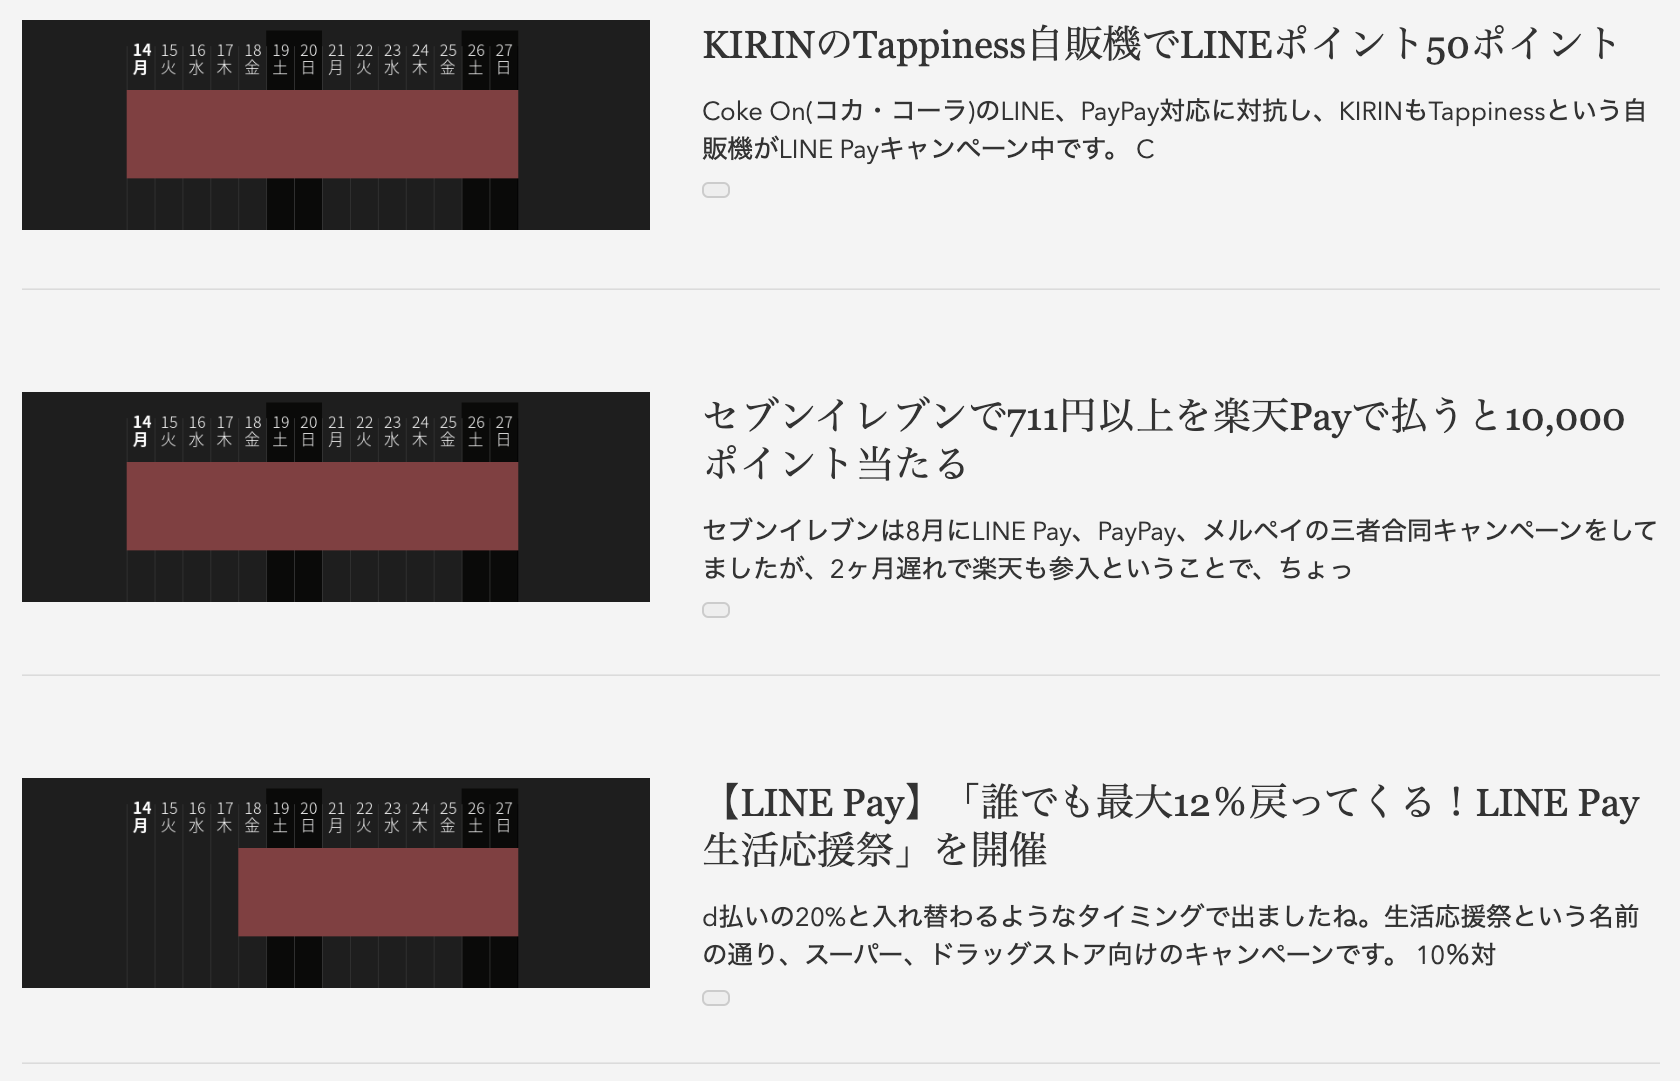
PythonのPillowというライブラリとNoto Sansというフォントを使ってます。
詳しくはGithubで。
2024.5.25追記:このライブラリは別プロジェクトに引き継ぎましたので、こちらをご利用ください