前提
(前回と同じ)
ここにExcelファイルがある。
とあるDBから出力されたもので、1行1レコード、一つのフィールドには文章が格納されている。
また、各行には日付情報のフィールドもある。
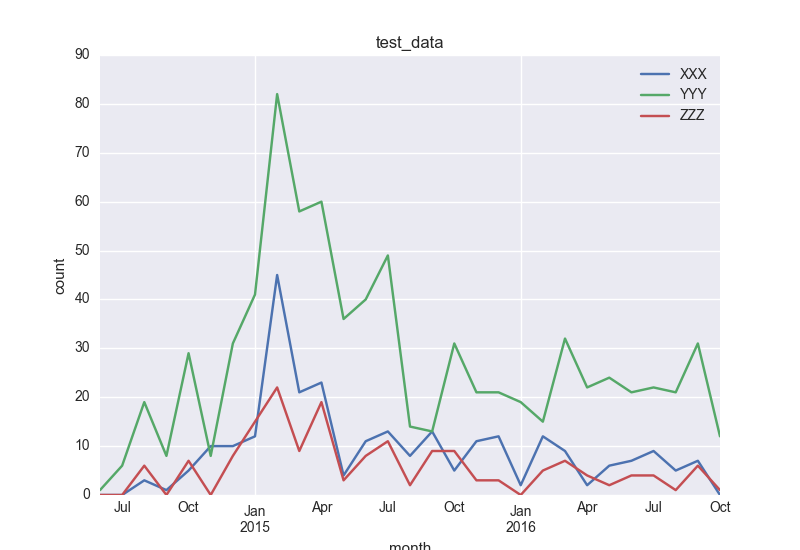
今回のお題は、このフィールド内の文章内から指定されたキーワードを抜き出し、月ごとに出現回数がどのように変化しているかをプロットしてみよう、というもの。
入口と出口はWindowsのExcelファイルで、中間はMacで行う。
文字コード変換や、Excel変換等は前回と同じなので省略。
準備
pd.read()によりcsvを読み込んだものをdfとする。
要MeCab
def group_by_month(df):
    e = df['comment']   #文章のあるフィールドを指定
    e.index = pd.to_datetime(df['datetime'])    # 日付情報をindexに指定する
    m = MeCab.Tagger('-Ochasen')    # 出力をChasenモードにする

    result_df = None
    for k, v in e.iteritems():
        if type(v) != unicode:
            continue
        target_dic = {      # 対象となるキーワードを指定する
            'XXX'           : 0,
            'YYY'           : 0,
            'ZZZ'           : 0,
        }
        s8 = v.encode('utf-8')
        node = m.parseToNode(s8)
        while node:
            word=node.feature.split(',')[0]
            key = node.surface
            if key in target_dic:
                target_dic[key] += 1    # 見つかればカウントを増やす
            node = node.next
        if result_df is None:
            result_df = pd.DataFrame(target_dic, index=[k])
        else:
            result_df = result_df.append(pd.DataFrame(target_dic, index=[k]))
    # 月ごとにgrouping
    result_df['index1'] = result_df.index
    result_df = result_df.groupby(pd.Grouper(key='index1', freq='M')).sum()
    # indexでは動かないぽいのでcolumnに入れる
    return result_df
毎回dictionaryを空にして出現回数を数え、DataFrameに変換して加える、ということをしている。
もっとシンプルにできそうな気がするが、やり方がわからない。
この時点でresult_dfには下記のようなデータが入る。
            XXX YYY ZZZ
index1
2014-06-30   0   1   0
2014-07-31   0   6   0
2014-08-31   3  19   6
2014-09-30   1   8   0
2014-10-31   5  29   7
2014-11-30  10   8   0
2014-12-31  10  31   8
2015-01-31  12  41  15
2015-02-28  45  82  22
2015-03-31  21  58   9
2015-04-30  23  60  19
2015-05-31   4  36   3
2015-06-30  11  40   8
2015-07-31  13  49  11
2015-08-31   8  14   2
2015-09-30  13  13   9
2015-10-31   5  31   9
2015-11-30  11  21   3
2015-12-31  12  21   3
2016-01-31   2  19   0
2016-02-29  12  15   5
2016-03-31   9  32   7
2016-04-30   2  22   4
2016-05-31   6  24   2
2016-06-30   7  21   4
2016-07-31   9  22   4
2016-08-31   5  21   1
2016-09-30   7  31   6
2016-10-31   0  12   1
プロット
'''
    グラフ領域を準備する
'''
def plot_init(title):
    fig = plt.figure()
    ax = fig.add_subplot(1,1,1)
    ax.set_title(title)
    return fig, ax

'''
    プロットする
'''
def plot_count_of_day(df):
    title = 'test_data'
    fig, ax = plot_init(title)
    for c in df.columns:
        df[c].plot(label=c, ax=ax)
    ax.legend()
    ax.set(xlabel='month', ylabel='count')
結果
こんな感じ。
おわり。
