matplotlib.pyplot.subplots_adjustの概要
Pythonの描画library matplotlib.pyplotには余白などを設定するmatplotlib.pyplot.subplots_adjustがあります.
matplotlib.pyplot.subplots_adjust(left=None, bottom=None, right=None, top=None, wspace=None, hspace=None)
公式documentから取ってきたものですが, parameterは以下のように0~1までの実数値を設定します.
left = 0.125  # the left side of the subplots of the figure
right = 0.9   # the right side of the subplots of the figure
bottom = 0.1  # the bottom of the subplots of the figure
top = 0.9     # the top of the subplots of the figure
wspace = 0.2  # the amount of width reserved for space between subplots,
              # expressed as a fraction of the average axis width
hspace = 0.2  # the amount of height reserved for space between subplots,
              # expressed as a fraction of the average axis height
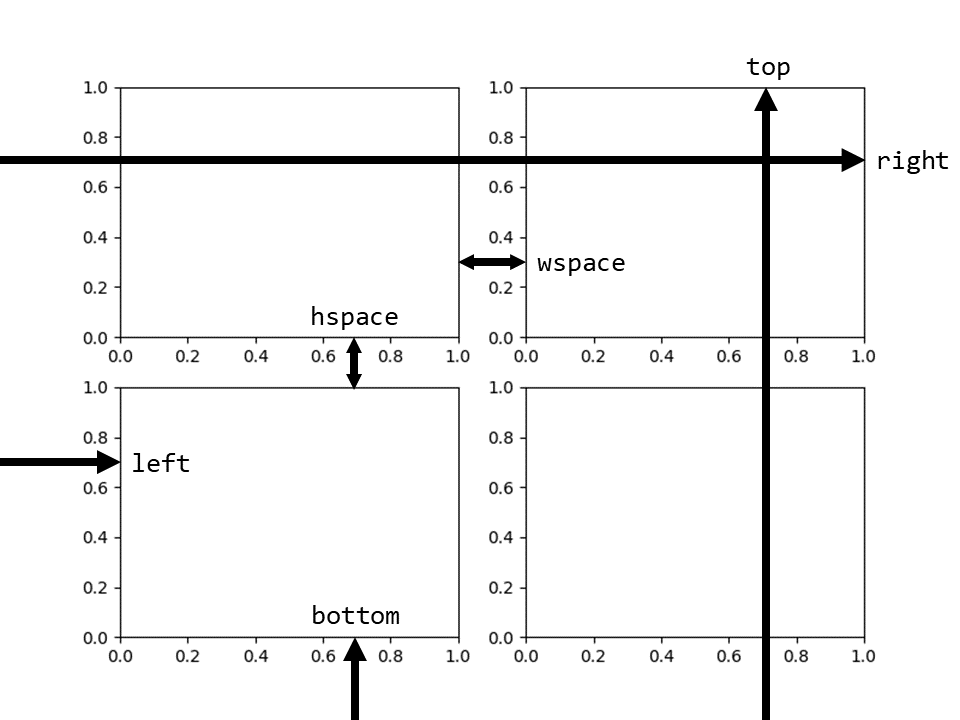
指定する場所を図示すると以下のようになります.
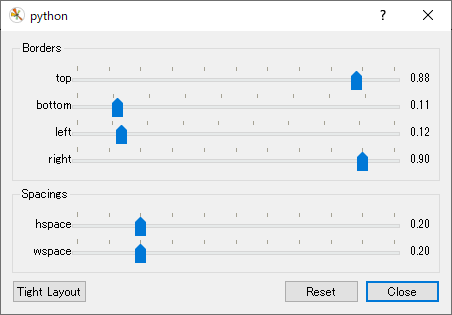
ちなみにこれらの値はmatplotlib.pyplot.show()で表示されるGUIから1
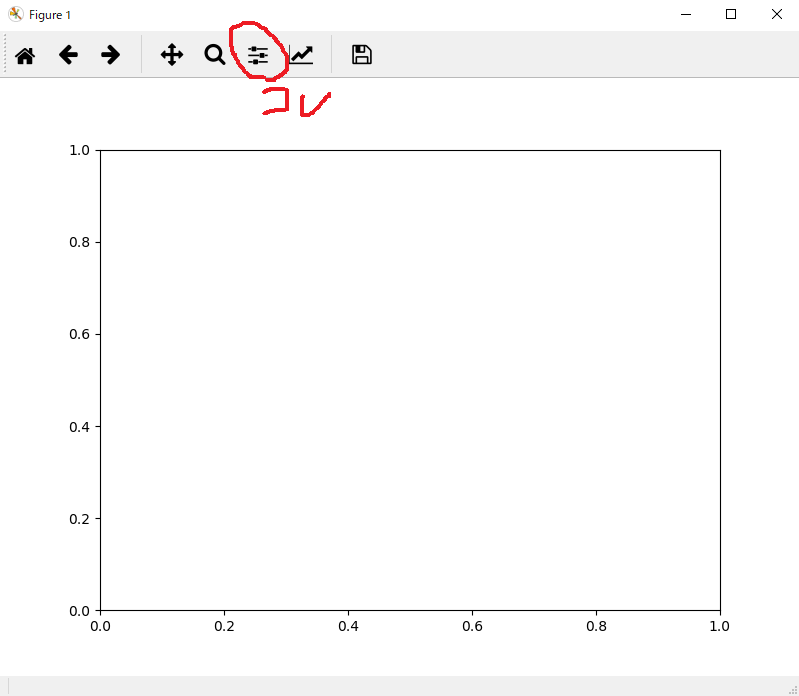
を押すと以下のようにinteractiveに調節できます.
もう1つちなみにrcParamsの設定を触って変更することも可能です
matplotlib.pyplot.rcParams["figure.subplot.left"] = 0.125
matplotlib.pyplot.rcParams["figure.subplot.right"] = 0.9
matplotlib.pyplot.rcParams["figure.subplot.bottom"] = 0.1
matplotlib.pyplot.rcParams["figure.subplot.top"] =  0.9
matplotlib.pyplot.rcParams["figure.subplot.wspace"] = 0.2
matplotlib.pyplot.rcParams["figure.subplot.hspace"] = 0.2
ハマったこと
大したことではないのですが, wspaceとhspaceの値の意味が他のparameterとは違ったという話です.
left, right, bottom, topは左下から測った全体の図の大きさの割合0~1で指定するのですがwspaceとhspaceはそうではなかったことでハマりました.
公式documentをさっさと見ていればよかったのですが
wspace = 0.2  # the amount of width reserved for space between subplots,
              # expressed as a fraction of the average axis width
hspace = 0.2  # the amount of height reserved for space between subplots,
              # expressed as a fraction of the average axis height
の
# expressed as a fraction of the average axis width
の部分です.
つまりgraphの横(縦)幅の平均値(普通は全部同じなので単にgraphの横(縦)幅)のw(h)space倍間隔を空けますよという意味になります2.