この記事は確率的プログラミング言語 Advent Calendar 202317日目の記事です。
ゼミで勉強したStanとRでベイズ統計モデリング(通称:アヒル本)著者である @hankagosa 氏の開催するアドベントカレンダーに参加でき嬉しく思います。このような機会を用意していただきありがとうございます。
それでは本題に入ります。
はじめに
2023/4/6にPyMC-Marketingが発表されました。PyMCの派生ライブラリでマーケティング領域に特化しています。
PyMC Labs is excited to announce the initial release of PyMC-Marketing. Unlock the power of marketing analytics with PyMC-Marketing – the open source solution for smarter decision-making.
ちなみにPyMC-MarketingではMMMの他にLTV(CLV)やBTYD(Buy Till You Die)を扱うことのできる機能があり,BTYDを扱うLifetimesの後継プロジェクトとしてローンチされたという背景もあるようです。
👋 This codebase has moved to "maintenance-mode". I won't be adding new features, improvements, or even answering issues in this codebase (but perhaps the occasional bug fix). Why? I don't use lifetimes anymore, nor do I keep up with the literature around RFM.
A project has emerged as a successor to lifetimes, PyMC-Lab/PyMC-Marketing, please check it out!
今回はこのPyMC-Marketingの使い方の紹介とベイジアンMMMの紹介を行いたいと思います。Example Notebookを参考に,PyMC-Marketingを使ってMMMを実装してみます。
「ドキュメントを写経して,試してみたり解釈しました」という記事で,「特定の問題解決をしたもの」や,「MMMについてクリティカルかつ明瞭な解説を行なったもの」ではなく,冗長な表現が多いかと思われます。
もしこの記事の内容について疑問に思われたり,もっと洗練された解説を確認されたい方はもともとのexample notebookをご確認よろしくお願いします。
同時に,記事の中で間違っている点などがございましたらご指摘いただけるとありがたいです。
Marketing Mix Modeling(MMM)とは?
Marketing Mix Modeling(MMM)は、マーケティング戦略の効果を評価し、最適化するための統計的なアプローチです。MMMは、企業が製品やサービスを市場に導入する際に、どのような要因がその成功に影響を与えるかを理解するのに役立ちます。
データを見る前に,以下の状況を想定します。
- 週次で集計された売上データを持っている
- テレビ,ラジオ,オンライン広告などの広告手段を二つ持っている(x1,x2とする)
- 以下のことを仮定する
- 売上に正のトレンドをもっていること
- 年間で季節性をもつこと
-
2019-05-13と2021-09-14の売上に外れ値が存在すること
このような条件下で,私たちは売上を最大化させるような広告費の配分を考えなければなりません。
ここでのポイントは,「広告費の投資額と売上の関係が直線的ではない」ことです。これは以下の事柄により説明されます。
- carryover effect:広告支出による売上への影響は即時で消えるものではなく,残存すること
- saturation effect:広告効果はずっと直線的に増えるのではなく,逓減していつかは頭打ちになること
PyMC-Marketingでは,Jin, Yuxue, et al. “Bayesian methods for media mix modeling with carryover and shape effects.” (2017).に基づいたAPIが提供されています。以下のような形でモデリングされています。
$$
y_{t} = \alpha + \sum_{m=1}^{M}\beta_{m}f(x_{m, t}) + \sum_{c=1}^{C}\gamma_{c}z_{c, t} + \varepsilon_{t}
$$
基本的には以下の変数が想定されています。
$y_t$: 売上,コンバージョン数
$x_{m,t}$: 費用,インプレッション数,クリック数
$z_{c,t}$: イベント効果
$\alpha$は定数項,関数$f$はさきほど紹介したcarryover effectやsaturation effectなどメディアに関する変換,$\epsilon_t$は誤差を表します。
そのほか季節性やトレンドをモデルに組み込むことができます。
Part1: データについて
パッケージインストール
import warnings

import arviz as az
import matplotlib.pyplot as plt
import numpy as np
import pandas as pd
import pymc as pm
import seaborn as sns

from pymc_marketing.mmm.transformers import geometric_adstock, logistic_saturation
from pymc_marketing.mmm.delayed_saturated_mmm import DelayedSaturatedMMM

warnings.filterwarnings("ignore")

az.style.use("arviz-darkgrid")
plt.rcParams["figure.figsize"] = [12, 7]
plt.rcParams["figure.dpi"] = 100

%load_ext autoreload
%autoreload 2
%config InlineBackend.figure_format = "retina"
ダミーデータの読み込み
データを確認(作成)していきましょう。まずは日時データです。
seed: int = sum(map(ord, "mmm"))
rng: np.random.Generator = np.random.default_rng(seed=seed)

# date range
min_date = pd.to_datetime("2018-04-01")
max_date = pd.to_datetime("2021-09-01")

df = pd.DataFrame(
    data={"date_week": pd.date_range(start=min_date, end=max_date, freq="W-MON")}
).assign(
    year=lambda x: x["date_week"].dt.year,
    month=lambda x: x["date_week"].dt.month,
    # dayofyear: 1-365
    dayofyear=lambda x: x["date_week"].dt.dayofyear,
)

n = df.shape[0]
print(f"Number of observations: {n}")
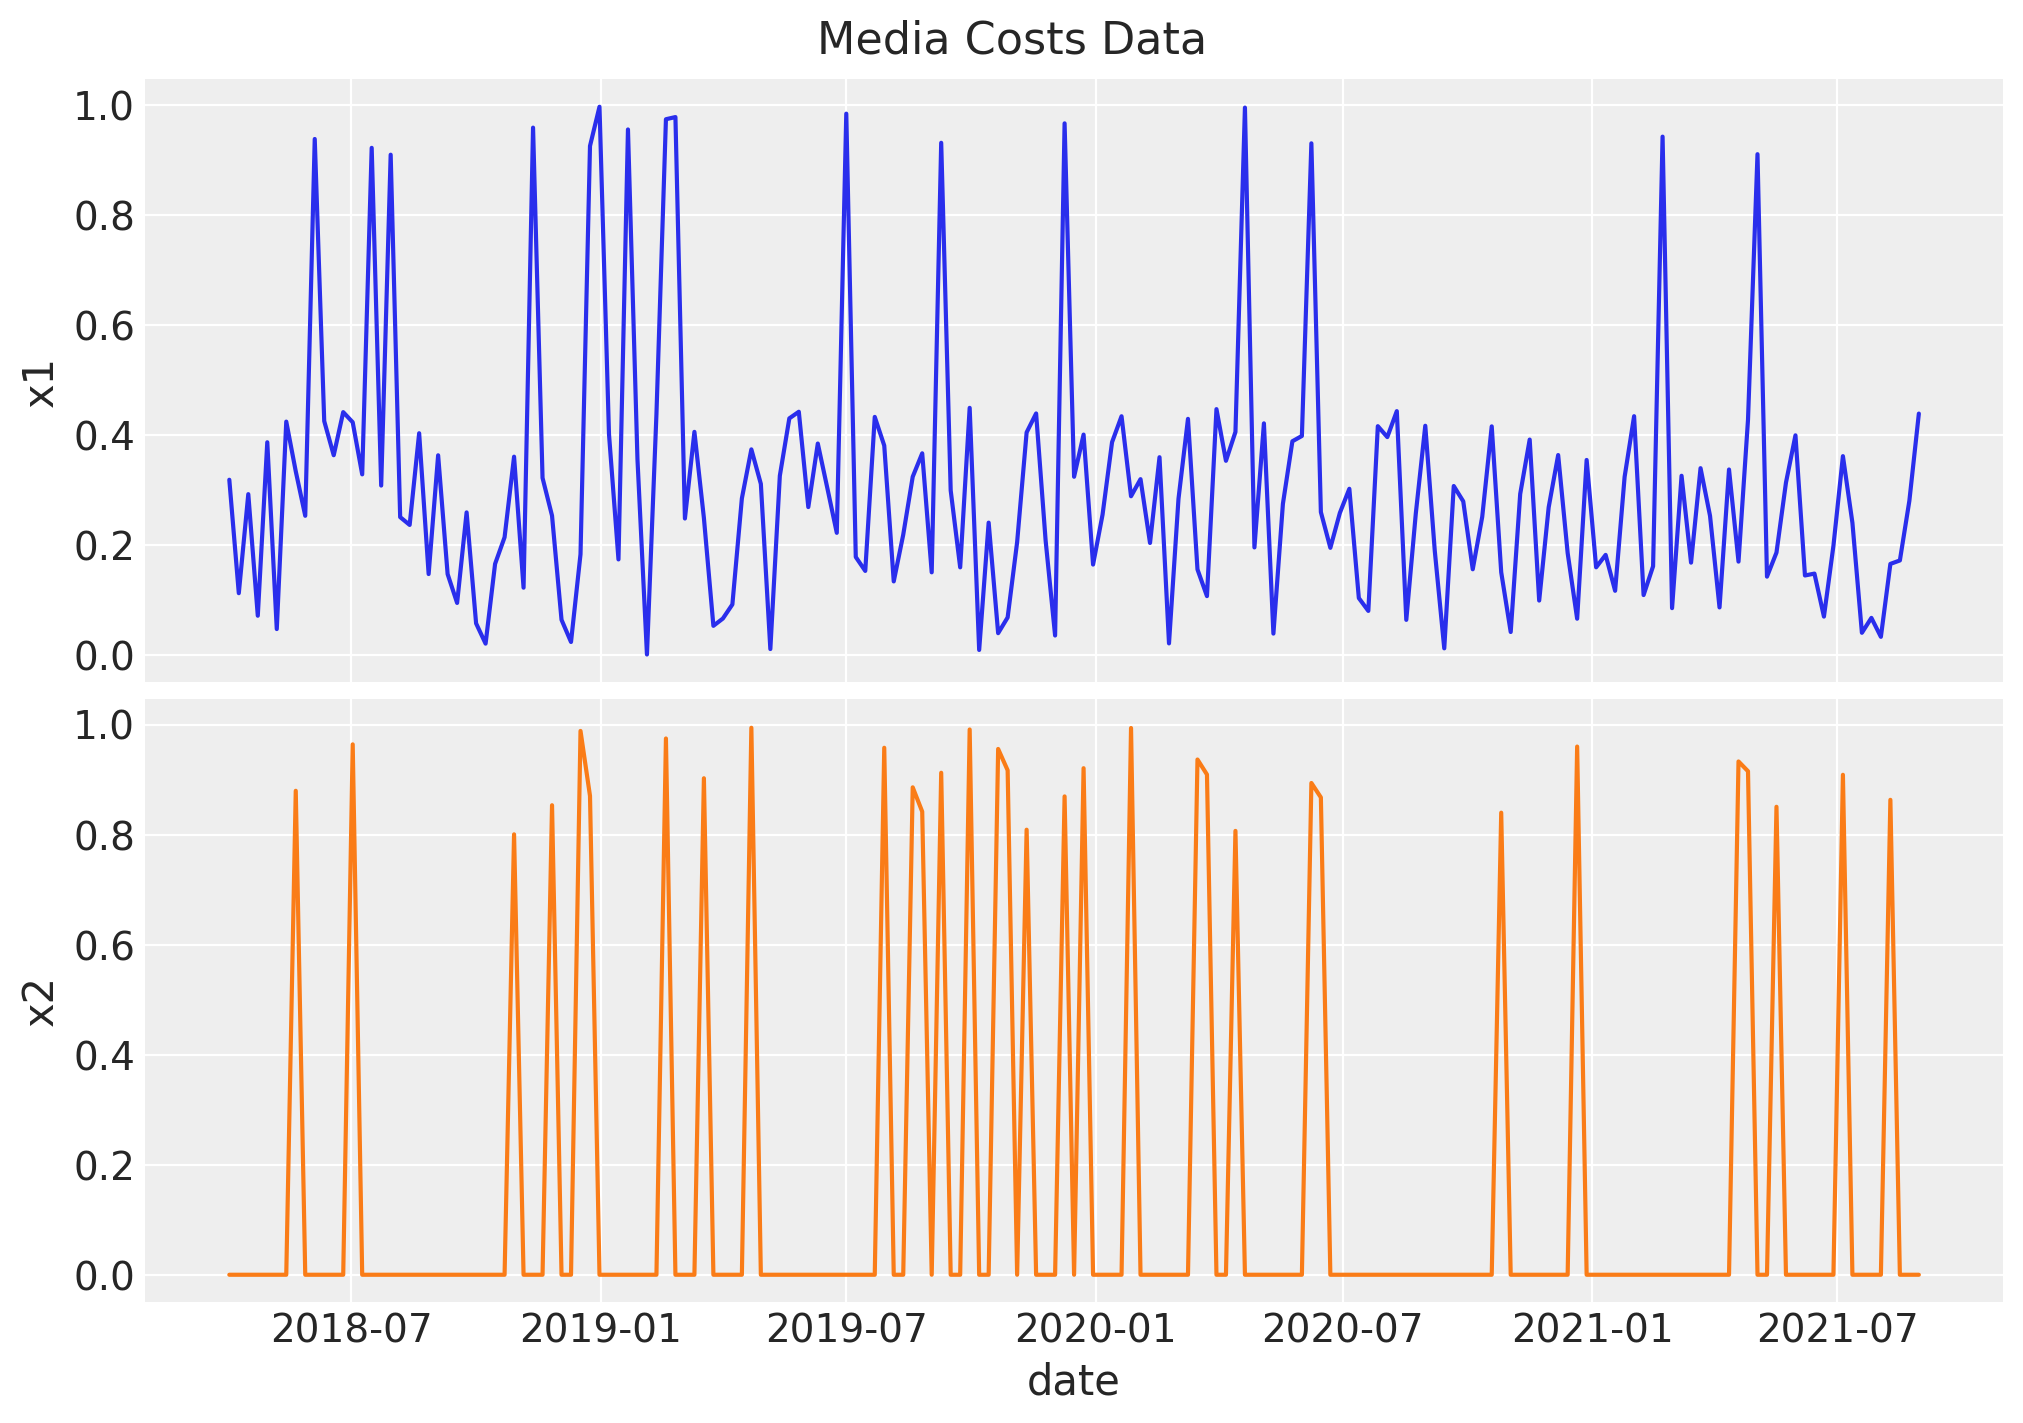
次はメディアに関する変数$x$の作成です。今回は一様乱数から作成します。ちなみに$x_1$はSNS広告,$x_2$はTVCMなどが想定されているようです。
# media data
x1 = rng.uniform(low=0.0, high=1.0, size=n)
# x1 > 0.9ならx1, そうでなければx1/2
df["x1"] = np.where(x1 > 0.9, x1, x1 / 2)

x2 = rng.uniform(low=0.0, high=1.0, size=n)
# x2 > 0.8ならx2, そうでなければ0
df["x2"] = np.where(x2 > 0.8, x2, 0)

fig, ax = plt.subplots(
    nrows=2, ncols=1, figsize=(10, 7), sharex=True, sharey=True, layout="constrained"
)
sns.lineplot(x="date_week", y="x1", data=df, color="C0", ax=ax[0])
sns.lineplot(x="date_week", y="x2", data=df, color="C1", ax=ax[1])
ax[1].set(xlabel="date")
fig.suptitle("Media Costs Data", fontsize=16);
次にさきほど作成した$x$に対して,carryover effectとsaturation effectの適用を順番に行なっていきます。carryover effectのパラメータは$x_1$と$x_2$でそれぞれ0.4, 0.2と設定しています。
これら二つの効果は目的変数を作成するときに利用します。実際にMMMを運用する際は$\alpha_1$や$\alpha_2$は推定するものになります。
# apply geometric adstock transformation
alpha1: float = 0.4
alpha2: float = 0.2

df["x1_adstock"] = (
    geometric_adstock(x=df["x1"].to_numpy(), alpha=alpha1, l_max=8, normalize=True)
    .eval()
    .flatten()
)

df["x2_adstock"] = (
    geometric_adstock(x=df["x2"].to_numpy(), alpha=alpha2, l_max=8, normalize=True)
    .eval()
    .flatten()
)
carryover effectは adstock effectとも呼ばれ,広告効果が残存することを表現しています。
以下のコードでdf['x1_adstock'][0]を計算することができます。
x_ = df['x1'].to_numpy()[0]
w = alpha**0 / (sum([alpha1**i for i in range(8)]))

x_*w
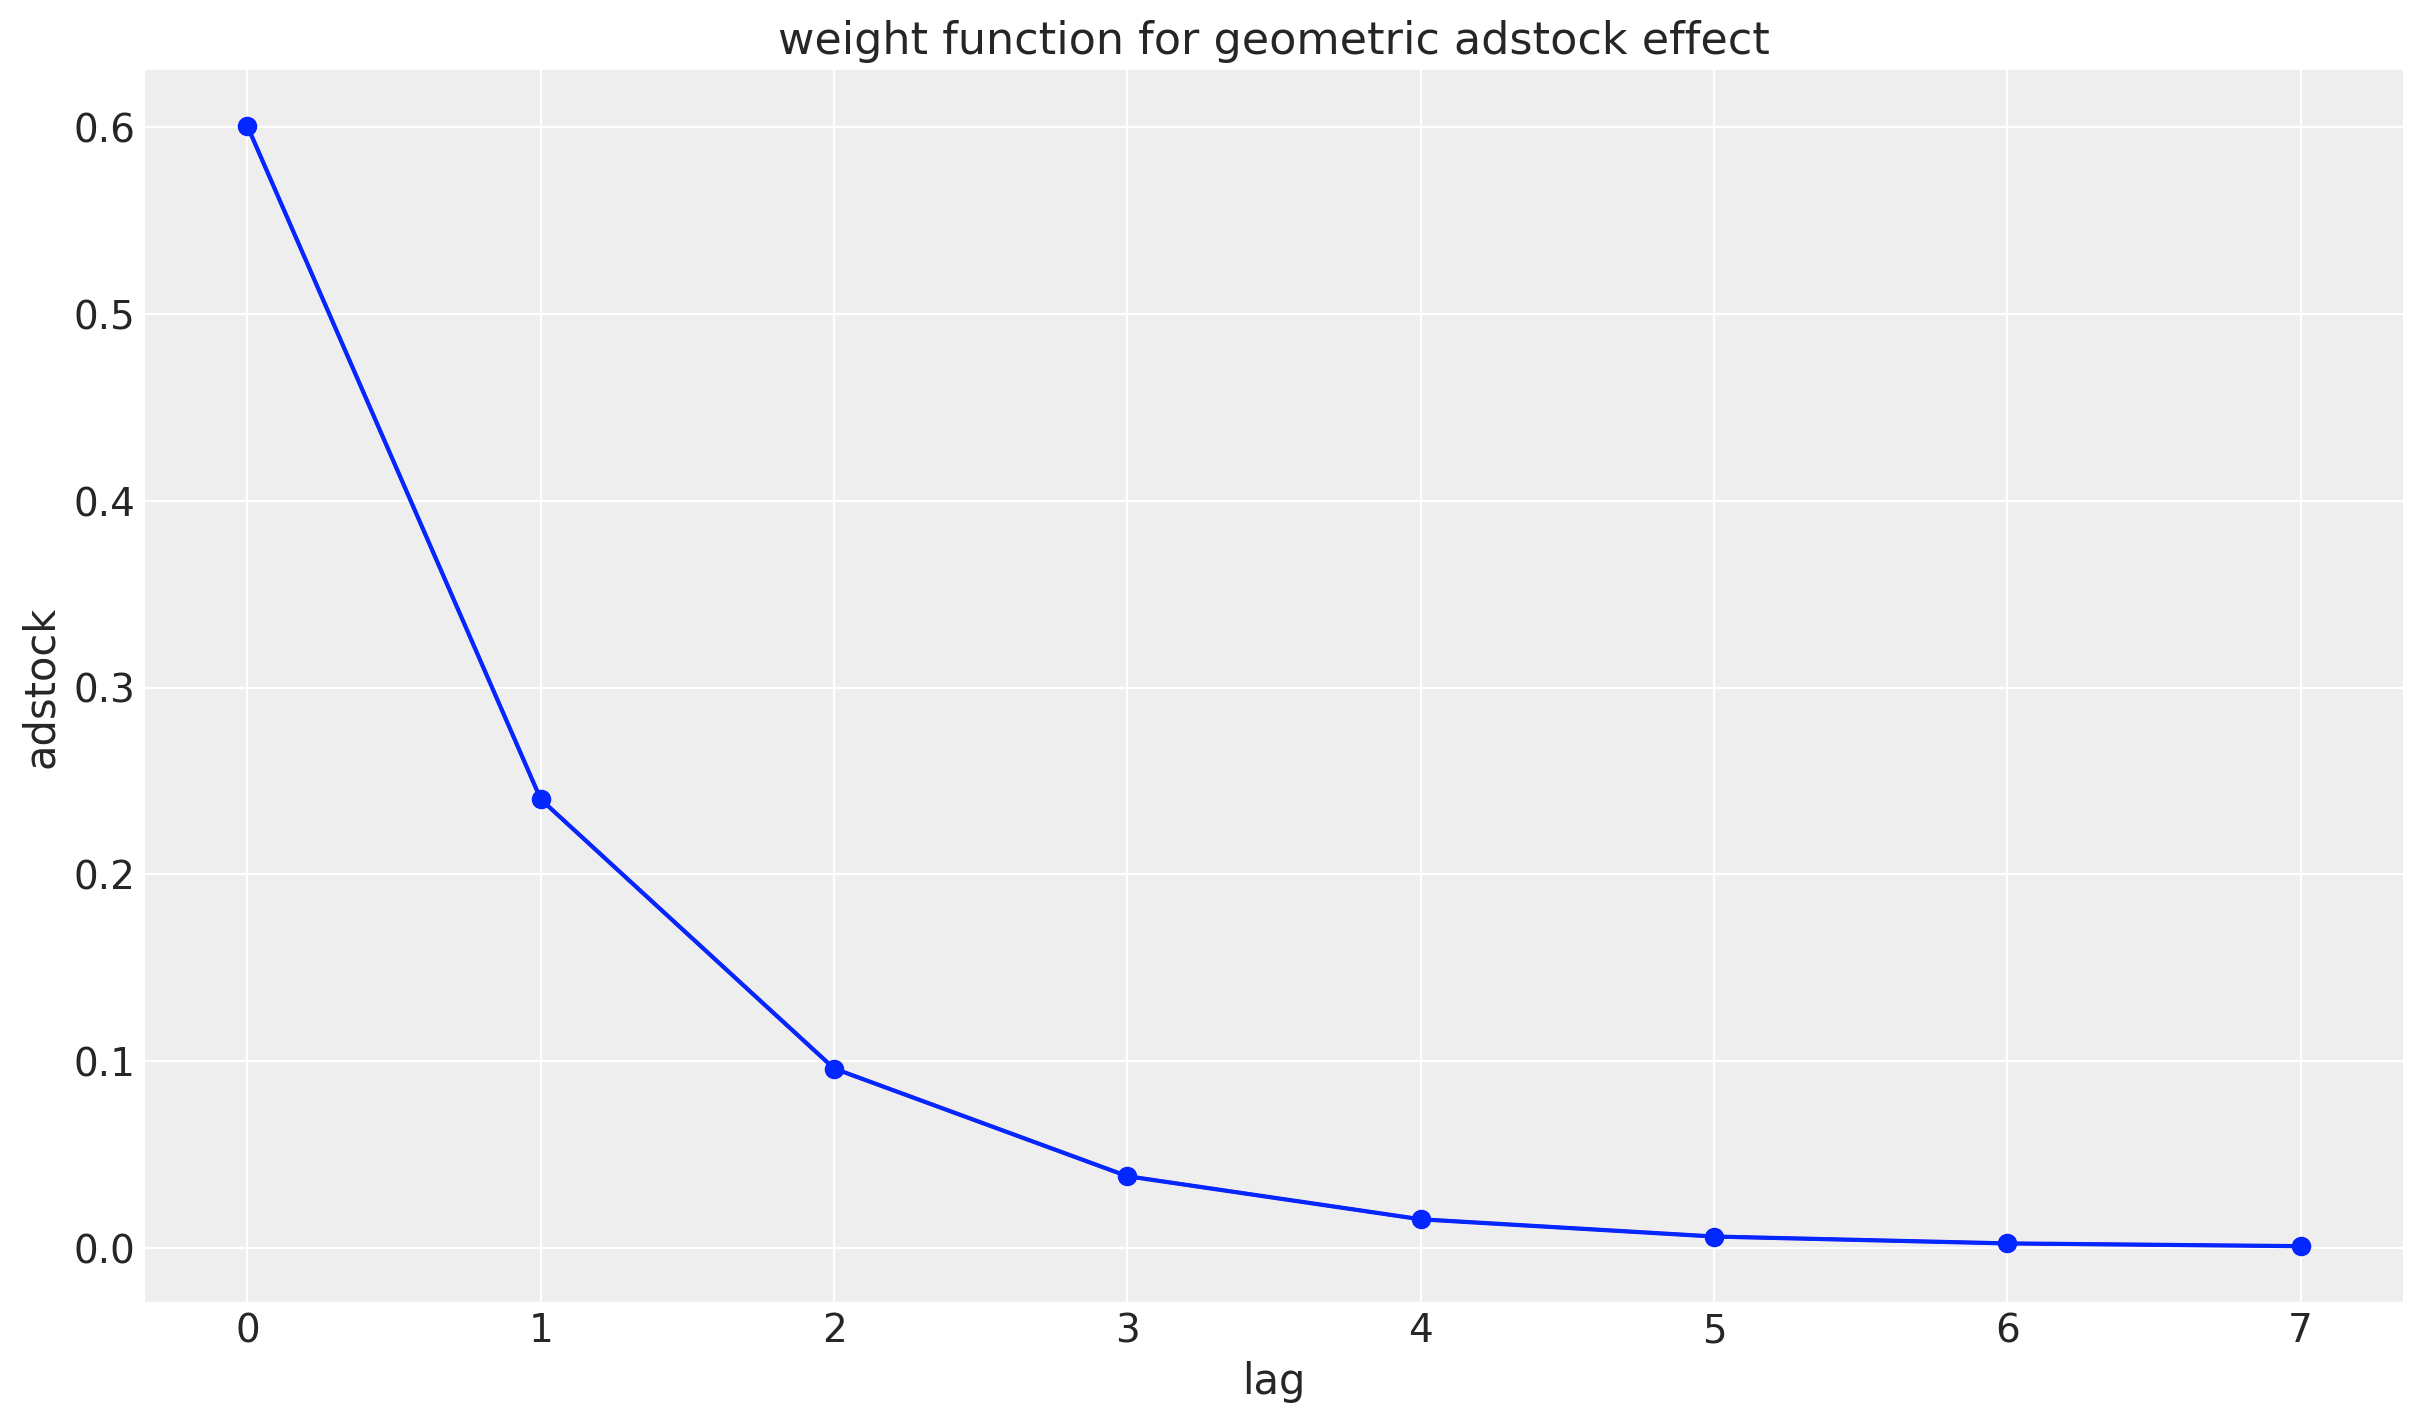
geometric adstock effectの重みは以下の関数で表現されています。この図は元の論文のFigure1に相当しています。
$$
w_{1}^{g}(l;\alpha_{m})=\alpha_{1}^{l}=0.4^{l}
$$
lag = np.arange(0, 8)
adstock = (0.4) ** (lag)/sum((0.4) ** ((lag)))

plt.plot(lag, adstock, marker='o', linestyle='-', color='b')
plt.xlabel('lag')
plt.ylabel('adstock')
plt.title('weight function for geometric adstock effect')
plt.grid(True)
plt.show()
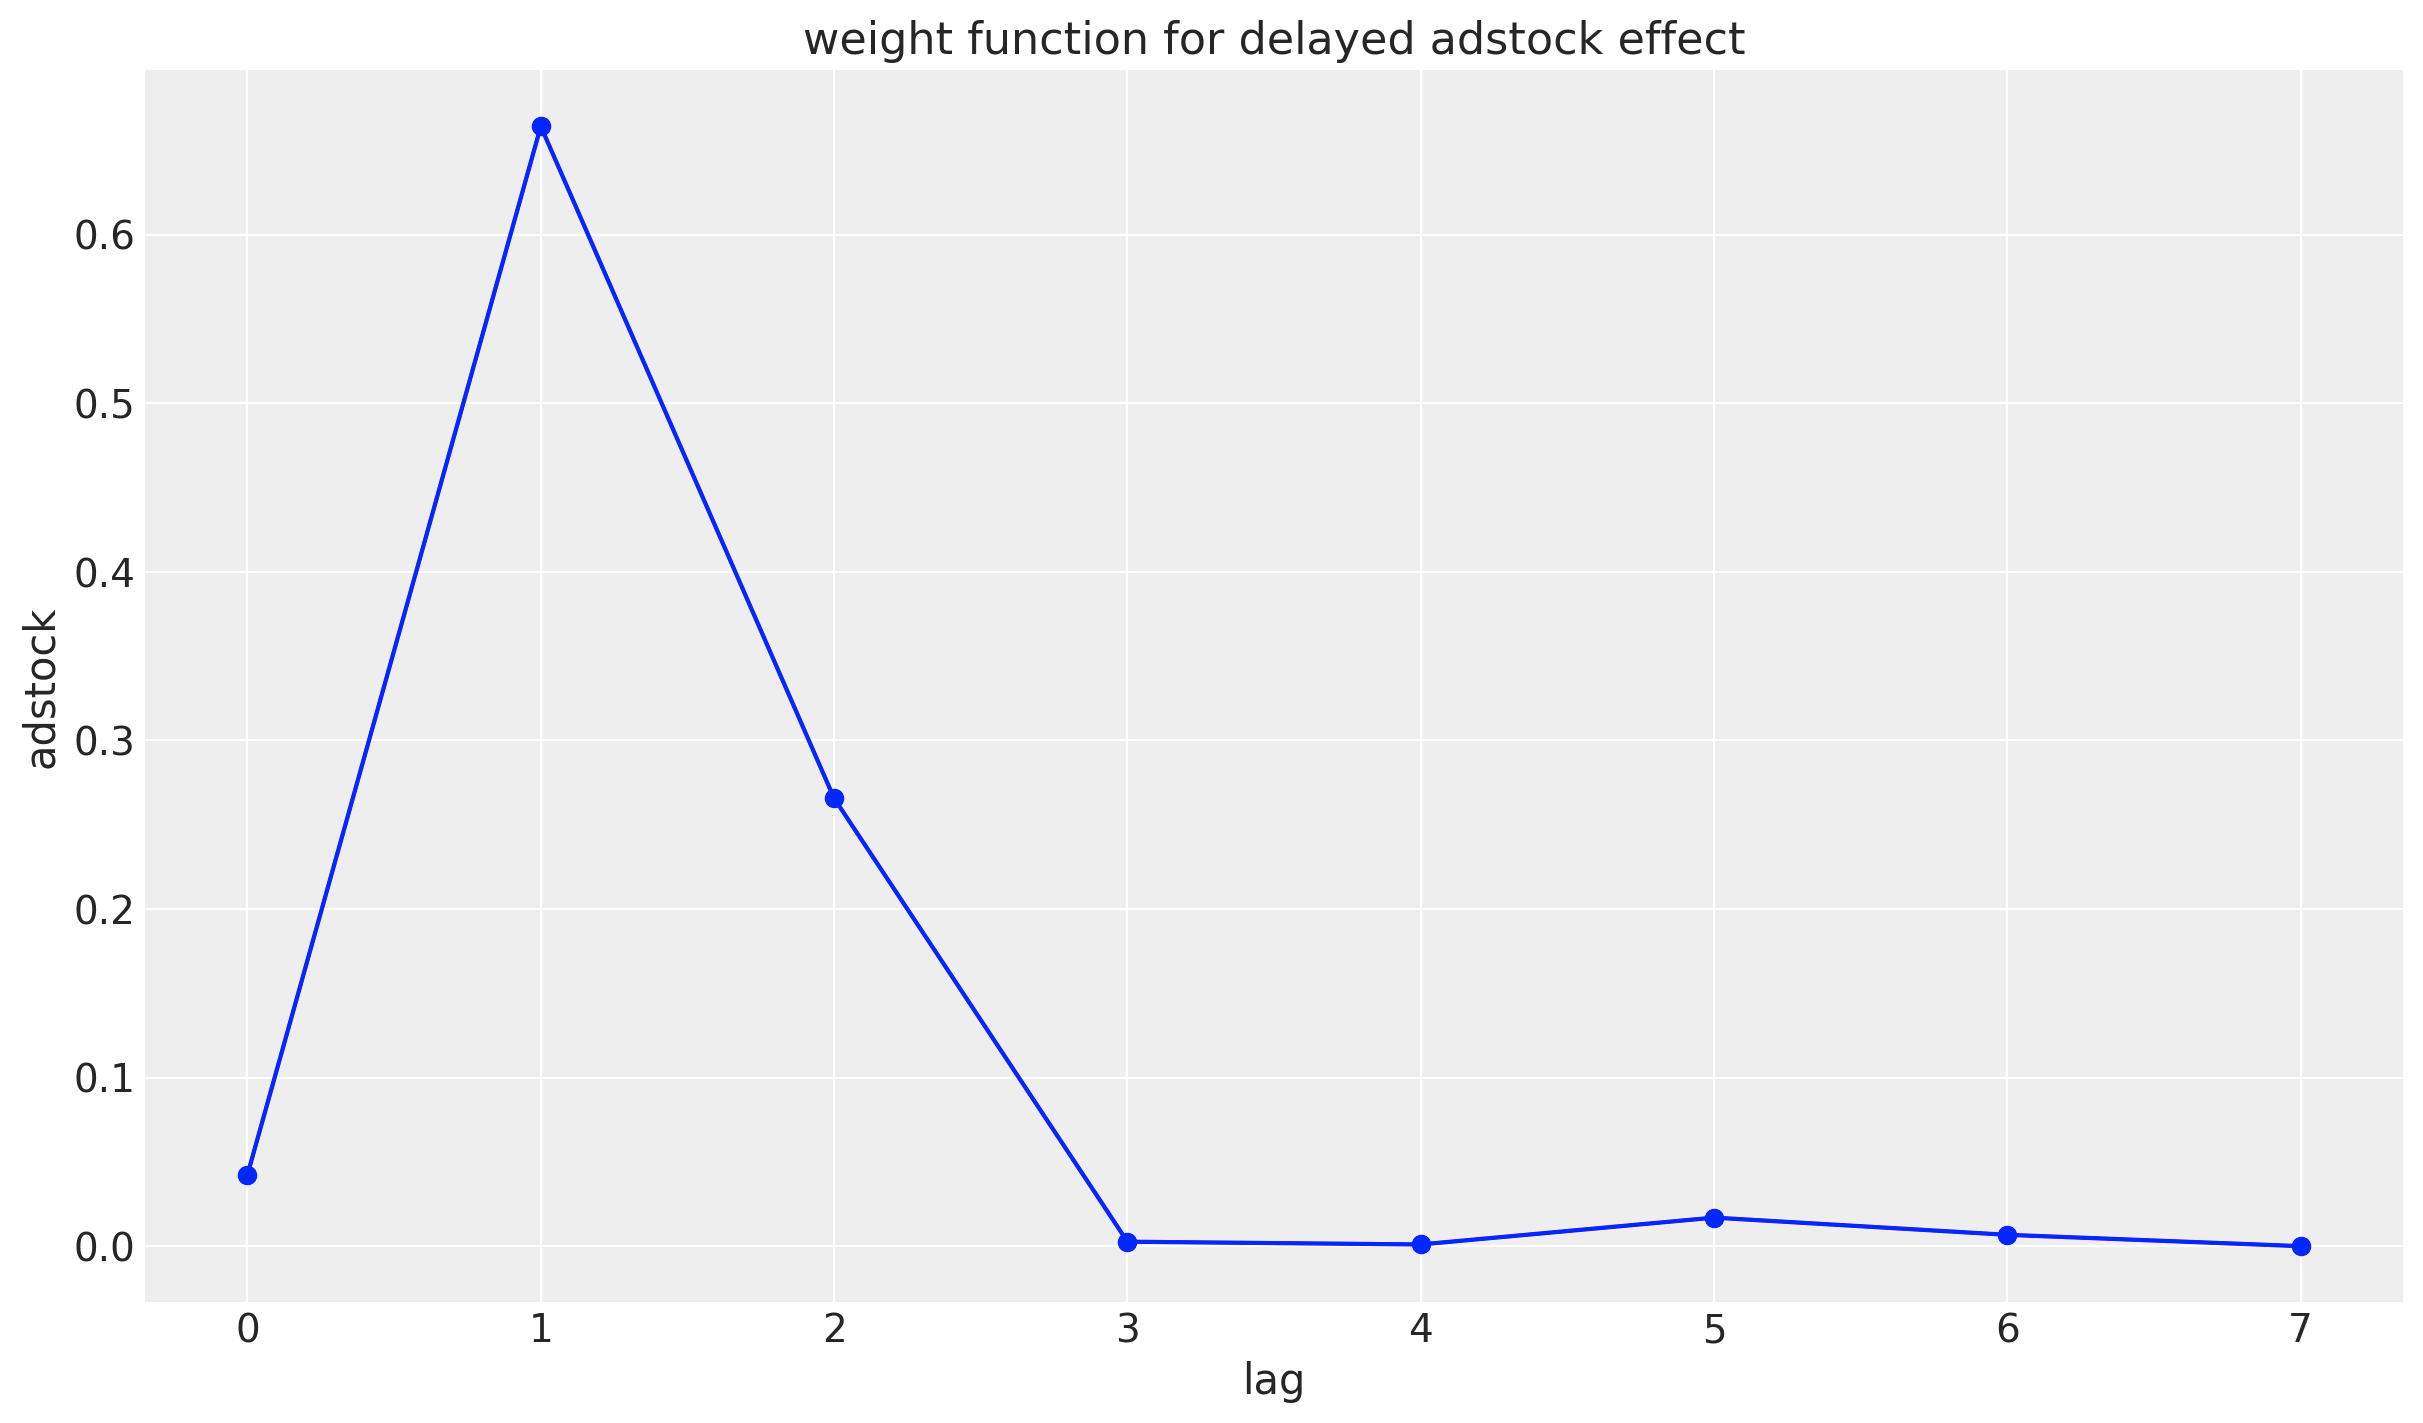
少し脱線しますが,仮にadstock effectのピークに遅延がある場合,geometric adstock effectの指数部分に遅延分マイナスをし,2乗することで遅延したadstock effectを表現することもできます。delayed adstock effectと呼ばれています。
$$
w_{1}^{d}(l;\alpha_m, \theta_m)=\alpha_{m}^{{(l-\theta_m)}^2}
$$
lag = np.arange(0, 8)
adstock = (0.4) ** ((lag-3)^2)/(sum((0.4) ** ((lag-3)^2)))

plt.plot(lag, adstock, marker='o', linestyle='-', color='b')
plt.xlabel('lag')
plt.ylabel('adstock')
plt.title('weight function for delayed adstock effect')
plt.grid(True)
plt.show()
$x_1$に対してlogistic_saturationを適用した結果がこちらになります。このlam1は目的変数を作成するため与えられてますが,推定しなければならないパラメータです。
# apply saturation transformation
lam1: float = 4.0

df["x1_adstock_saturated"] = logistic_saturation(
    x=df["x1_adstock"].to_numpy(), lam=lam1
).eval()

df = df.sort_values(by='x1')
plt.plot(df['x1'], df['x1_adstock_saturated'])
plt.plot(df['x1'], df['x1_adstock'])

x = np.linspace(0, 1, 100)
y = (1 - np.exp(-lam1 * x)) / (1 + np.exp(-lam1 * x))

plt.plot(x, y)
plt.xlabel('x1')
plt.ylabel('adstock_saturated')
plt.title('the logistic saturation function')
plt.grid(True)
plt.legend(['adstock_saturated', 'adstock', 'logistic function(linear)'])
plt.show()
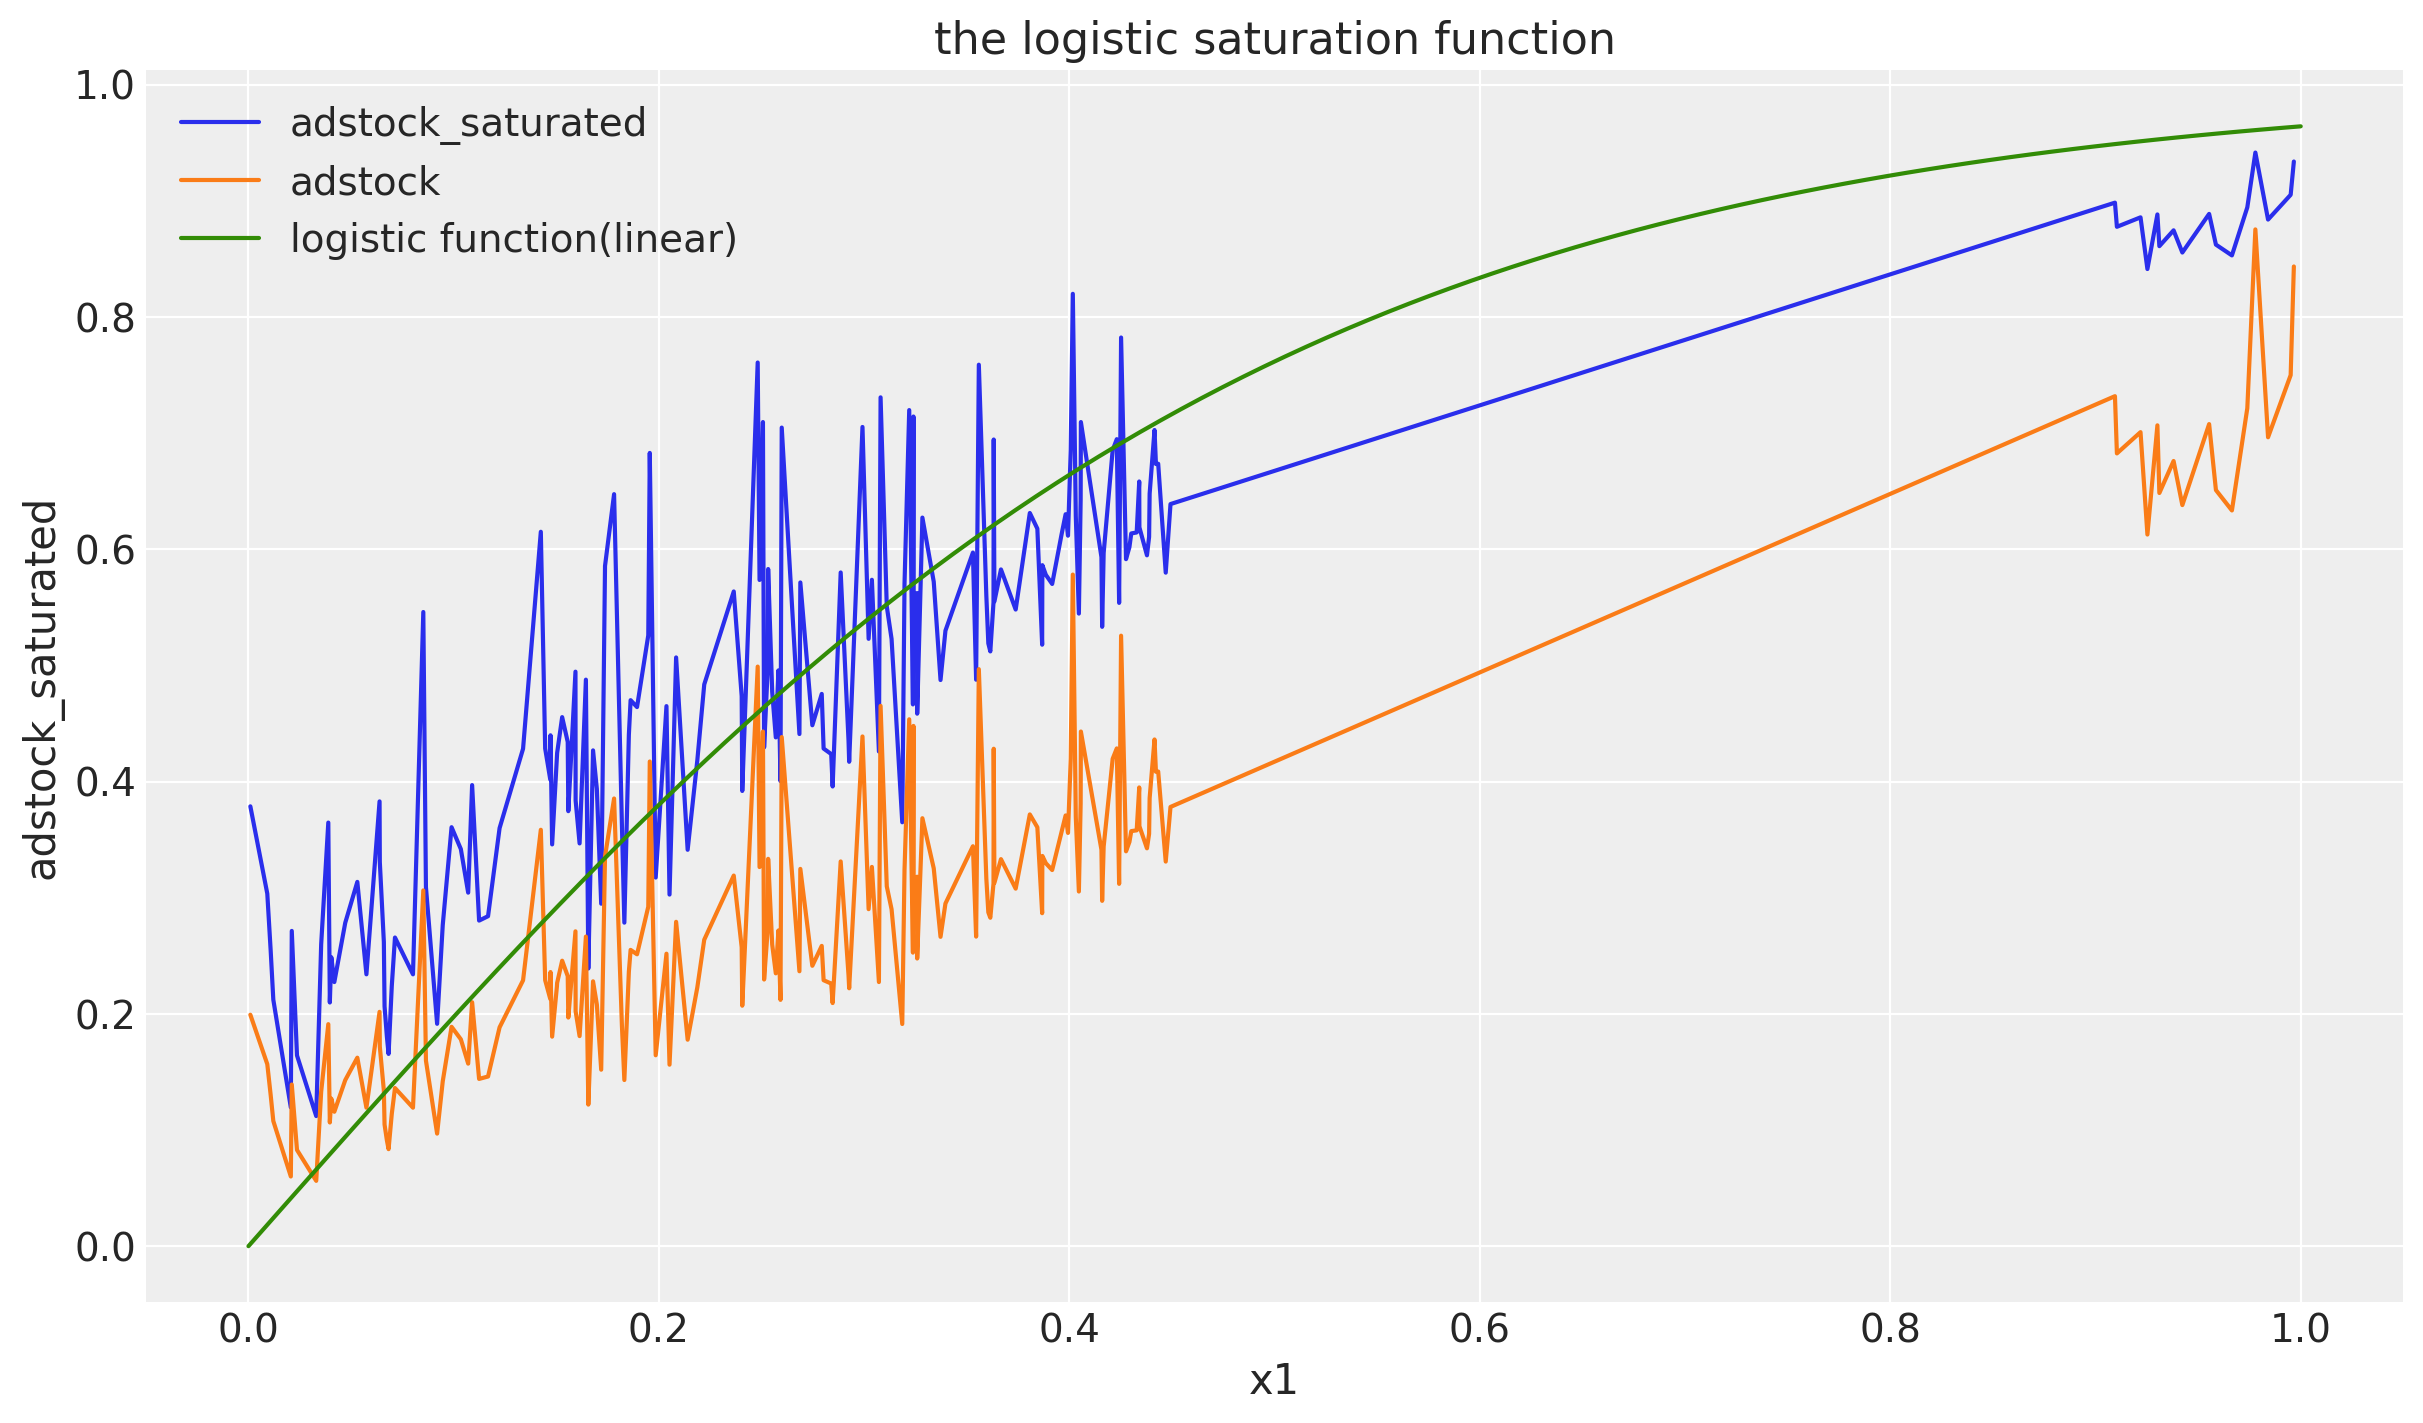
saturationとは,先述の通り広告の飽き具合を示したもので,x1_adstockをロジスティック関数の入力とすることで広告効果が投資額・反応の量につれ逓減していくことを表現しています。
緑色の線はlamdaが同様のlam1であるロジスティックの曲線です。xは単純な線形関数を使っており,関数名に(linear)をつけてます。
0.45から0.9まで直線になっているのはデータが存在しないためです。$x_1$のデータを作成した時のロジックを鑑みると,0.9以下は1/2していてつまり$x_1 \leq 4.5$となるためこのようになっています。「なんかフィットしてなくない?」感がありますが参考のためプロットしてます。(xを単純な線形な直線にしてるのが理由です。)
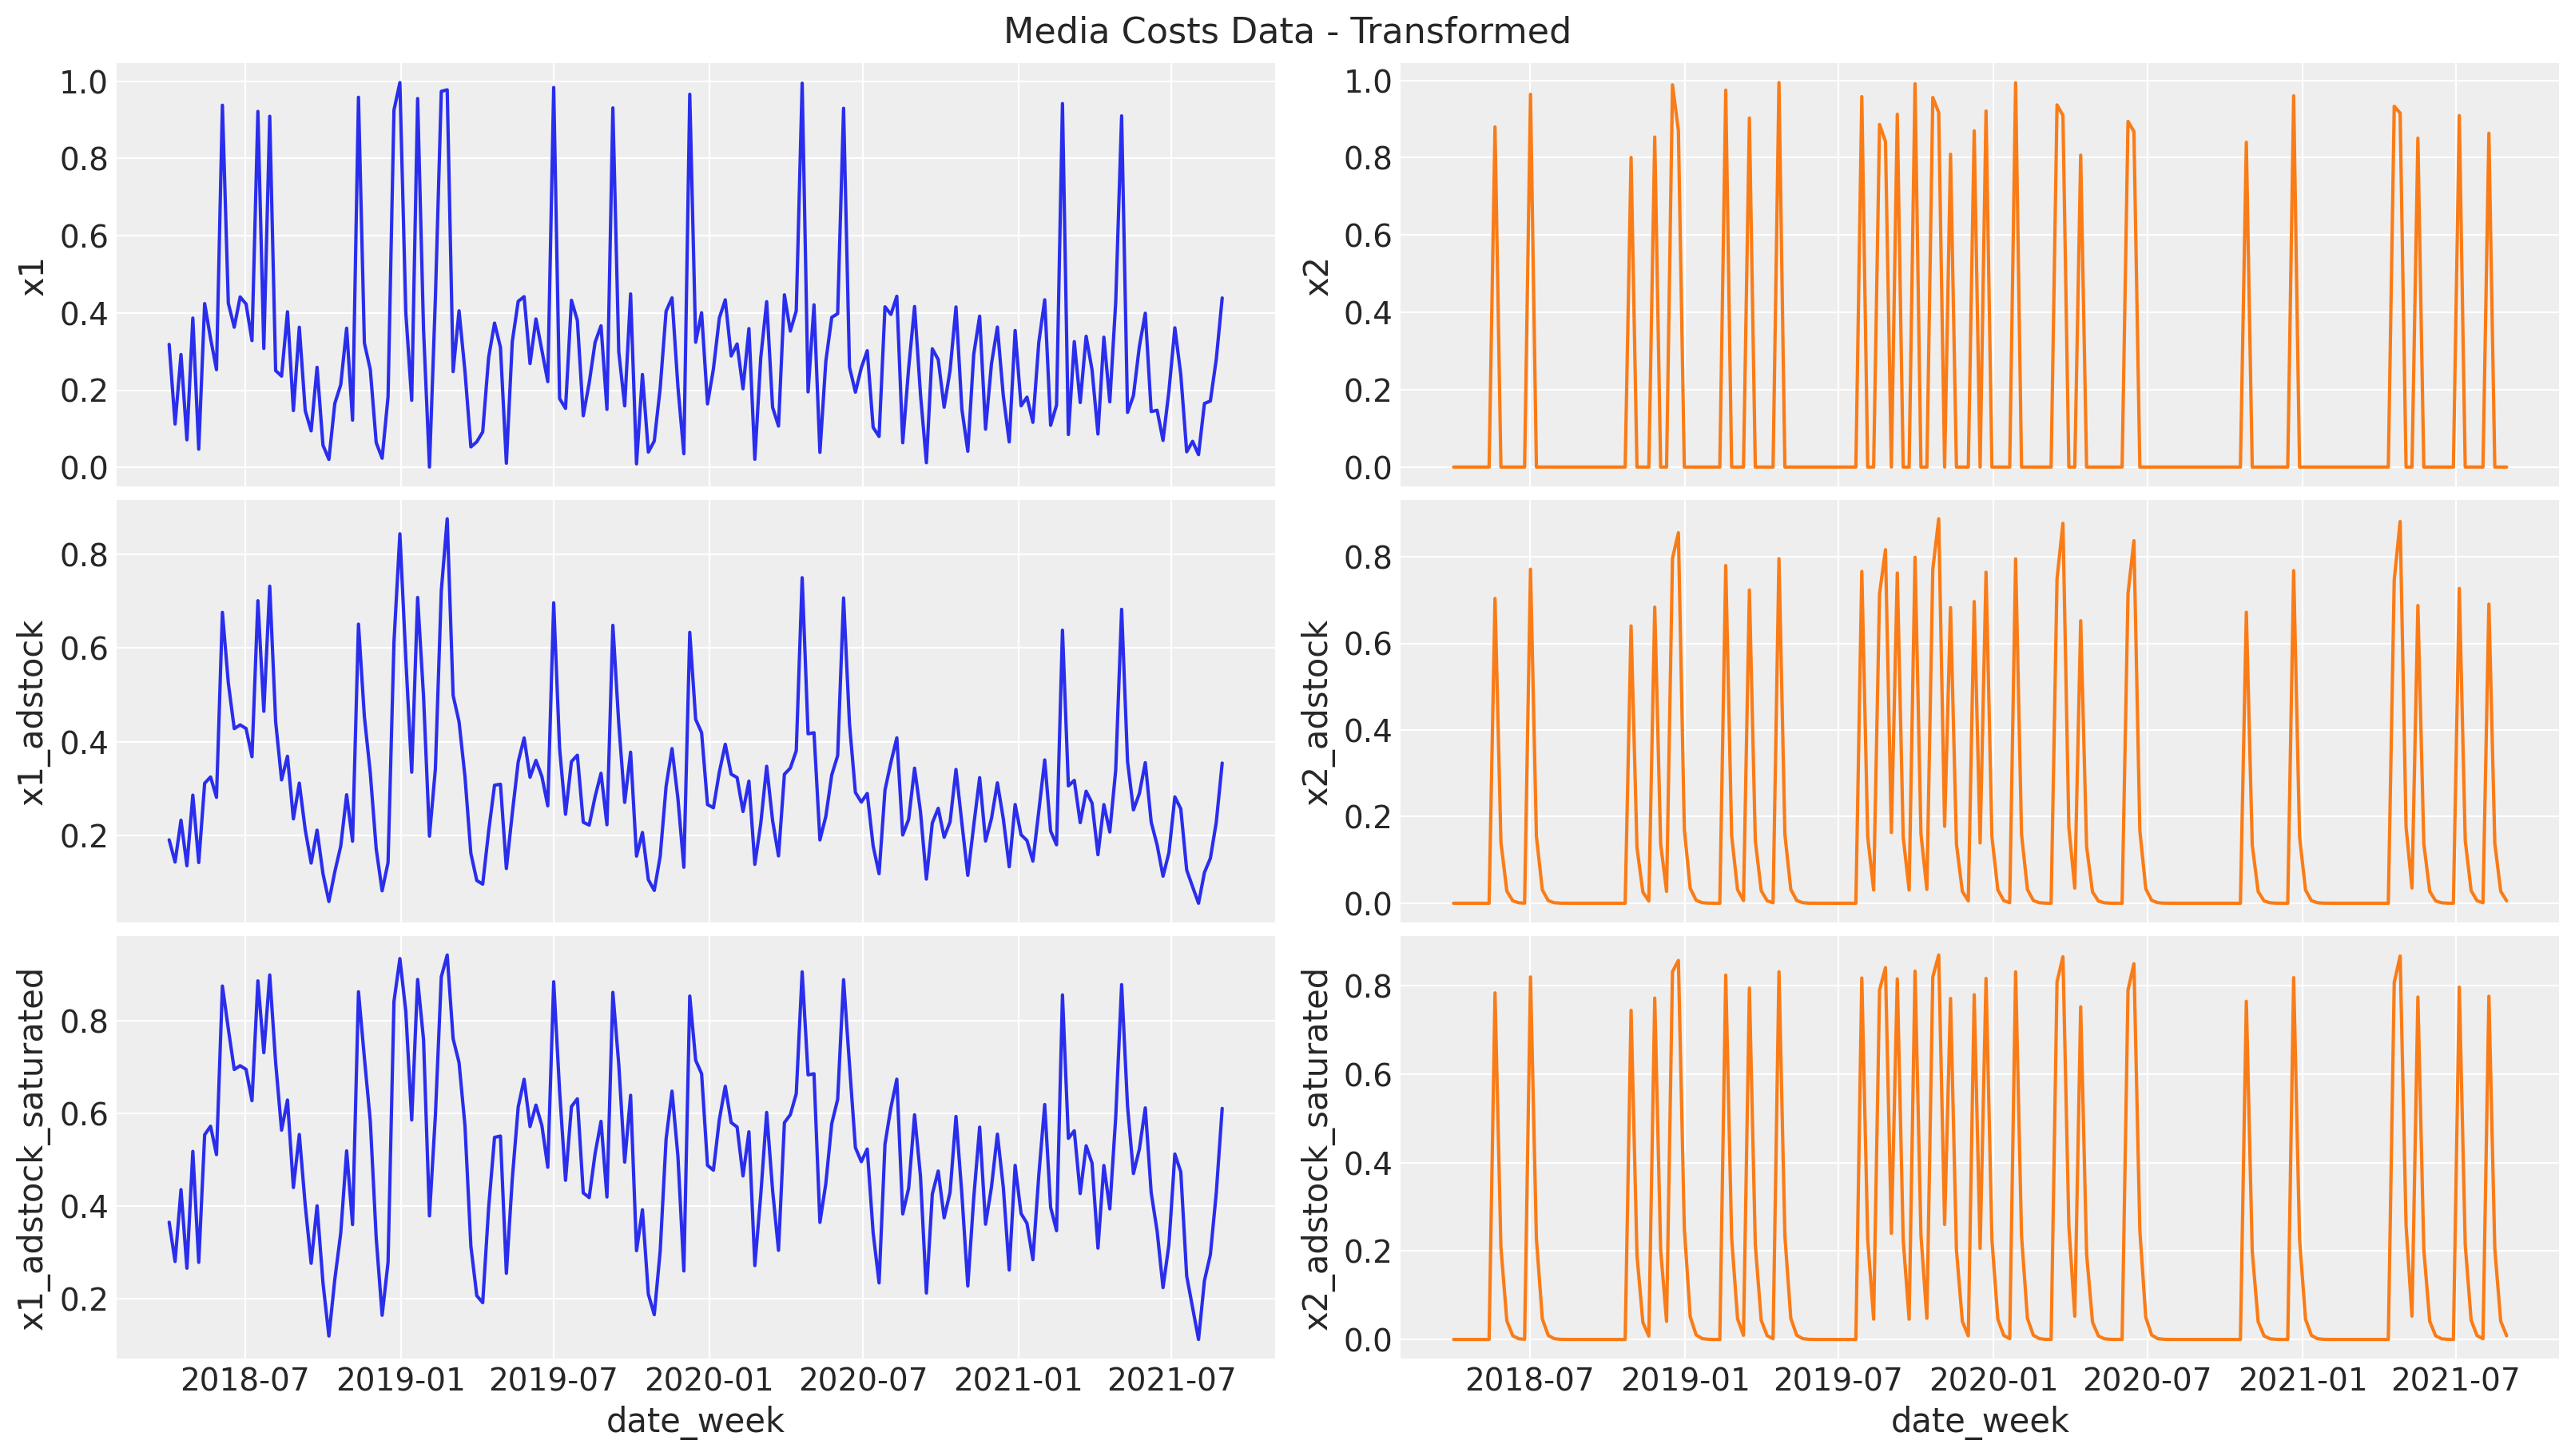
$x$について,もともとの系列とそれぞれの変形を行った系列をプロットします。
adstockについては過去の実績値を含めた平均をとっているため元々のxよりも少し上下の変化がなだらかなグラフになっていることがわかります。
また,saturationについても低い値の変化が大きく/高い値の変化が小さくなっていて,ロジスティック関数による広告効果の逓減が表現されていることがわかります。
トレンド,季節成分
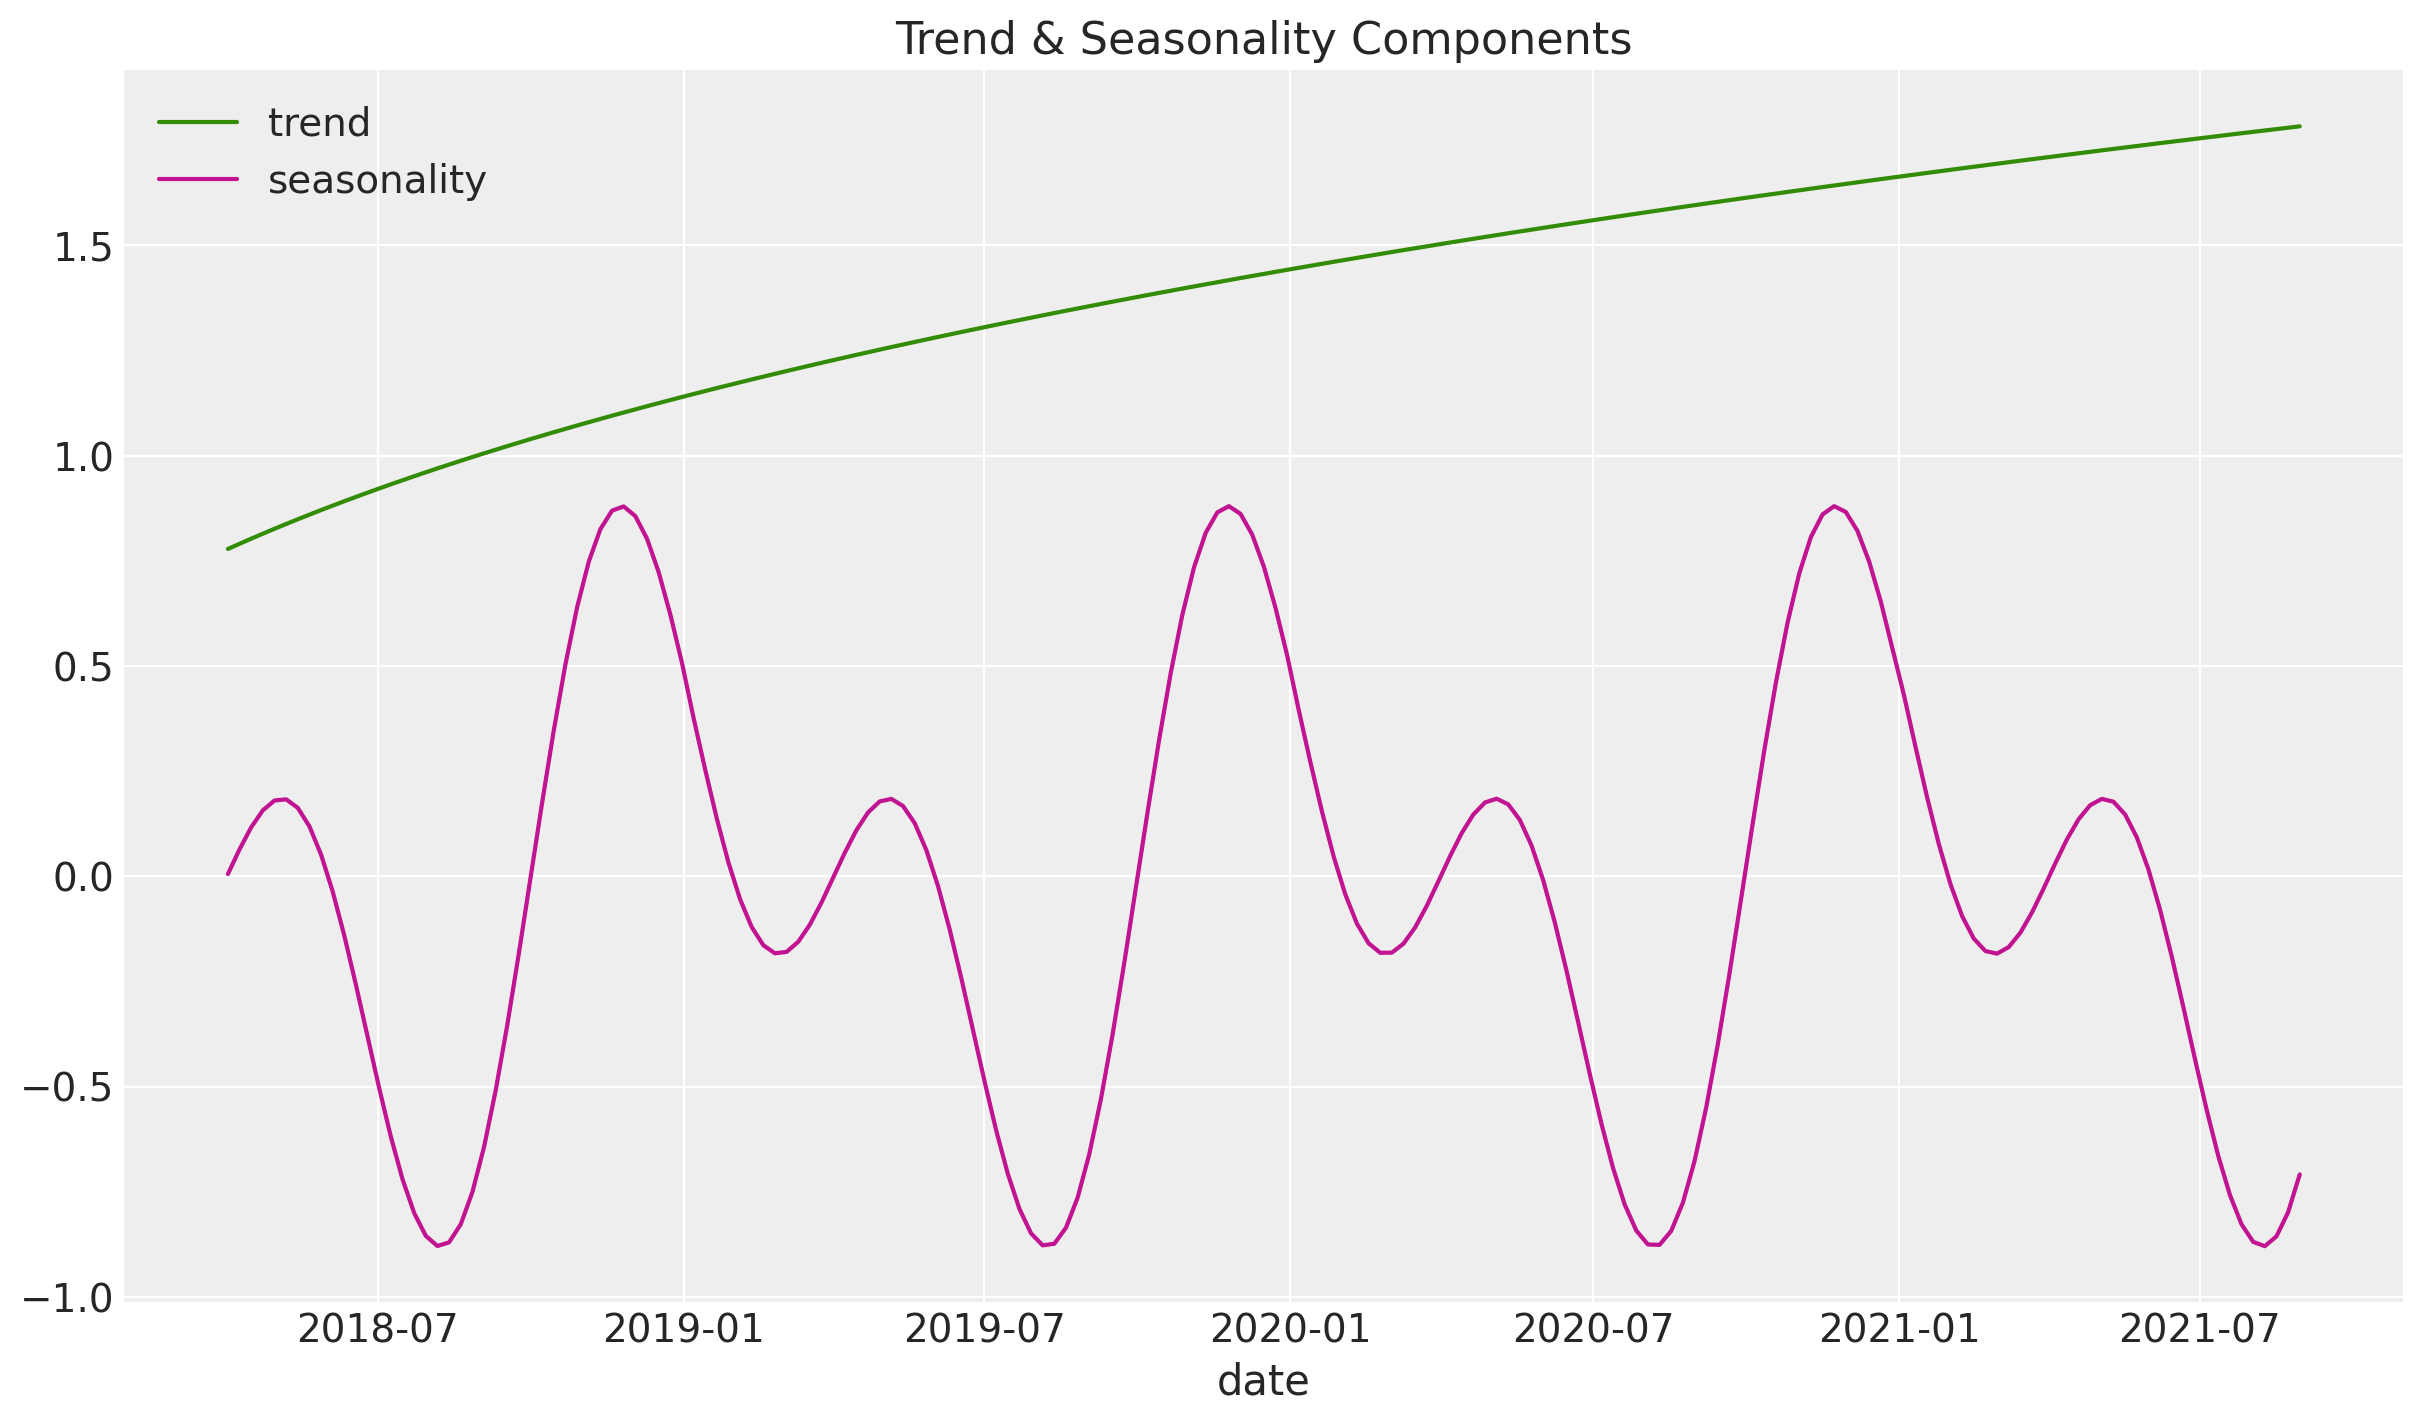
目的変数の素材となるトレンド,季節成分を以下で作成してます。季節成分はsin関数とcos関数から作成されています。
df["trend"] = (np.linspace(start=0.0, stop=50, num=n) + 10) ** (1 / 4) - 1

df["cs"] = -np.sin(2 * 2 * np.pi * df["dayofyear"] / 365.5)
df["cc"] = np.cos(1 * 2 * np.pi * df["dayofyear"] / 365.5)
df["seasonality"] = 0.5 * (df["cs"] + df["cc"])

fig, ax = plt.subplots()
sns.lineplot(x="date_week", y="trend", color="C2", label="trend", data=df, ax=ax)
sns.lineplot(
    x="date_week", y="seasonality", color="C3", label="seasonality", data=df, ax=ax
)
ax.legend(loc="upper left")
ax.set(title="Trend & Seasonality Components", xlabel="date", ylabel=None)
イベント効果
さらに目的変数作成にあたり,イベント日を2つ追加します。これはさきほど言及した外れ値のことで,ドキュメントによるとプロダクトローンチなどが該当するようです。
df["event_1"] = (df["date_week"] == "2019-05-13").astype(float)
df["event_2"] = (df["date_week"] == "2020-09-14").astype(float)
prophetを学んだ時イベント効果の例として「playoff」とか,「Super Bowl」とかがドキュメントに出てきましたが,最初はなんのことかよく分からず混乱しました。(完全なる余談です)
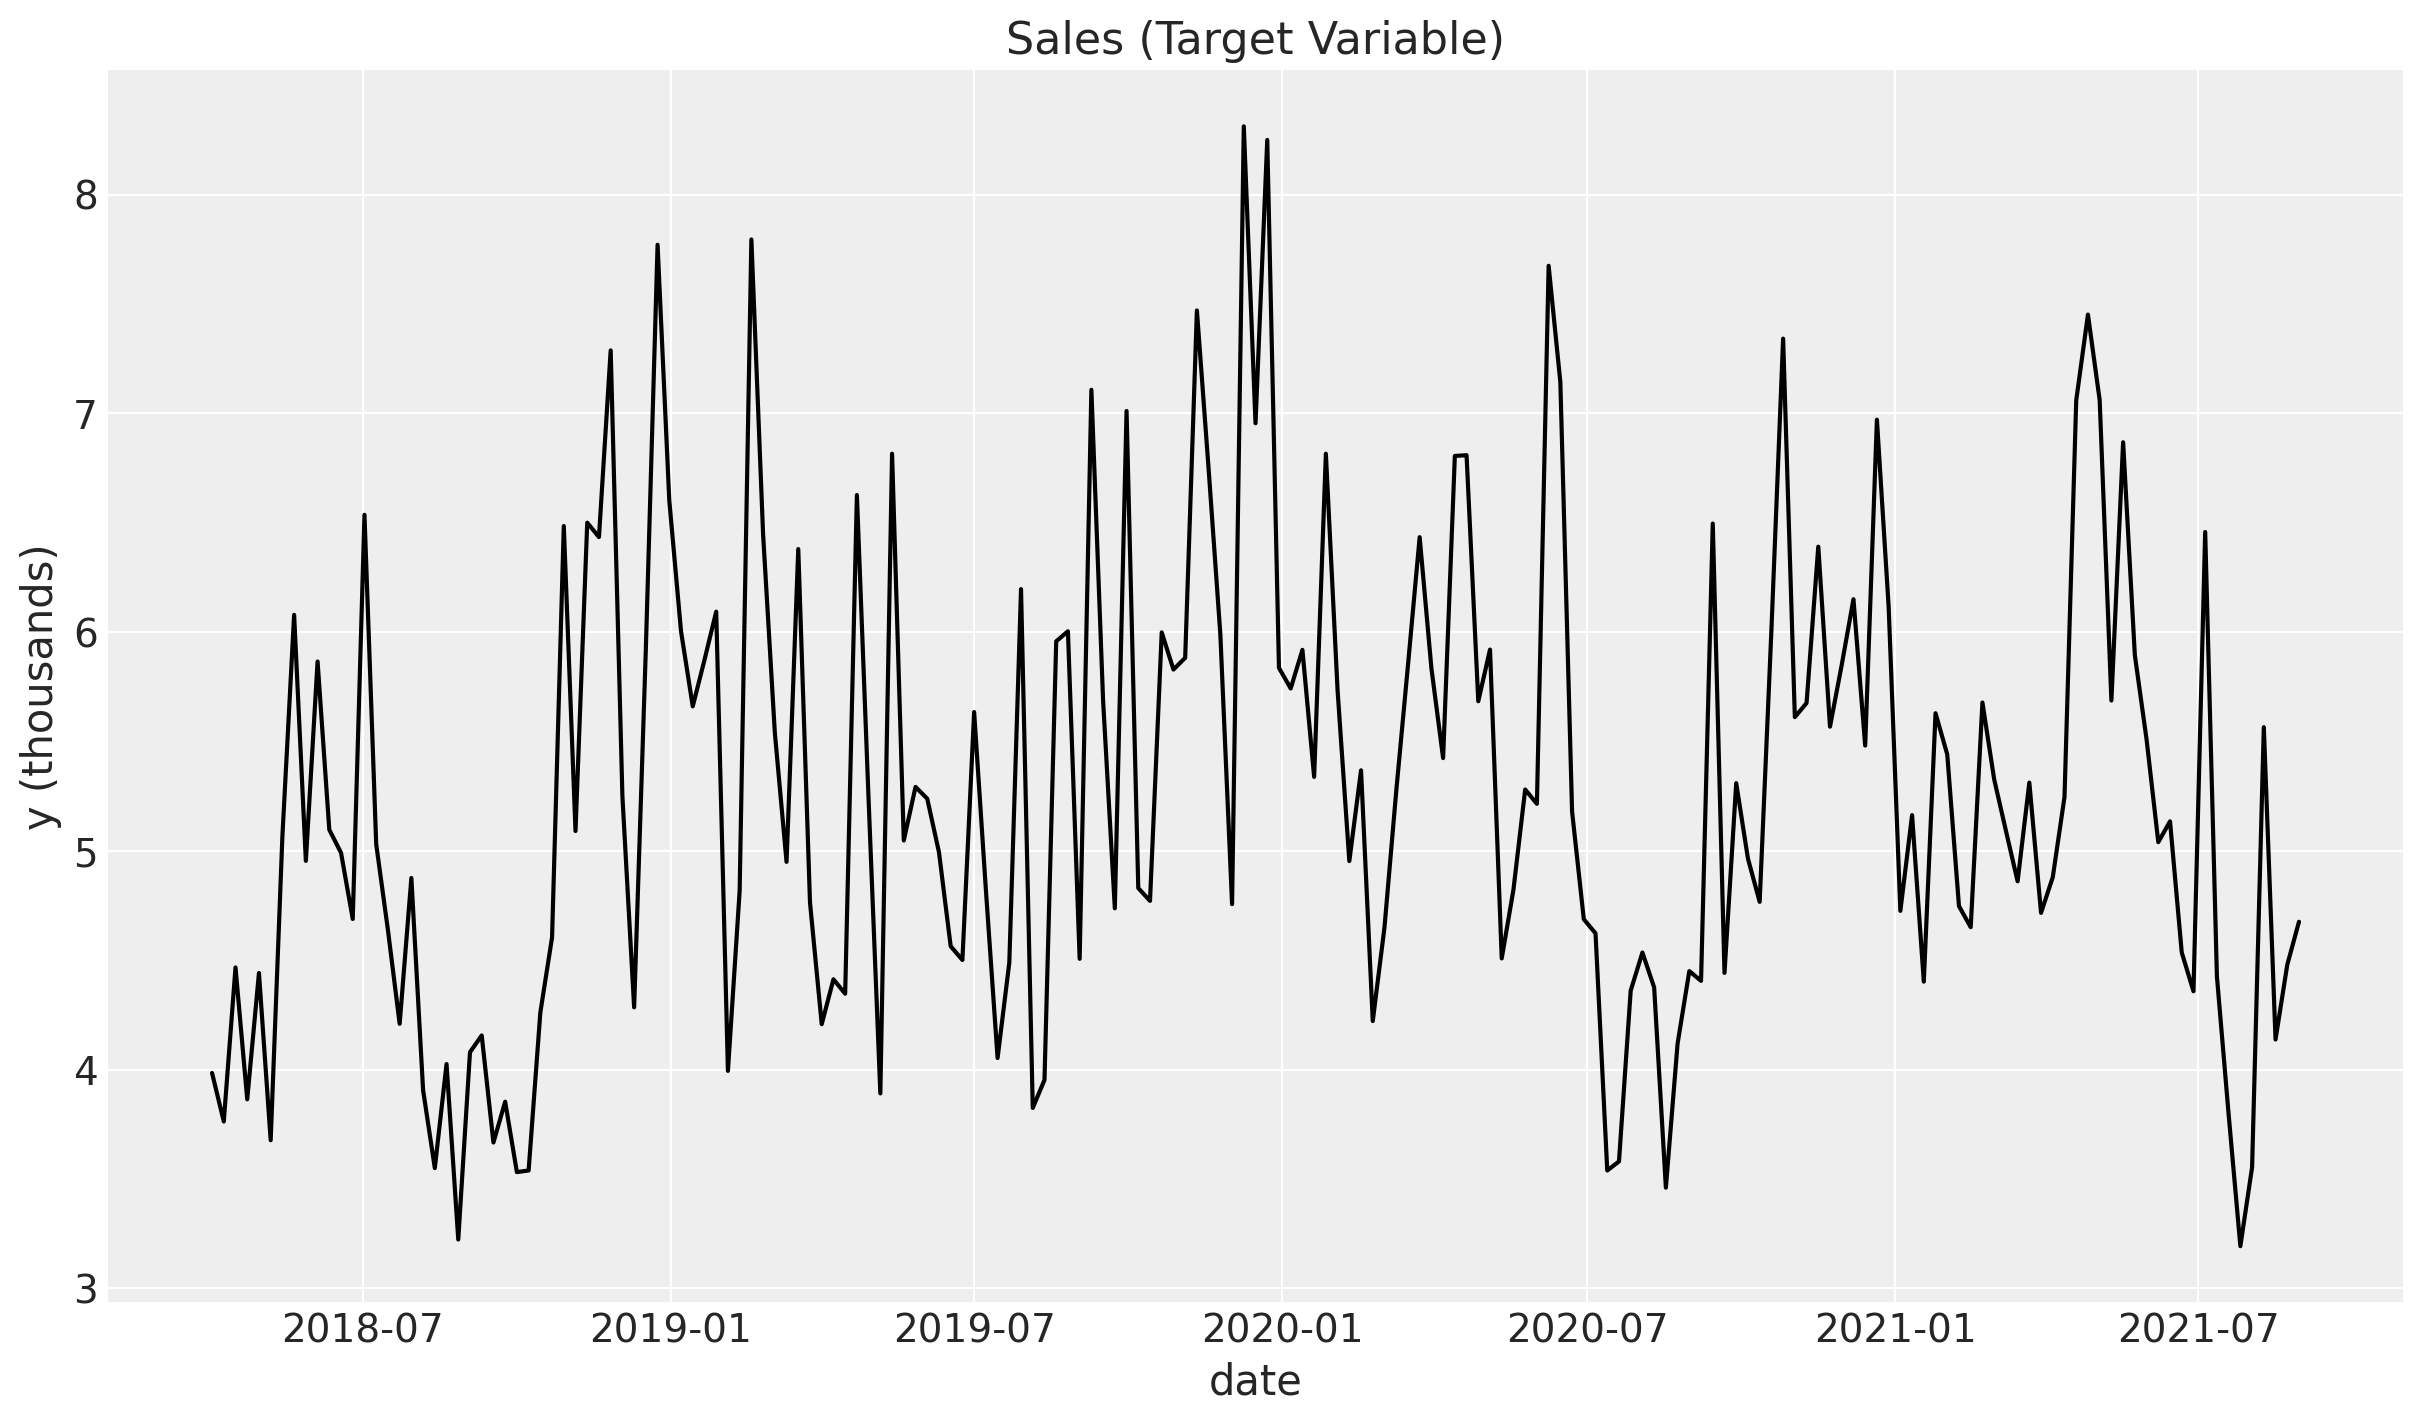
最後に,定数項やトレンド,季節成分,広告効果,イベント効果,誤差を追加して売上データを作ります。こちらが目的変数となります。
df["intercept"] = 2.0
df["epsilon"] = rng.normal(loc=0.0, scale=0.25, size=n)

amplitude = 1
beta_1 = 3.0
beta_2 = 2.0
betas = [beta_1, beta_2]

df["y"] = amplitude * (
    df["intercept"]
    + df["trend"]
    + df["seasonality"]
    + 1.5 * df["event_1"]
    + 2.5 * df["event_2"]
    + beta_1 * df["x1_adstock_saturated"]
    + beta_2 * df["x2_adstock_saturated"]
    + df["epsilon"]
)

fig, ax = plt.subplots()
sns.lineplot(x="date_week", y="y", color="black", data=df, ax=ax)
ax.set(title="Sales (Target Variable)", xlabel="date", ylabel="y (thousands)");
最終的な入力データ
MMMに入力するデータとしてこちらを抽出します。
columns_to_keep = [
    "date_week",
    "y",
    "x1",
    "x2",
    "event_1",
    "event_2",
    "dayofyear",
]

data = df[columns_to_keep].copy()

data.head()
Part2. モデリング
Part1で作成したデータを使ってMMMをモデリングしていきます。
特徴量エンジニアリング
今回は自分たちでデータを作成したのでskipしていますが本来はEDAを行なっています。(ちなみにドキュメントにも「EDAしなさいよ」と書いてあります。)EDAの結果,トレンドと季節成分があることがわかります。
まずトレンドは一様に増加する直線を使用することで対応できます。
季節成分にはprophetと同様にフーリエ級数を扱います。イベント効果はすでにデータの中にダミー変数として入れることができています。
# trend feature
data["t"] = range(n)

data.head()
モデルの特定
PyMC-Marketingの DelayedSaturatedMMMクラスを利用してモデルを特定します。今回はベイズ推定のフレームワークに沿っているので,チャンネルに関して前知識がある場合事前分布に組み込むことができます。たとえばこのような感じです。
- チャンネルの寄与は正であるべきから,事前分布として半正規分布(正の値のみをとる確率分布)を利用できる。チャンネルごとに$\sigma$を設定する必要があり,次の2を利用する。
- 最も費用をかけて投資しているチャンネルについて,普通はそのチャンネルに関する売上は他チャンネルよりも多くあって欲しいと思っているので,チャンネルの事前分布として費用をかけているものの$\sigma$はより大きくする。
また,DelayedSaturatedMMMはデータのスケーリングを行っているため,事前分布もそれに伴った考慮をする必要があります。こういった考え方を実際にモデルに組み込むには,各チャンネルの消費シェアを計算してあげることが一つの方法になります。
まずシェアを計算します。
total_spend_per_channel = data[["x1", "x2"]].sum(axis=0)

spend_share = total_spend_per_channel / total_spend_per_channel.sum()

spend_share
その次に,$\sigma$をチャンネルごとに設定します。
# The scale necessary to make a HalfNormal distribution have unit variance
HALFNORMAL_SCALE = 1 / np.sqrt(1 - 2 / np.pi)

n_channels = 2

prior_sigma = HALFNORMAL_SCALE * n_channels * spend_share.to_numpy()

prior_sigma.tolist()
sklearnの書き方と同じように,データをXとyとで分けます。
X = data.drop("y",axis=1)
y = data["y"]
model_configで事前分布のパラメータを変更することができます。まずはデフォルトの状態です。
dummy_model = DelayedSaturatedMMM(date_column = "", channel_columns= "", adstock_max_lag = 4)
dummy_model.default_model_config
つぎにさきほど設計したチャンネルごとの$\sigma$を設定します。事前分布のパラメータのみを変える際はすべての設定を記述する必要はなく,該当する部分を書くだけで良いようです。
custom_beta_channel_prior = {"beta_channel": {"sigma": prior_sigma, "dims": ("channel",)}}
my_model_config = {**dummy_model.default_model_config, **custom_beta_channel_prior}
サンプリングも同様に設定を変えることができます。下ではプログレスバーを表示させる設定にしてます。
sampler_config= {"progressbar": True}
モデルの準備ができました。
mmm = DelayedSaturatedMMM(
    model_config = my_model_config,
    sampler_config = sampler_config,
    date_column="date_week",
    channel_columns=["x1", "x2"],
    control_columns=[
        "event_1",
        "event_2",
        "t",
    ],
    adstock_max_lag=8,
    yearly_seasonality=2,
)
モデルのフィッティング
以下のコードでフィッティングができ,サンプリングが始まります。
mmm.fit(X=X, y=y, target_accept=0.95, chains=4, random_seed=rng)
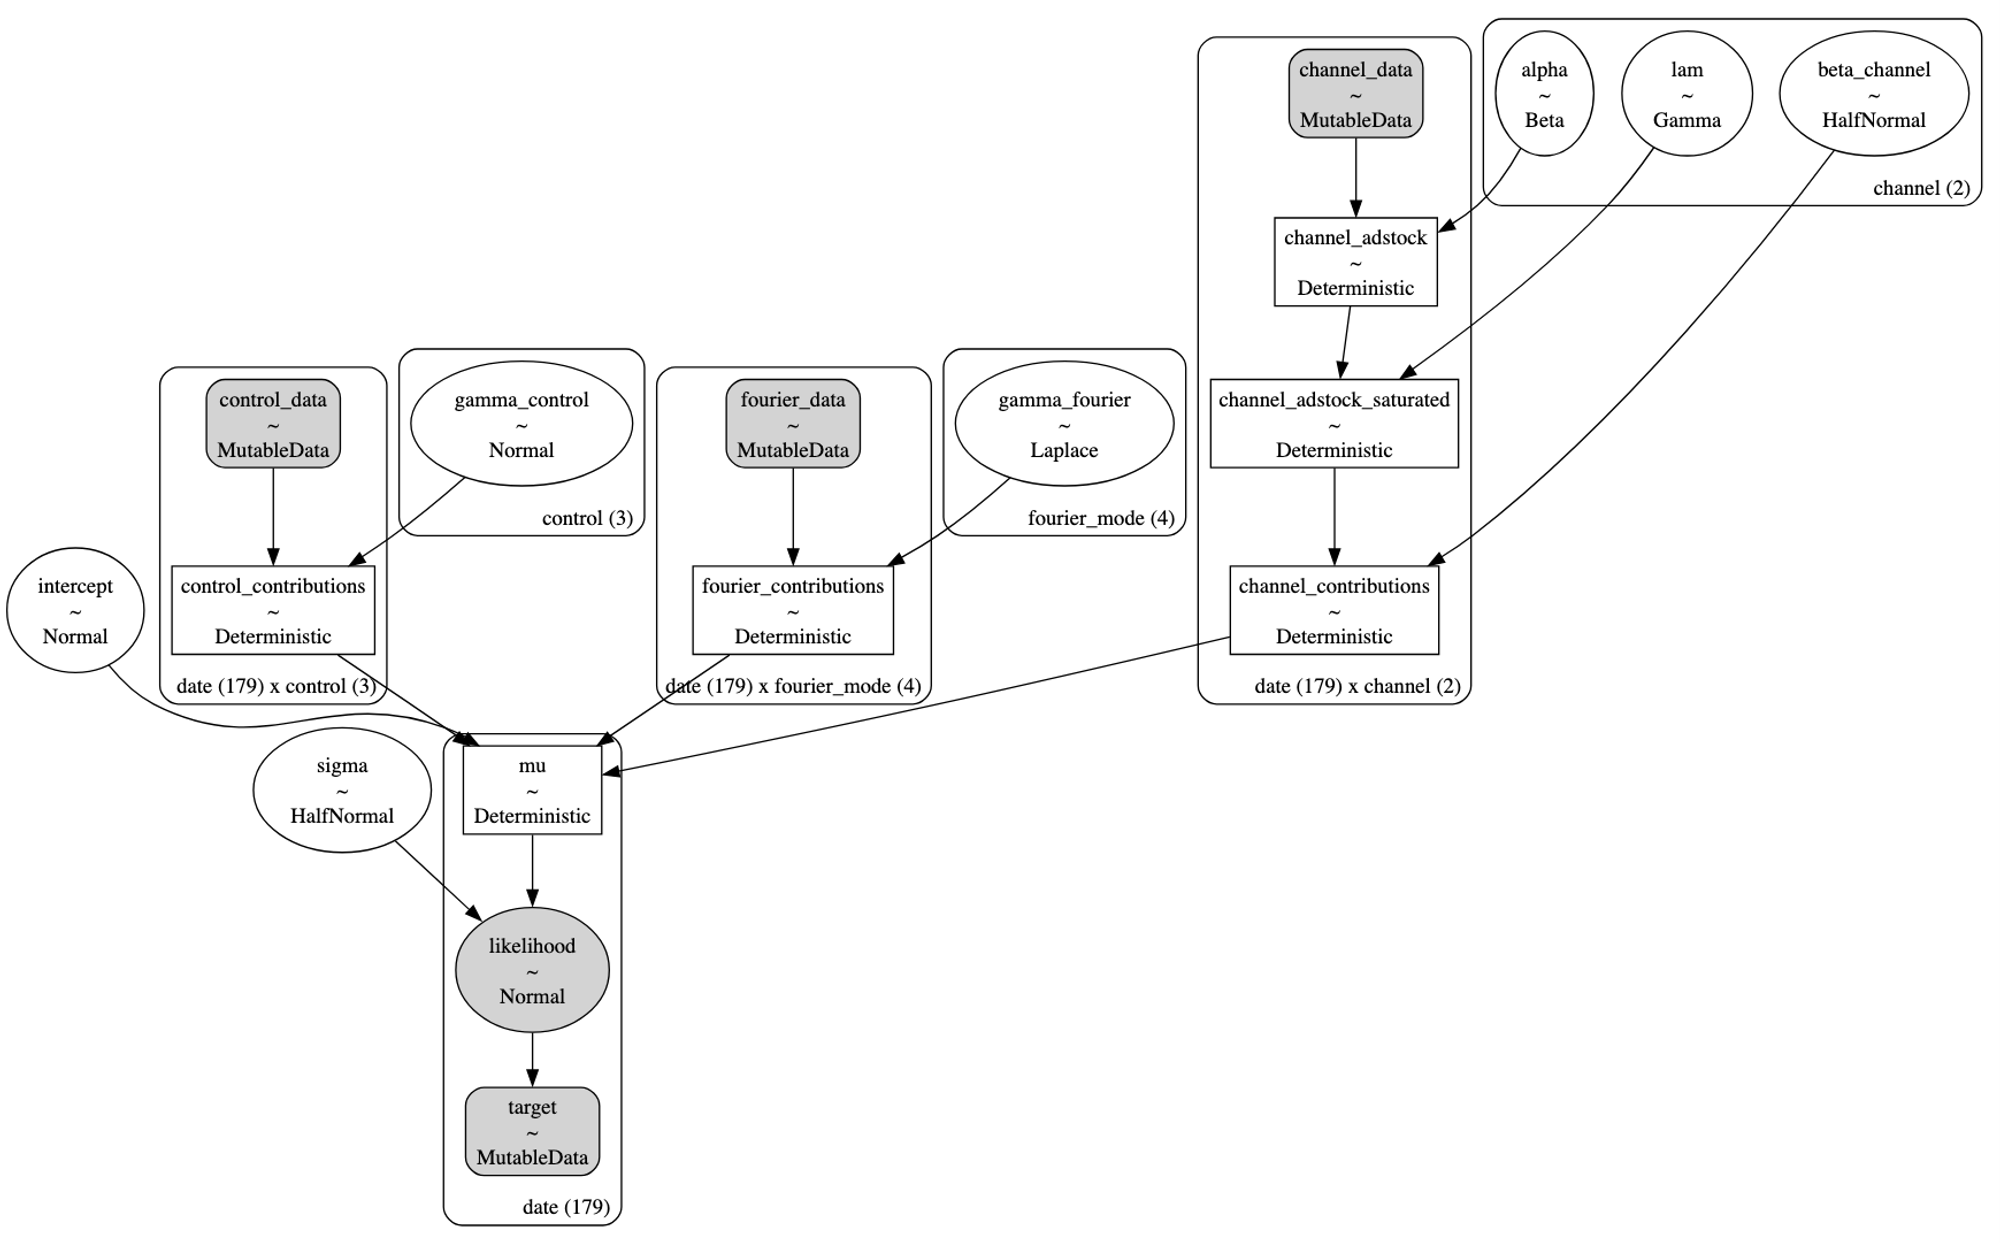
モデルの構造は以下で確認できます。
pm.model_to_graphviz(model=mmm.model)
モデル診断
fit_resultでモデルのトレースを確認できます。
mmm.fit_result
例えばinterceptにおける各chainのトレースを確認したい場合こんな感じになります。
mmm.fit_result.intercept.head()
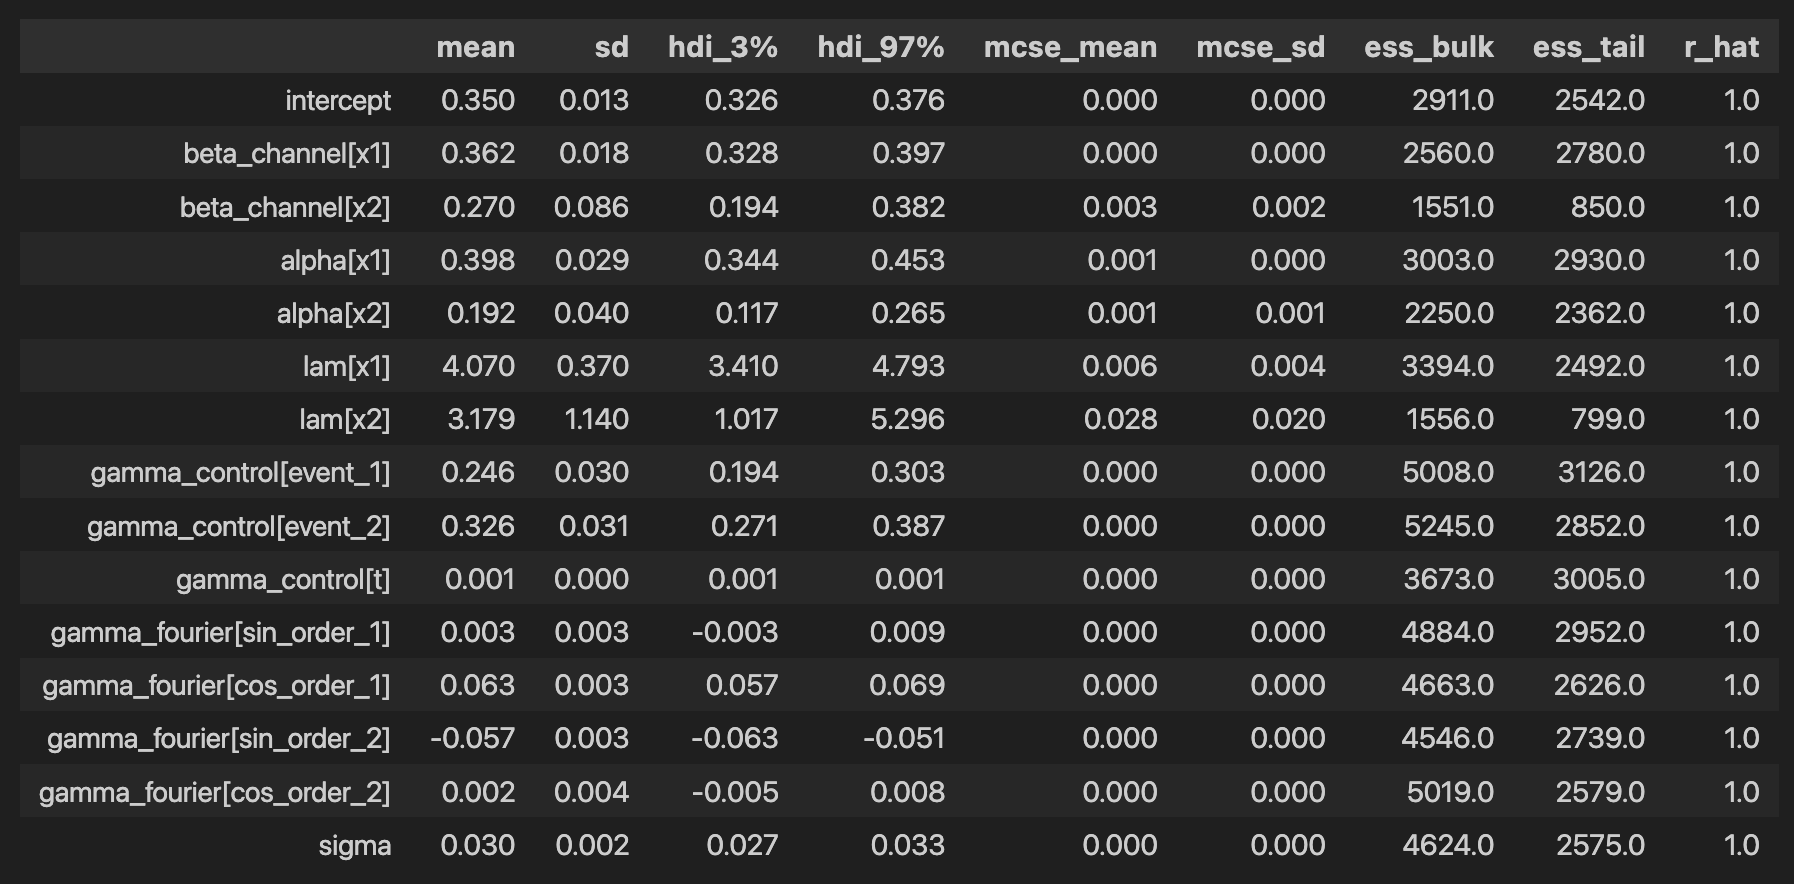
各係数の統計量は下から出すことができます。
az.summary(
    data=mmm.fit_result,
    var_names=[
        "intercept",
        "beta_channel",
        "alpha",
        "lam",
        "gamma_control",
        "gamma_fourier",
        "sigma",
    ],
)
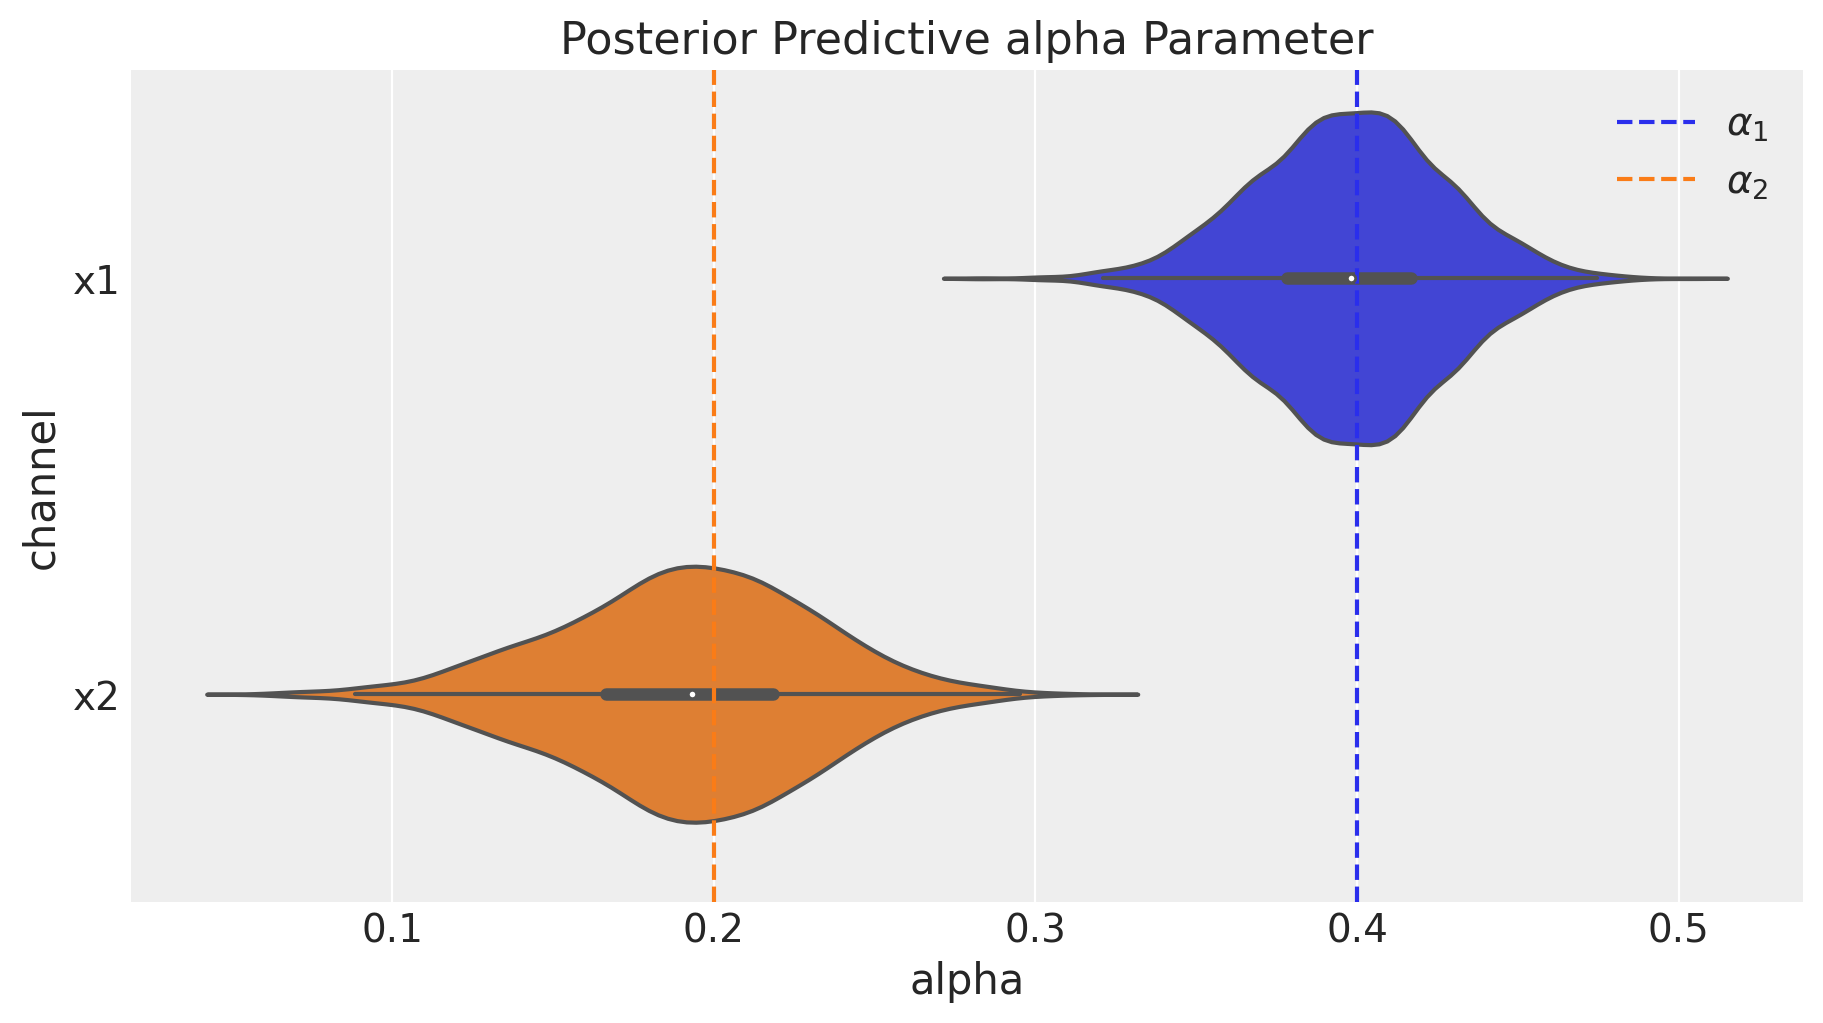
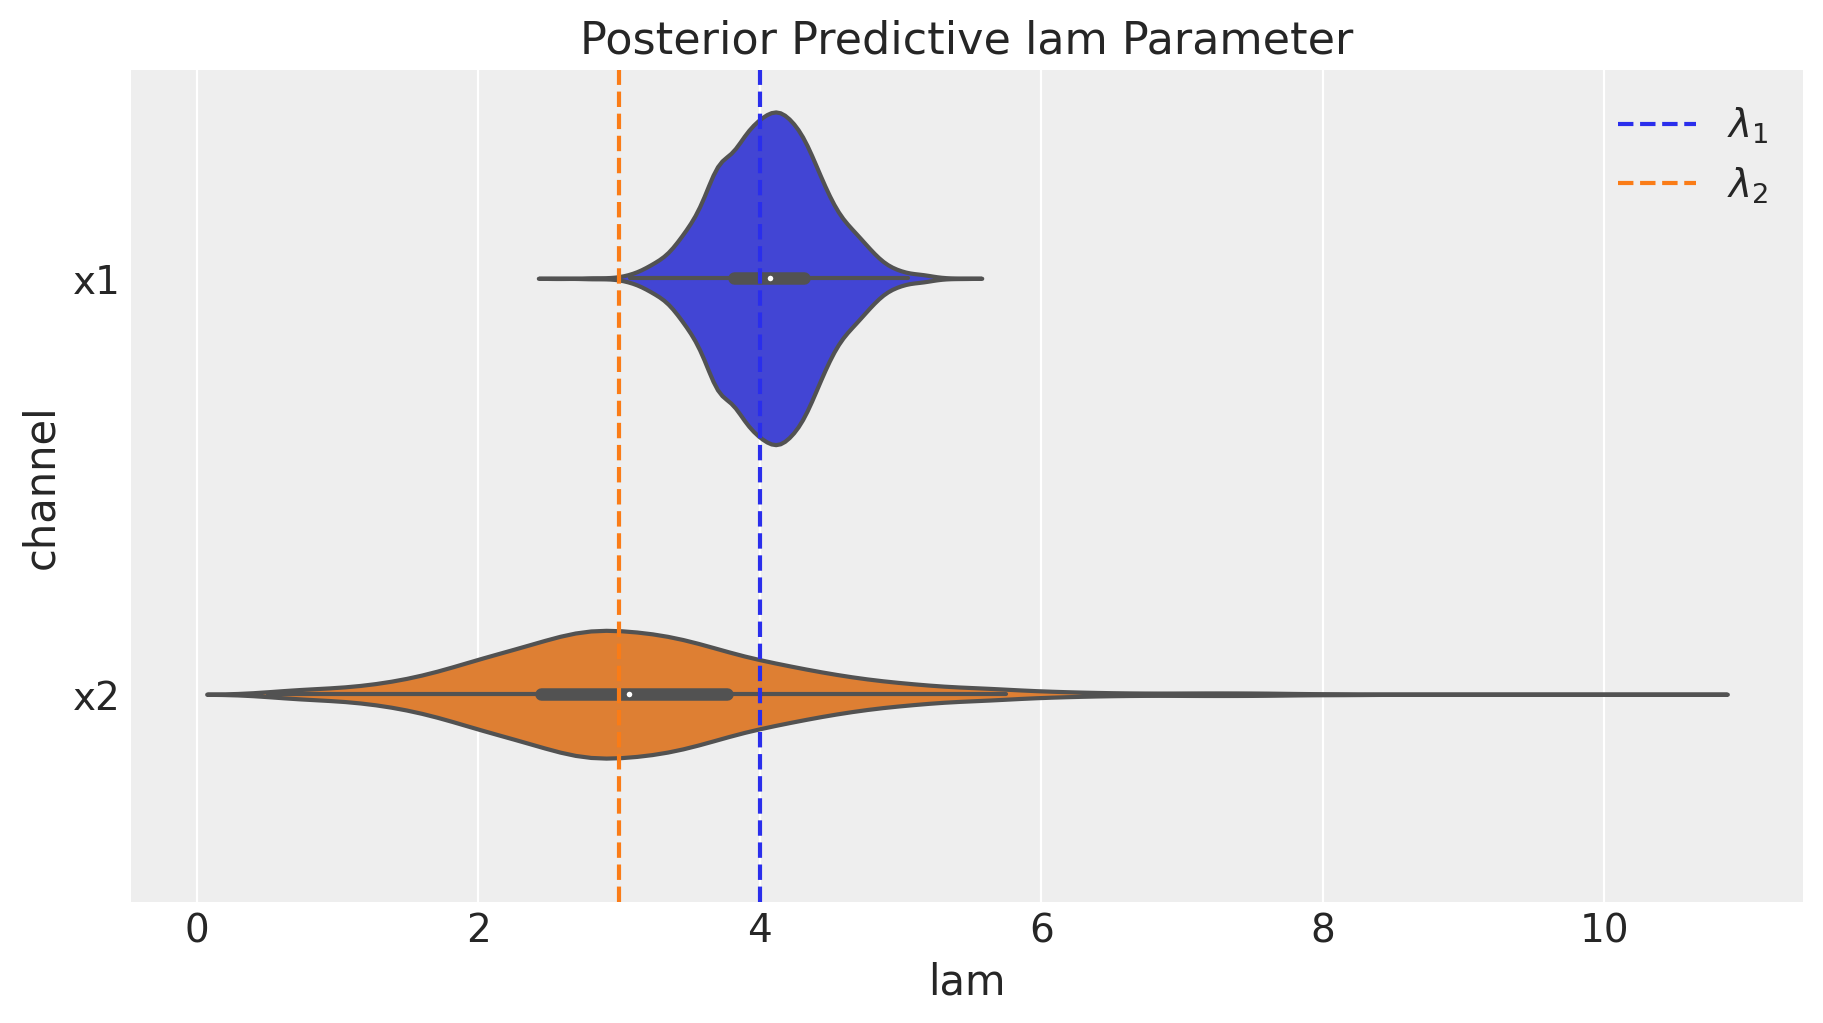
alphaとlamについて,事後平均がそれぞれ(0.397, 0.191), (4.059, 3.197)となっておりデータ作成の際自分で設定した値である(0.4, 0.2), (4.0, 3.0)と非常に近い値を取ることができています。
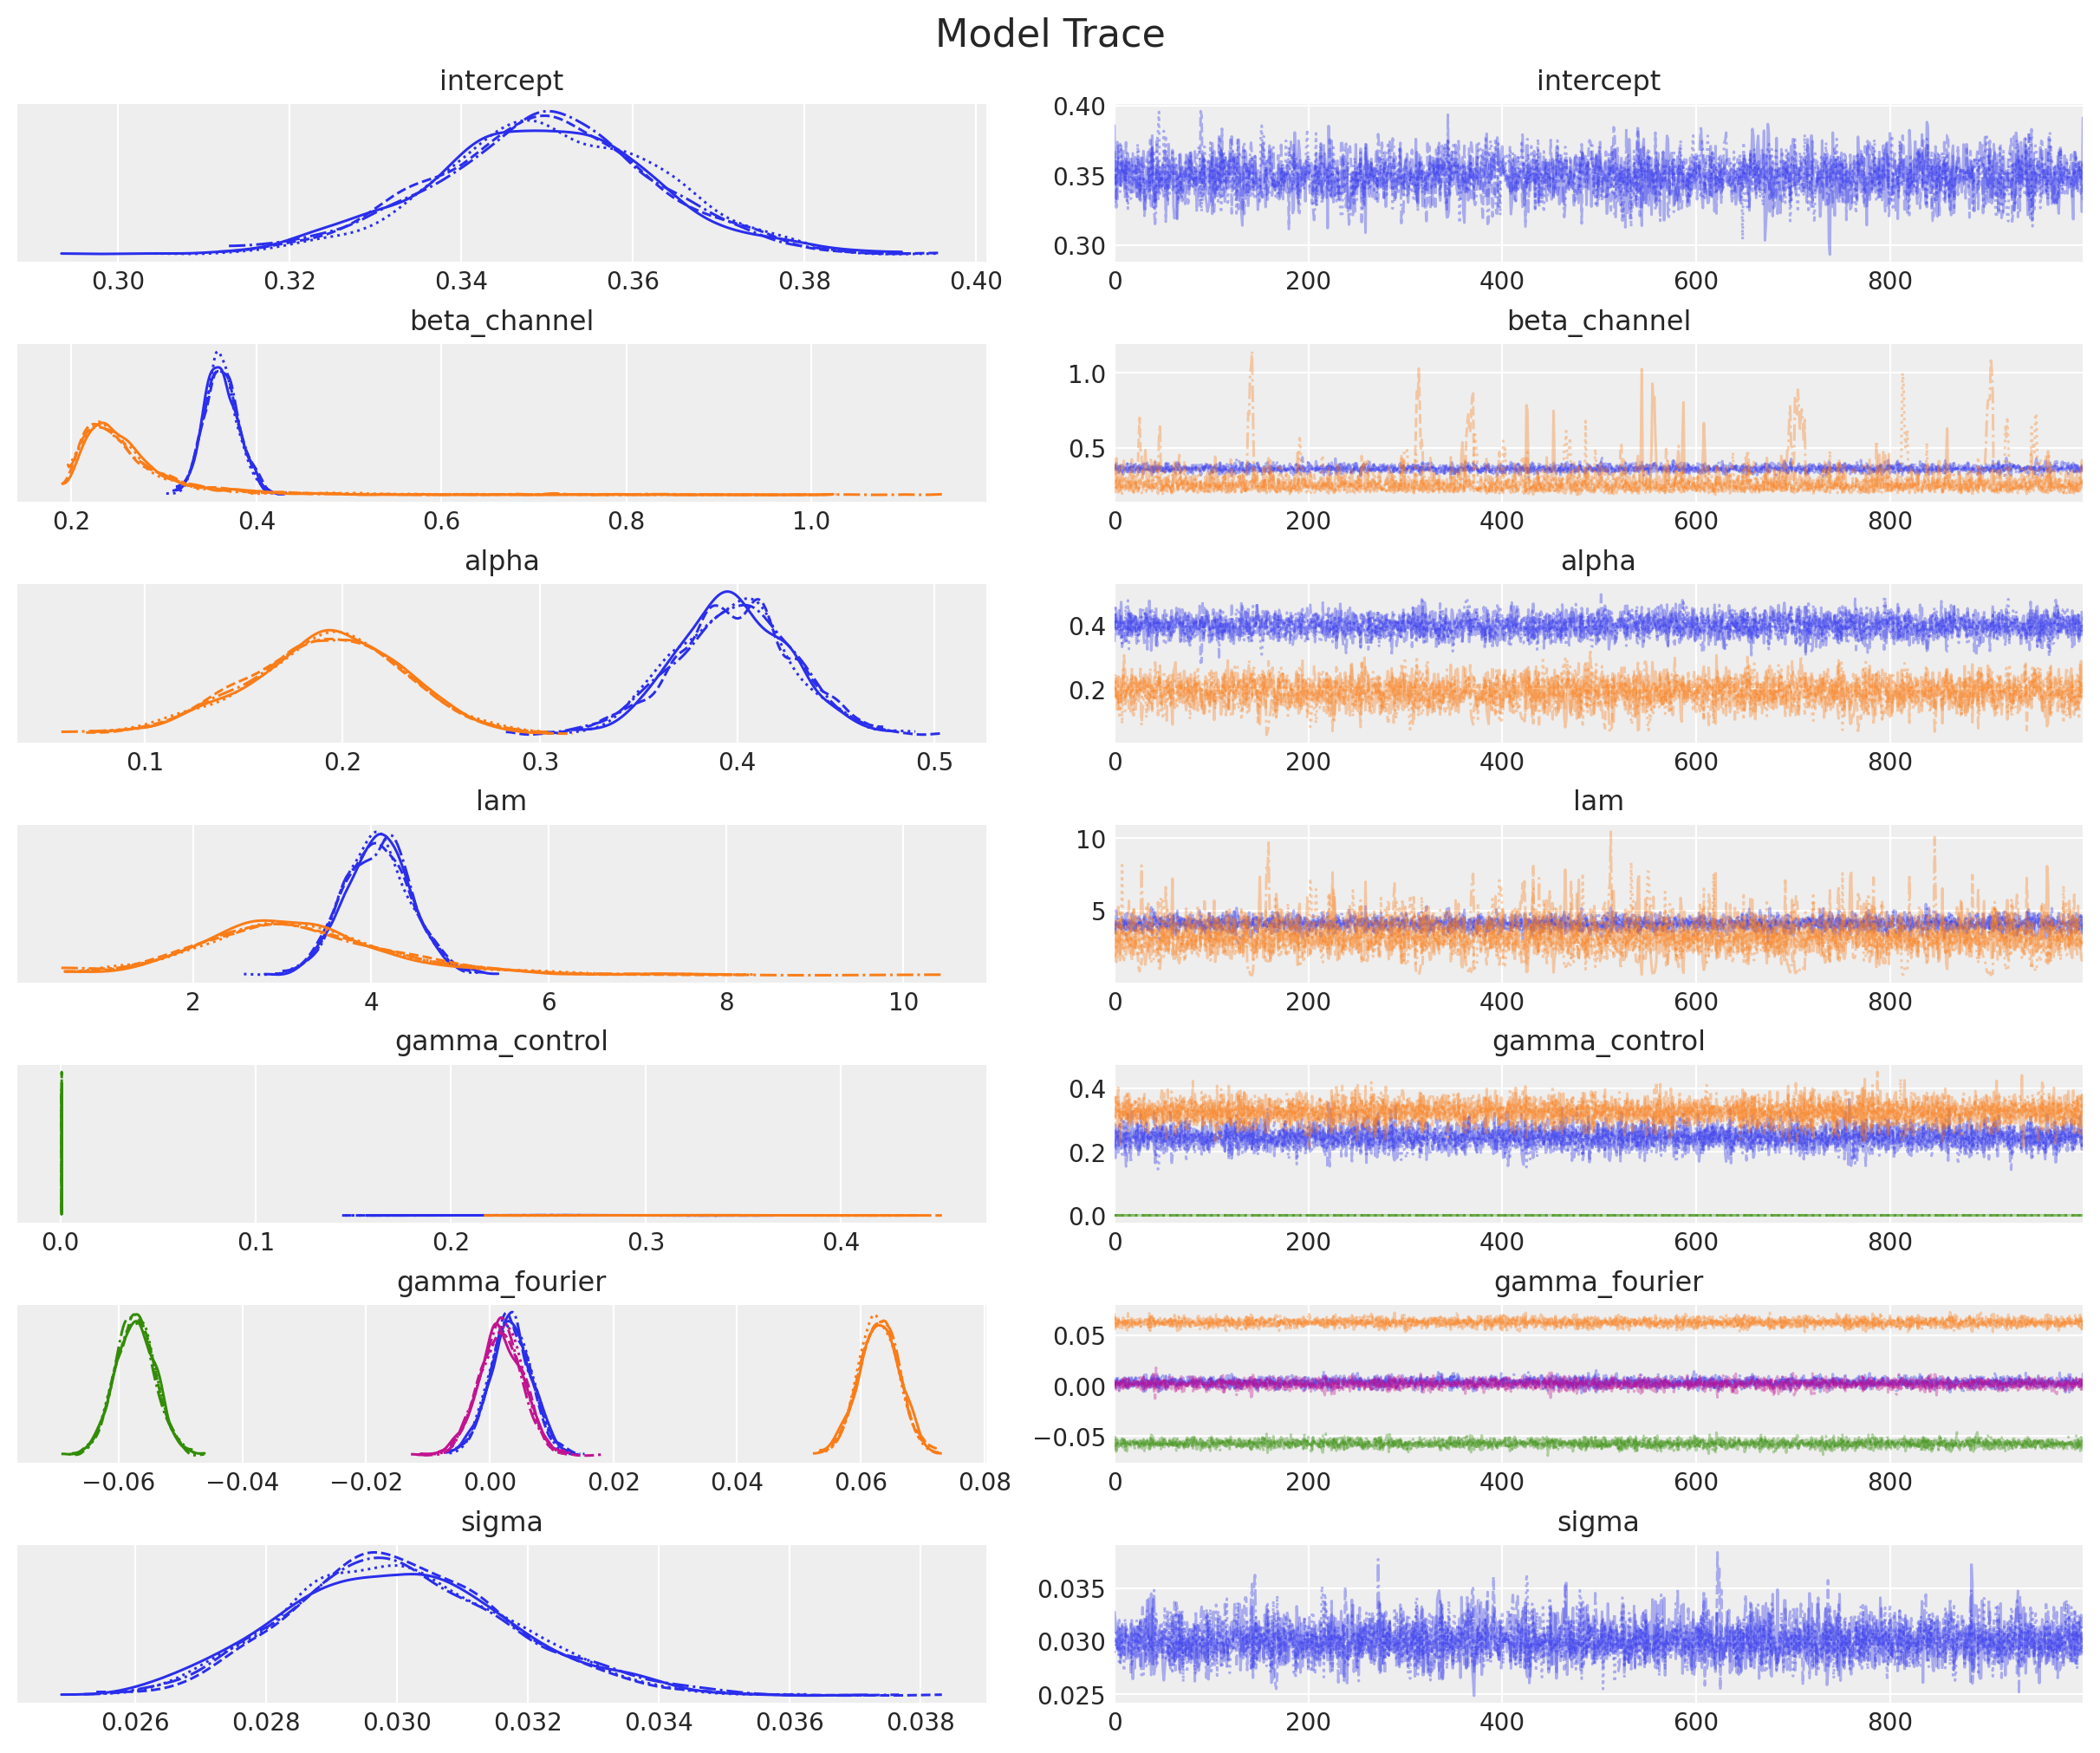
事後分布のプロットは以下のようにして出すことができます。r_hatもすべての係数で1.0となっておりトレースプロットも確認したところ安定した推移になっているようですので,収束したと判断することができるかと思います。
_ = az.plot_trace(
    data=mmm.fit_result,
    var_names=[
        "intercept",
        "beta_channel",
        "alpha",
        "lam",
        "gamma_control",
        "gamma_fourier",
        "sigma",
    ],
    compact=True,
    backend_kwargs={"figsize": (12, 10), "layout": "constrained"},
)
plt.gcf().suptitle("Model Trace", fontsize=16);
それでは事後予測分布を使ってyを予測してみましょう。
mmm.sample_posterior_predictive(X, extend_idata=True, combined=True)
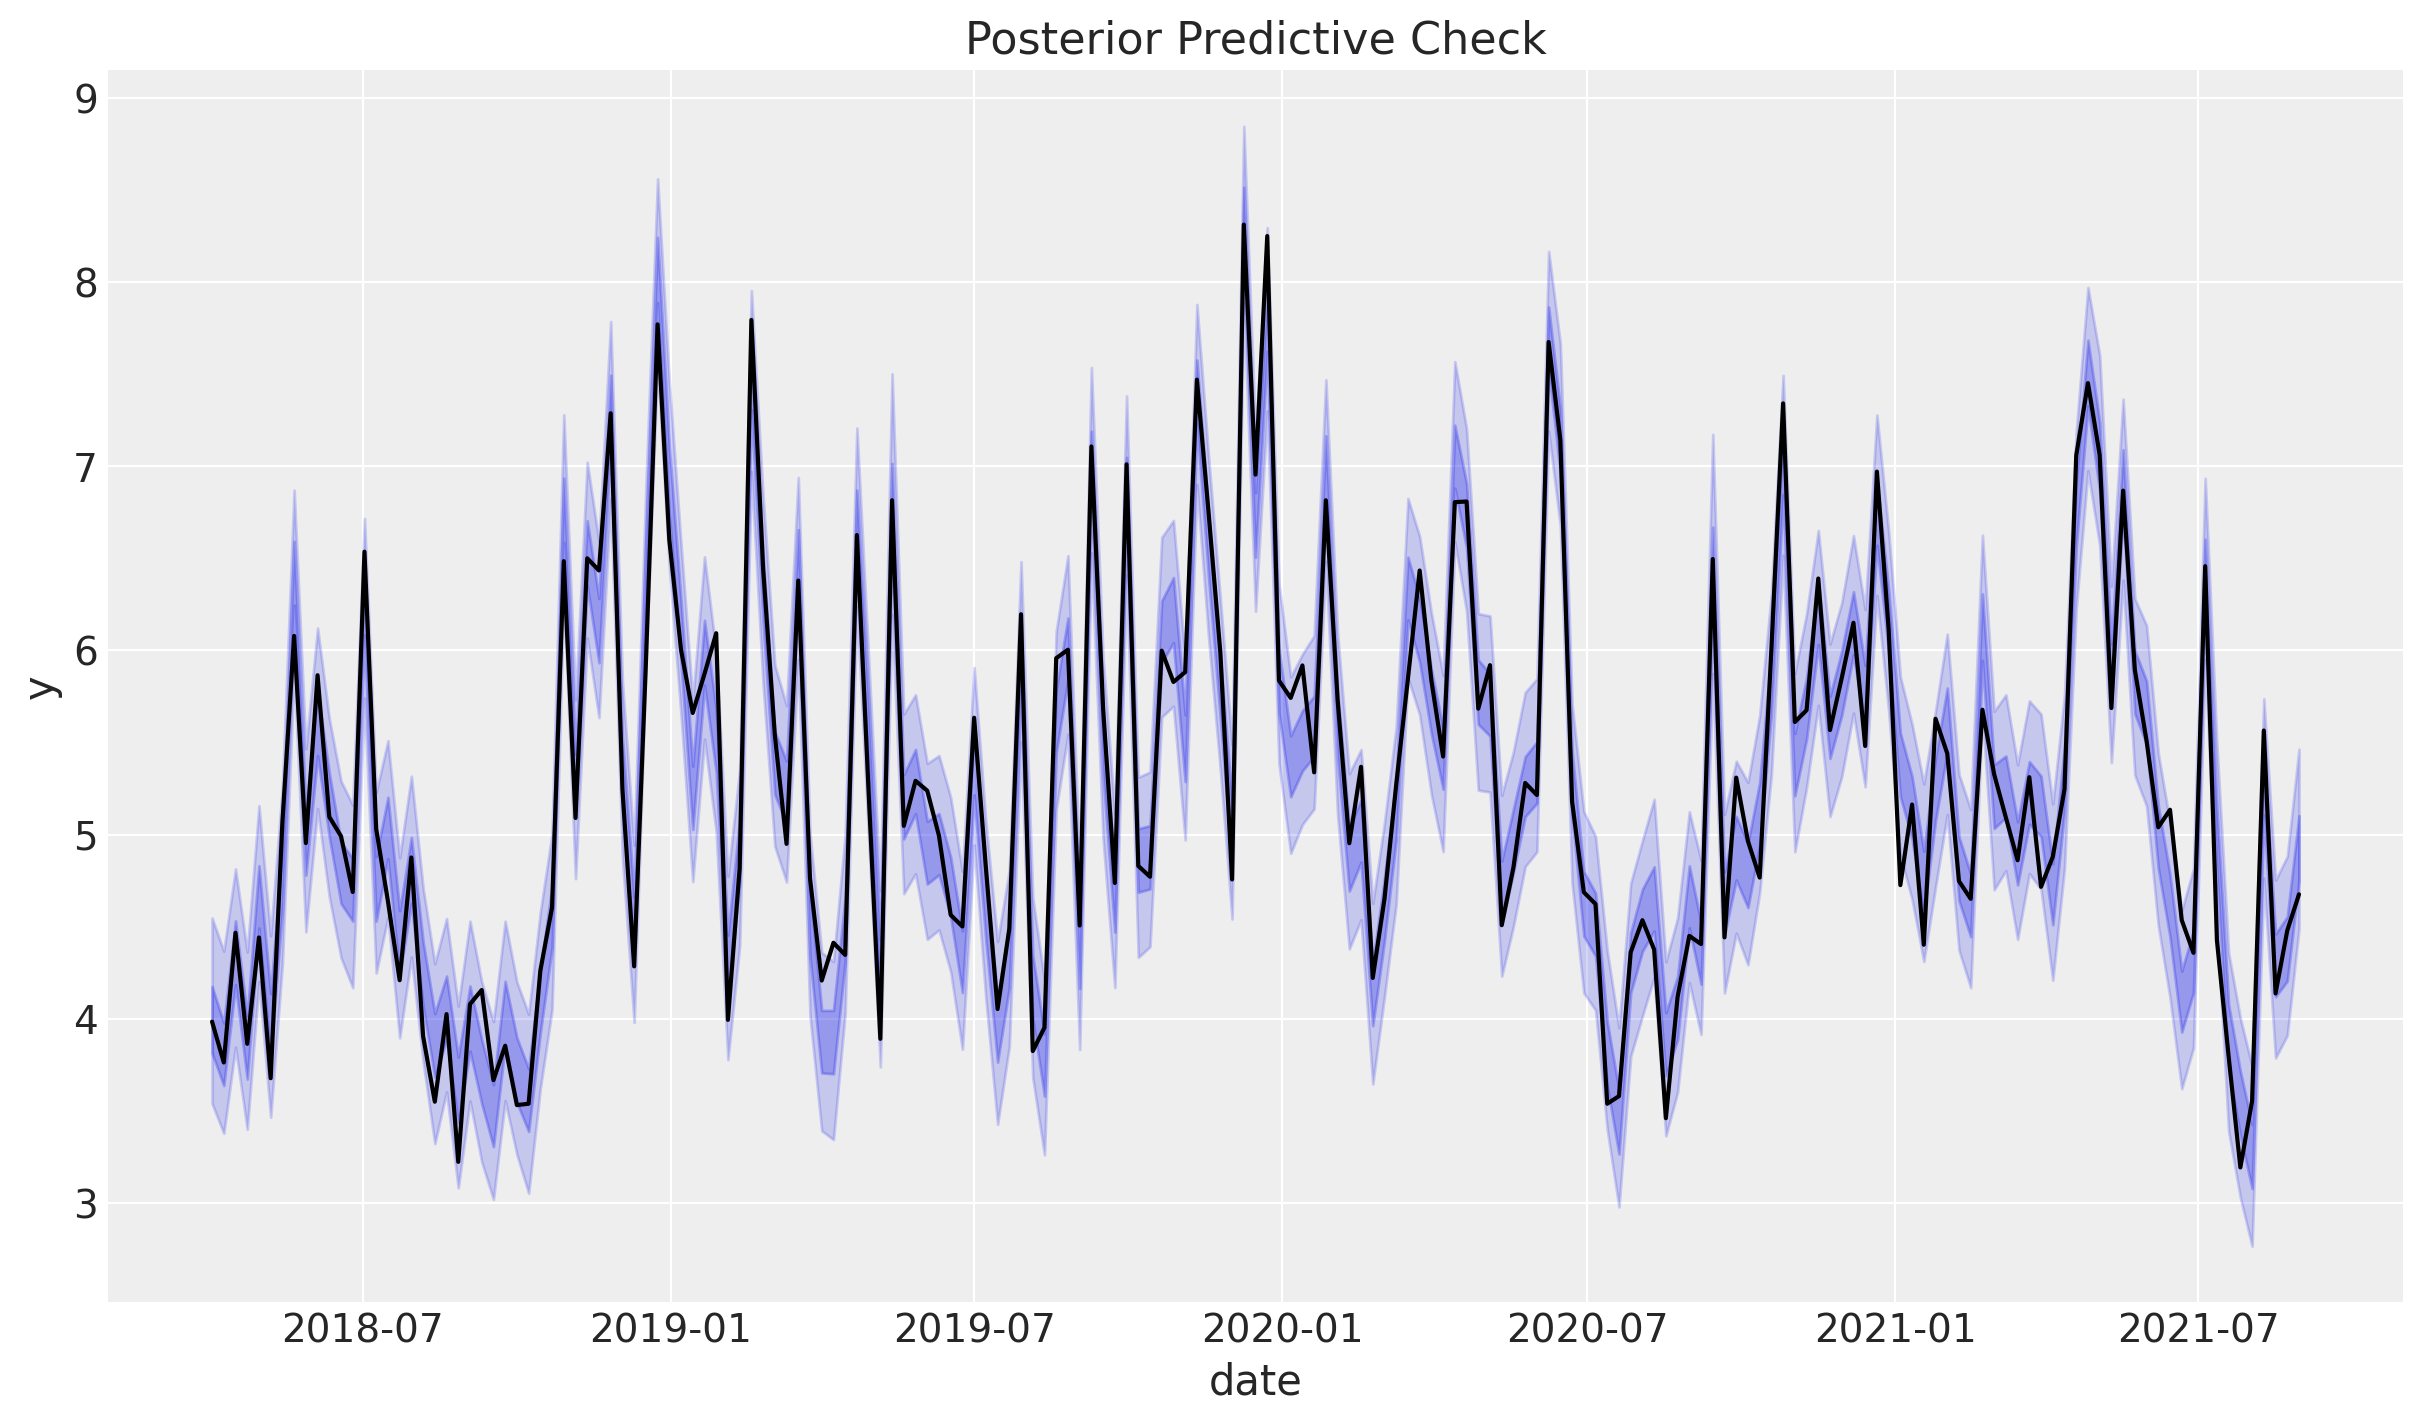
目的変数と予測の予実プロットは以下のとおりです。
mmm.plot_posterior_predictive(original_scale=True);
MAPEなどの指標を計算しておりませんが見た感じ(期待通り)すごくよくフィットしています。次に事後予測分布を各要素の事後予測分布に分解してみます。
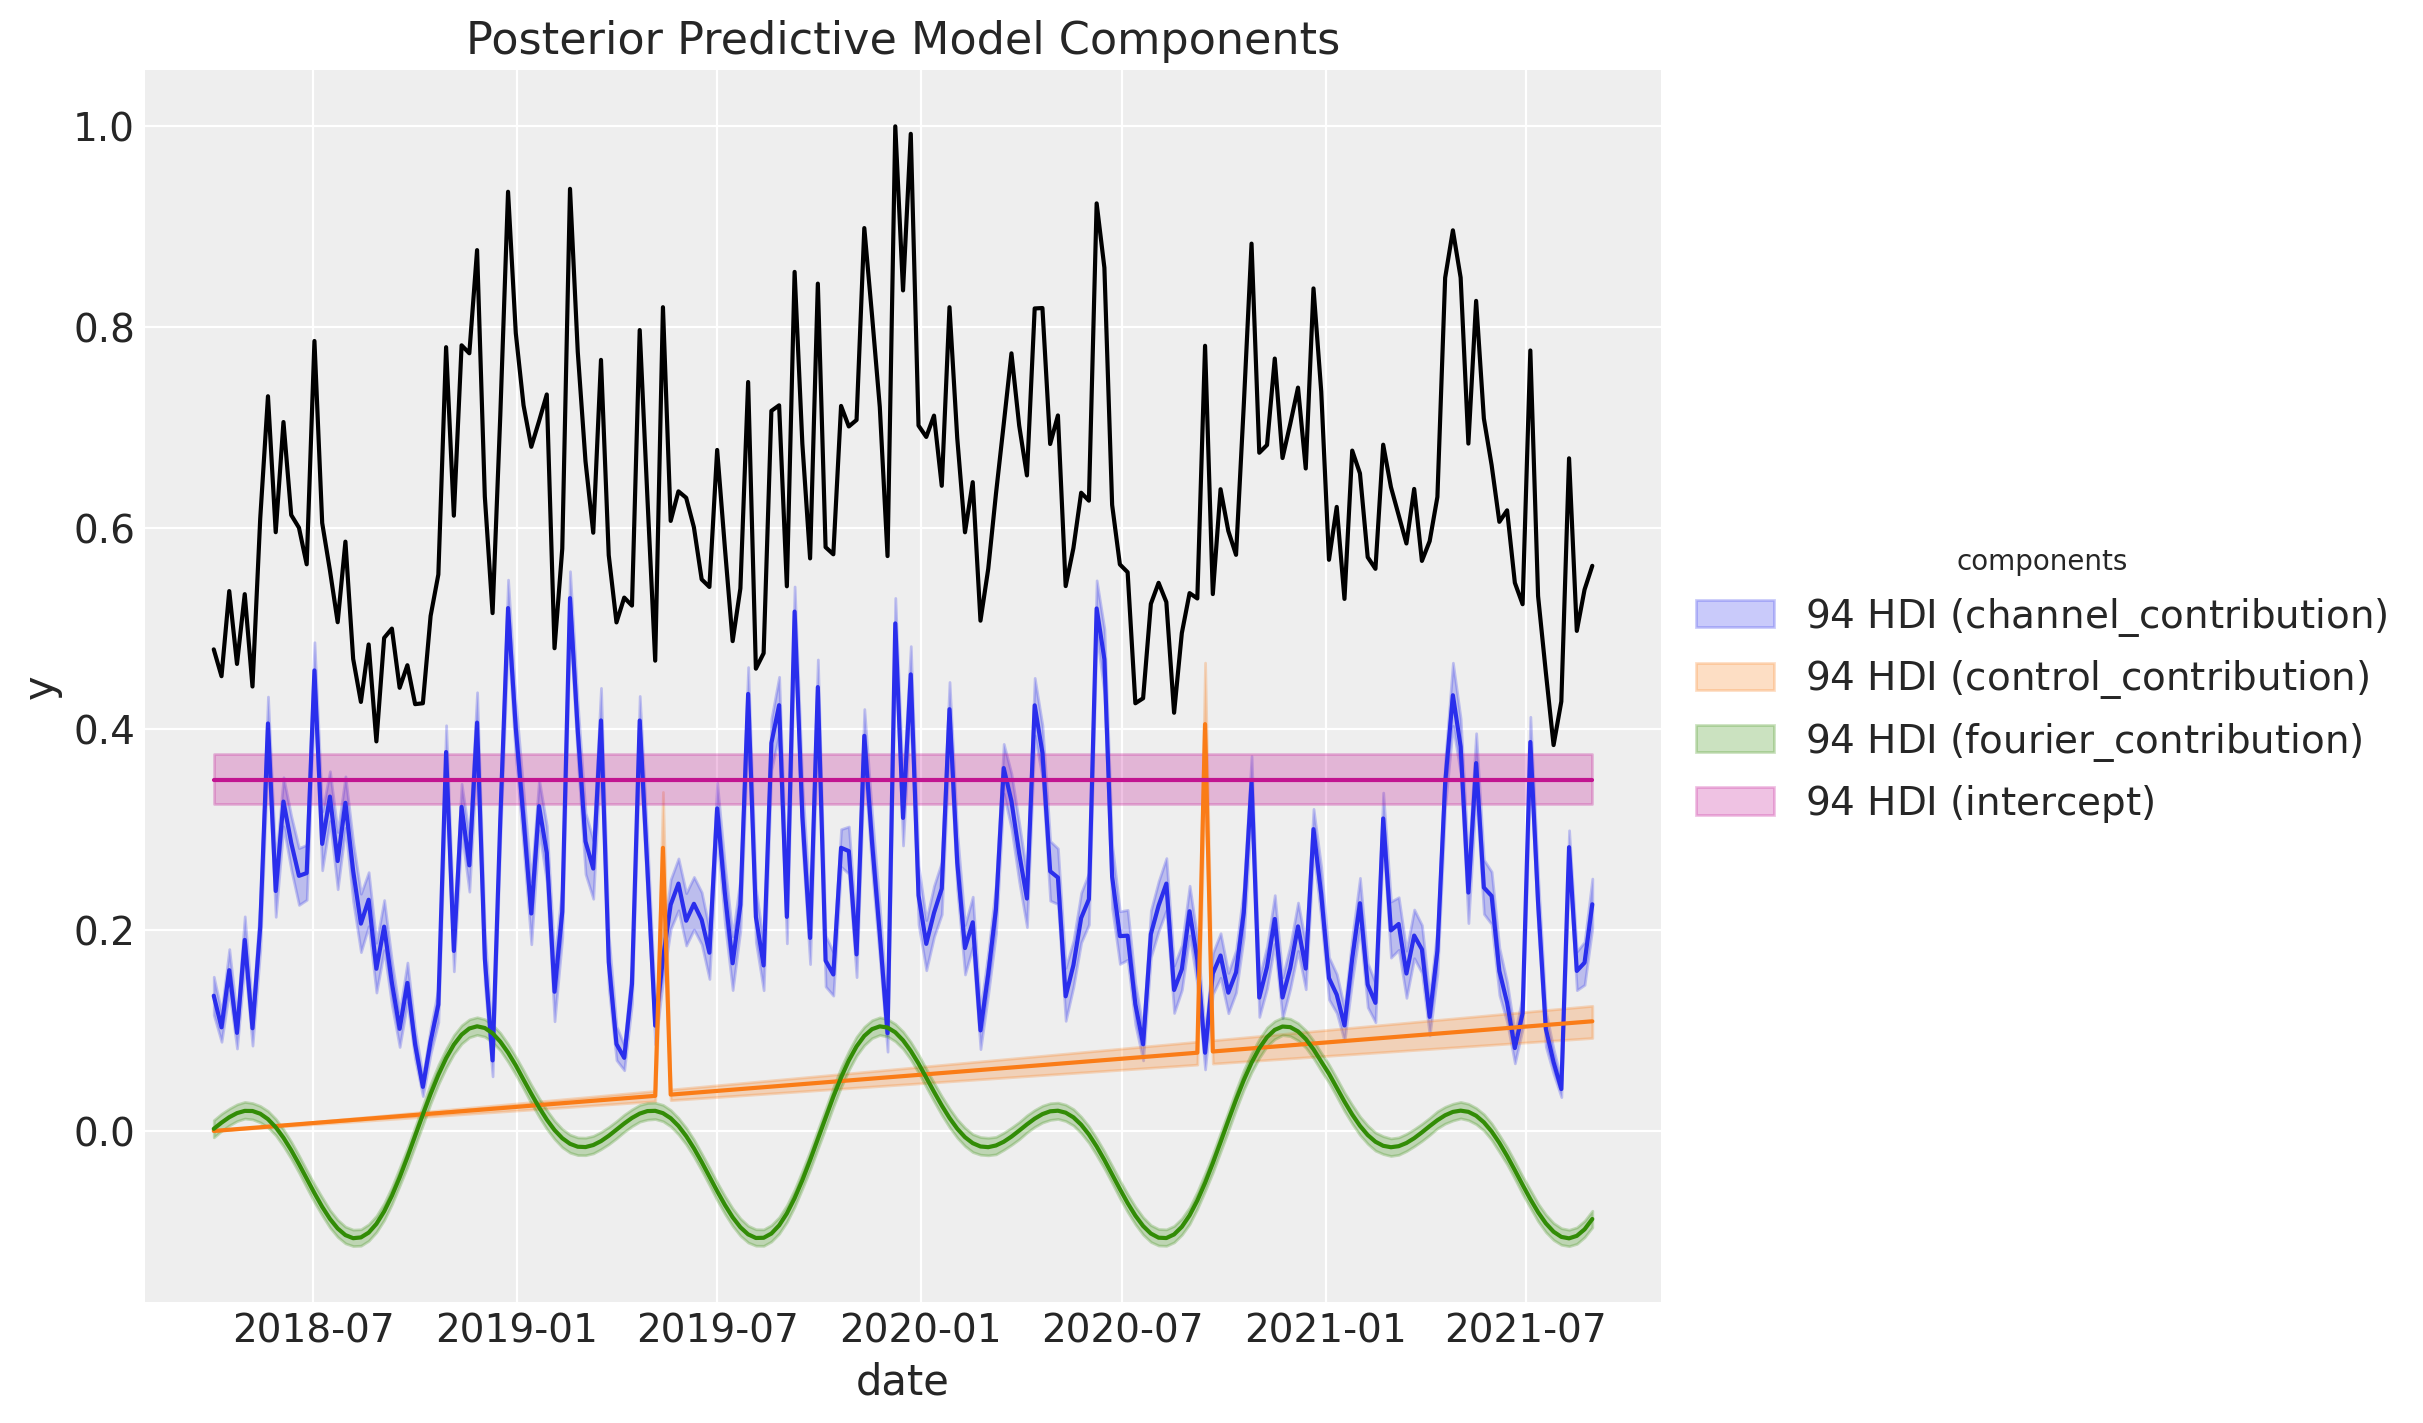
こちらもよくフィットしていることが確認できました。なお,これらの値はスケーリングされた値ですので,スケーリング前の値に復元したい場合は以下のコードを実行すると良いみたいです。
mmm.get_target_transformer()
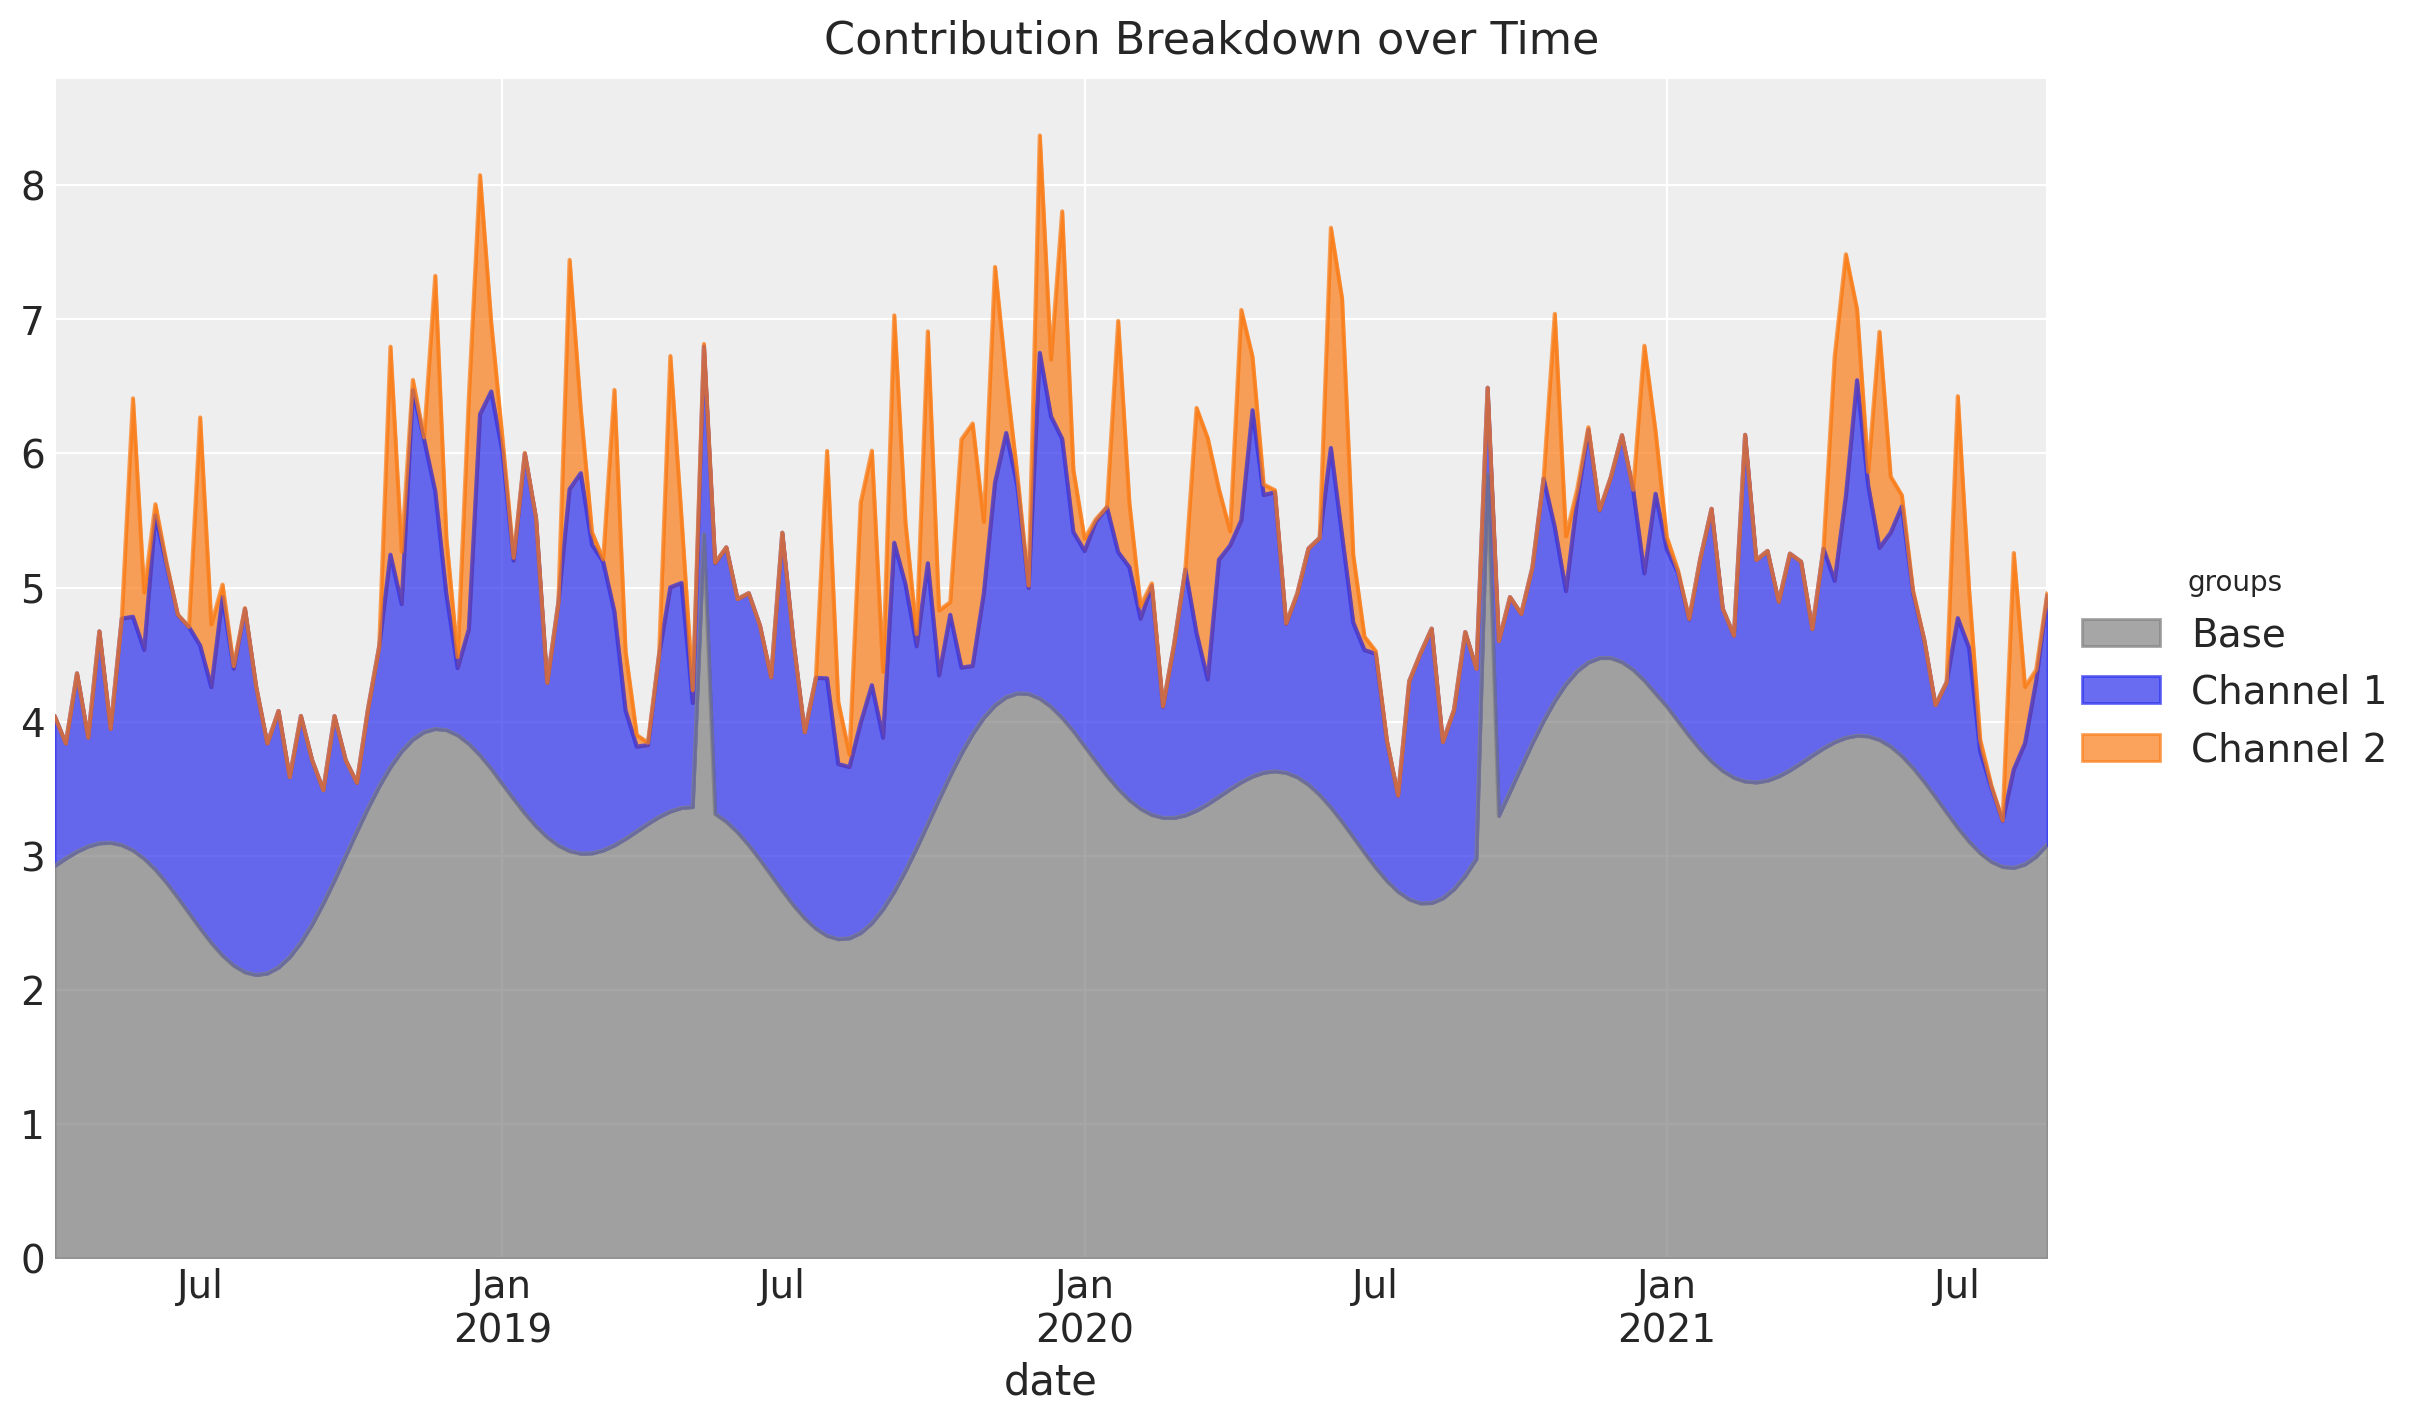
エリアプロットで貢献をチャンネル,ベースラインごとにプロットすることもできます。
こちらはチャンネルもしくはベースラインの寄与が厳密に正である場合のみ,プロットが活用できることに注意しましょう。0より小さい値を取ってしまうグループがあった場合はそのマイナス部分がプロットされない?というのが僕の解釈です。ソースコードは確認しておりません。
また,時間について整理した形での寄与度も出すことができます。
get_mean_contributions_over_time_df = mmm.compute_mean_contributions_over_time(
    original_scale=True
)

get_mean_contributions_over_time_df.head()
メディアパラメータ
広告に関するパラメータについて,真の値と事後分布を見比べてみます。まずはadstock effectについてです。
fig = mmm.plot_channel_parameter(param_name="alpha", figsize=(9, 5))
ax = fig.axes[0]
ax.axvline(x=alpha1, color="C0", linestyle="--", label=r"$\alpha_1$")
ax.axvline(x=alpha2, color="C1", linestyle="--", label=r"$\alpha_2$")
ax.legend(loc="upper right");
事後分布はバイオリンプロットで表されており真の値を近似できているということができます。
次にsaturation effectのパラメータを確認します。
fig = mmm.plot_channel_parameter(param_name="lam", figsize=(9, 5))
ax = fig.axes[0]
ax.axvline(x=lam1, color="C0", linestyle="--", label=r"$\lambda_1$")
ax.axvline(x=lam2, color="C1", linestyle="--", label=r"$\lambda_2$")
ax.legend(loc="upper right");
x2のlam2について信用区間が広いのは,「0か1か」というx2のデータ作成ロジックから理解できると思います。
メディアに関する(Deep-Diveな)洞察
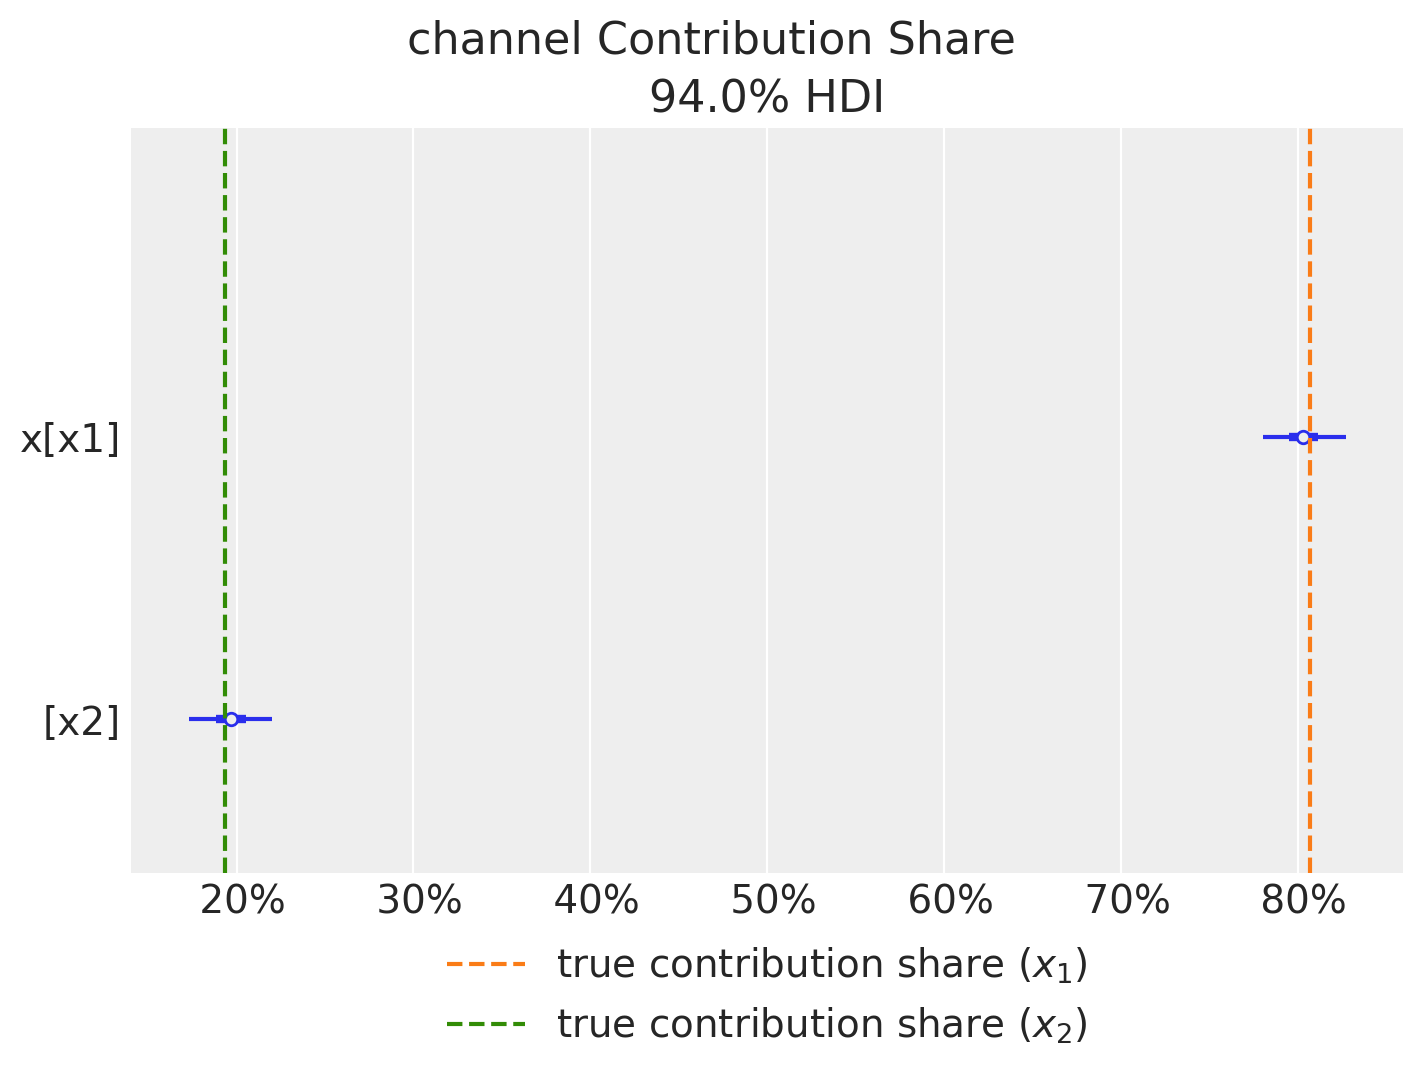
このプロットから,チャンネルの売上への貢献度シェアをプロットします。真の値とほぼ同じような値を取ることができています。
fig = mmm.plot_channel_contribution_share_hdi(figsize=(7, 5))
ax = fig.axes[0]
ax.axvline(
    x=contribution_share_x1,
    color="C1",
    linestyle="--",
    label="true contribution share ($x_1$)",
)
ax.axvline(
    x=contribution_share_x2,
    color="C2",
    linestyle="--",
    label="true contribution share ($x_2$)",
)
ax.legend(loc="upper center", bbox_to_anchor=(0.5, -0.05), ncol=1);
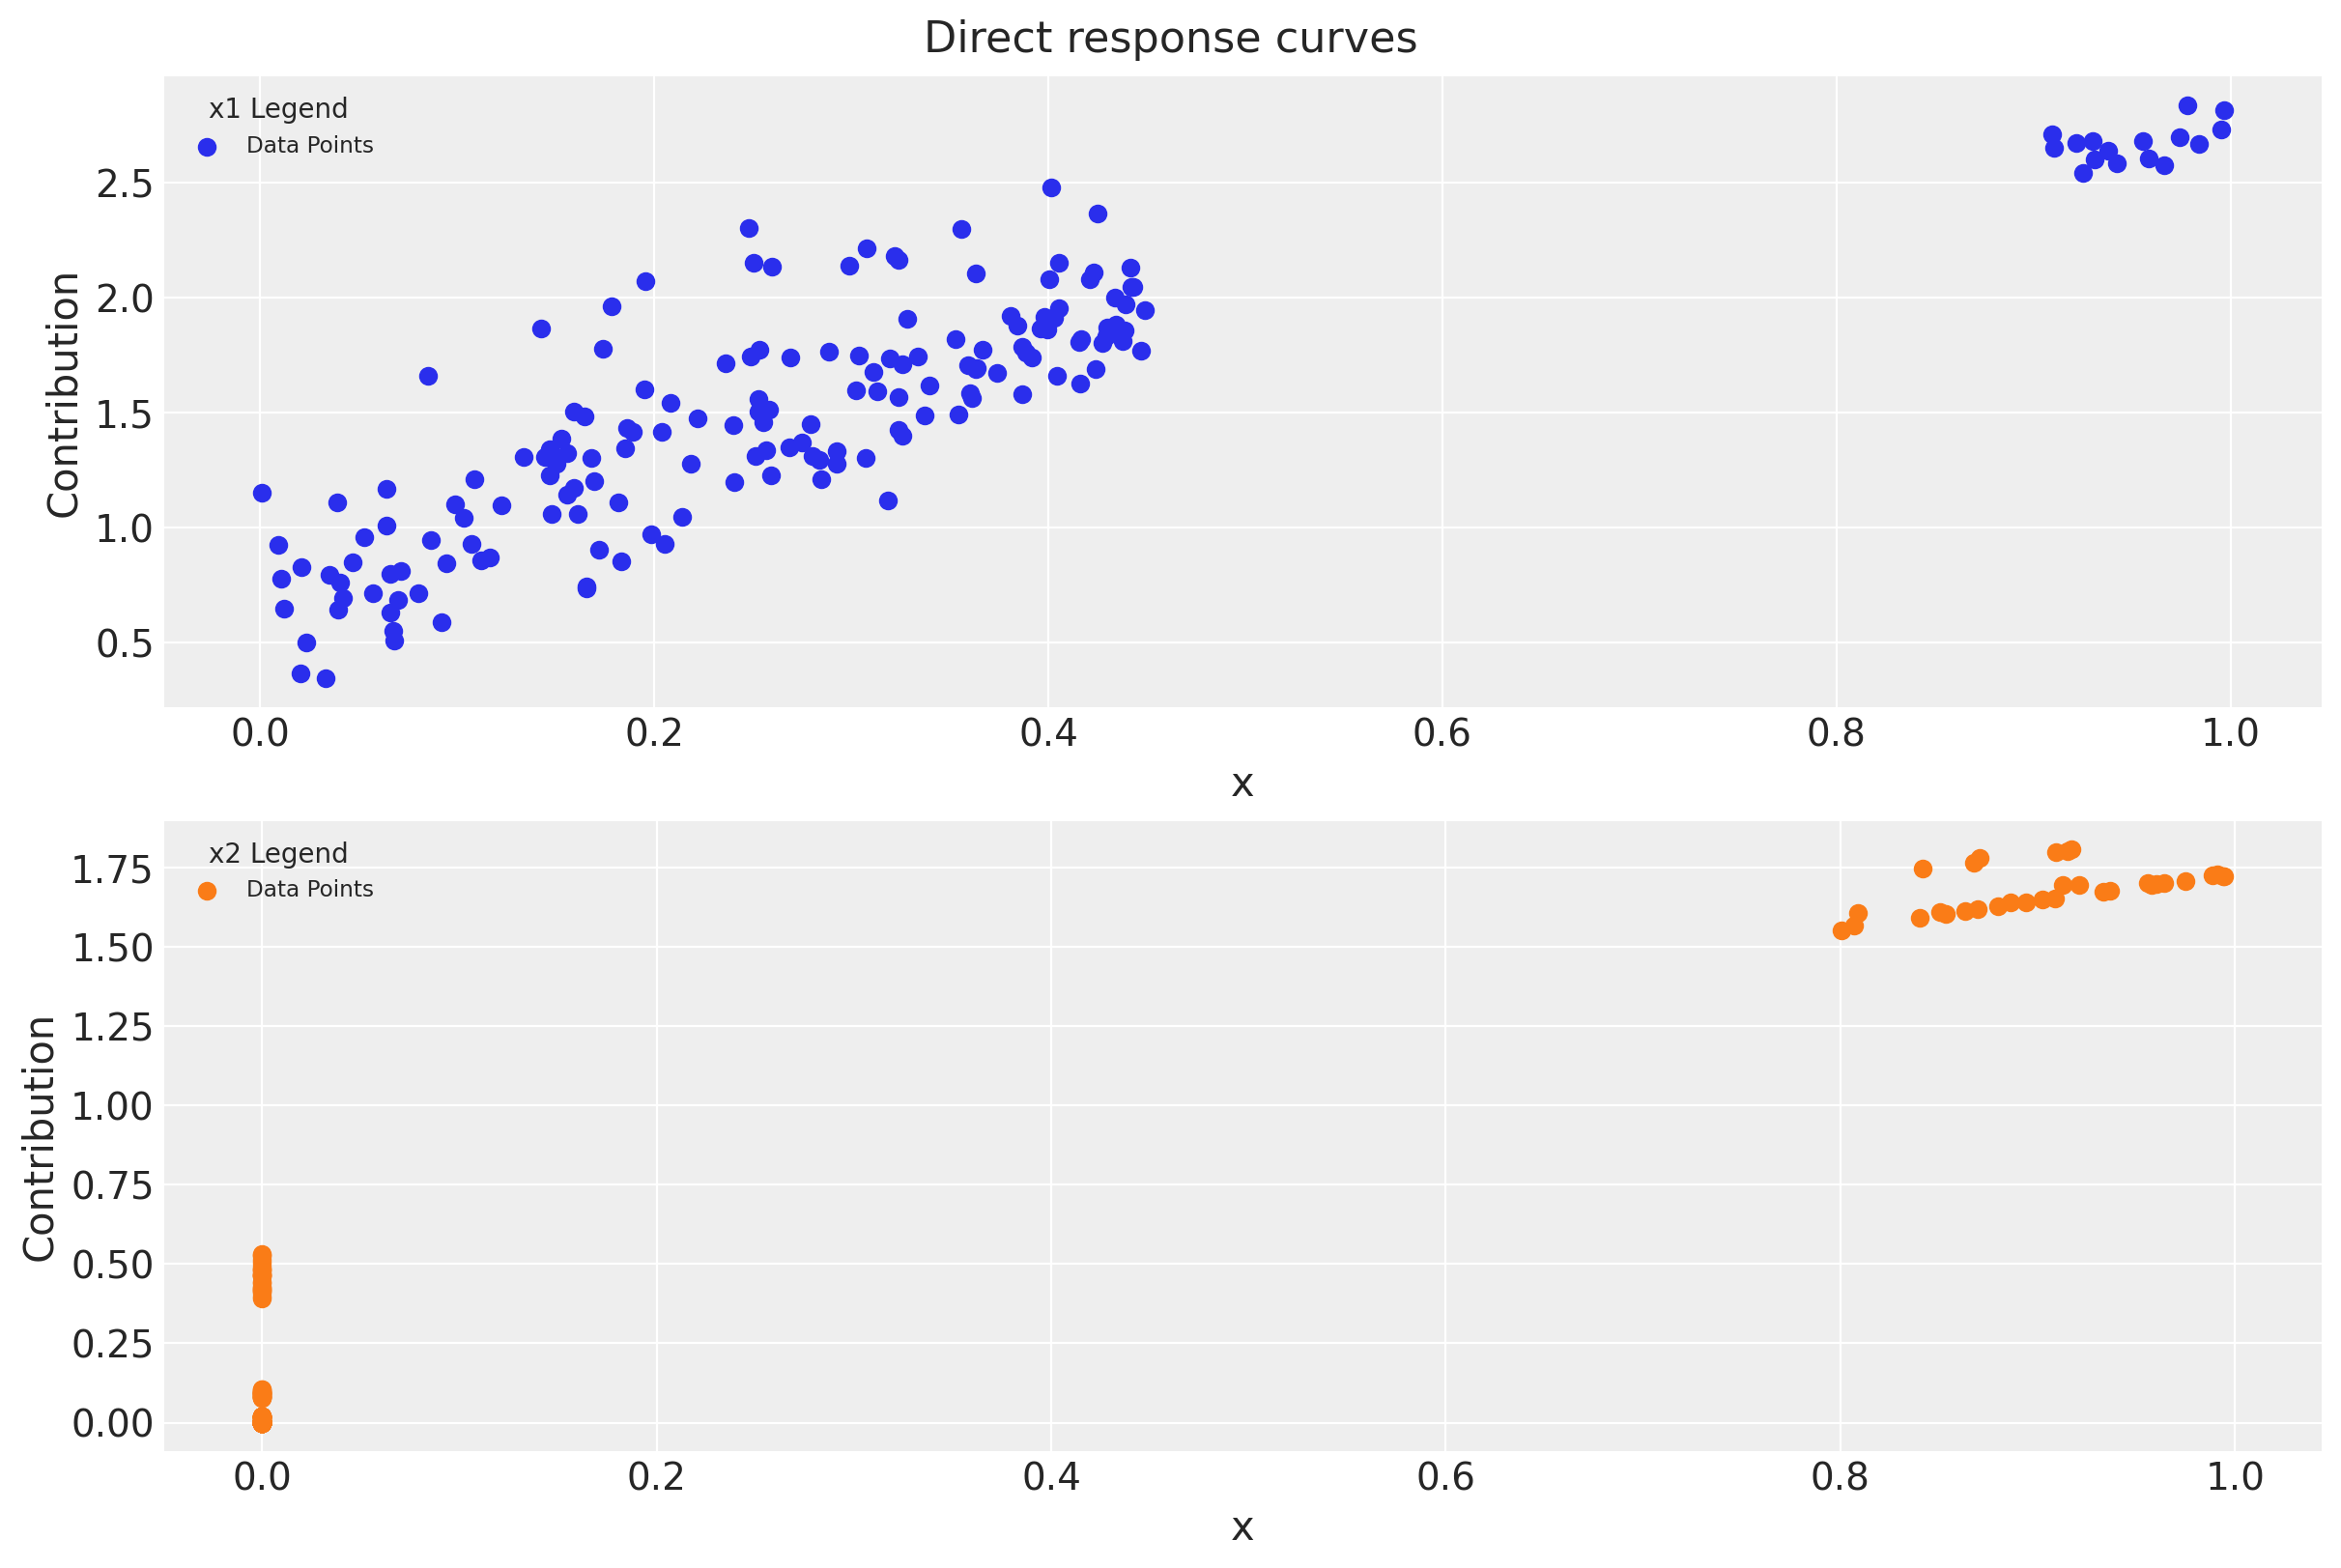
次に,目的変数への相対的な貢献度をプロットします。まずはデータ点で表したものです。
fig = mmm.plot_direct_contribution_curves()
[ax.set(xlabel="x") for ax in fig.axes];
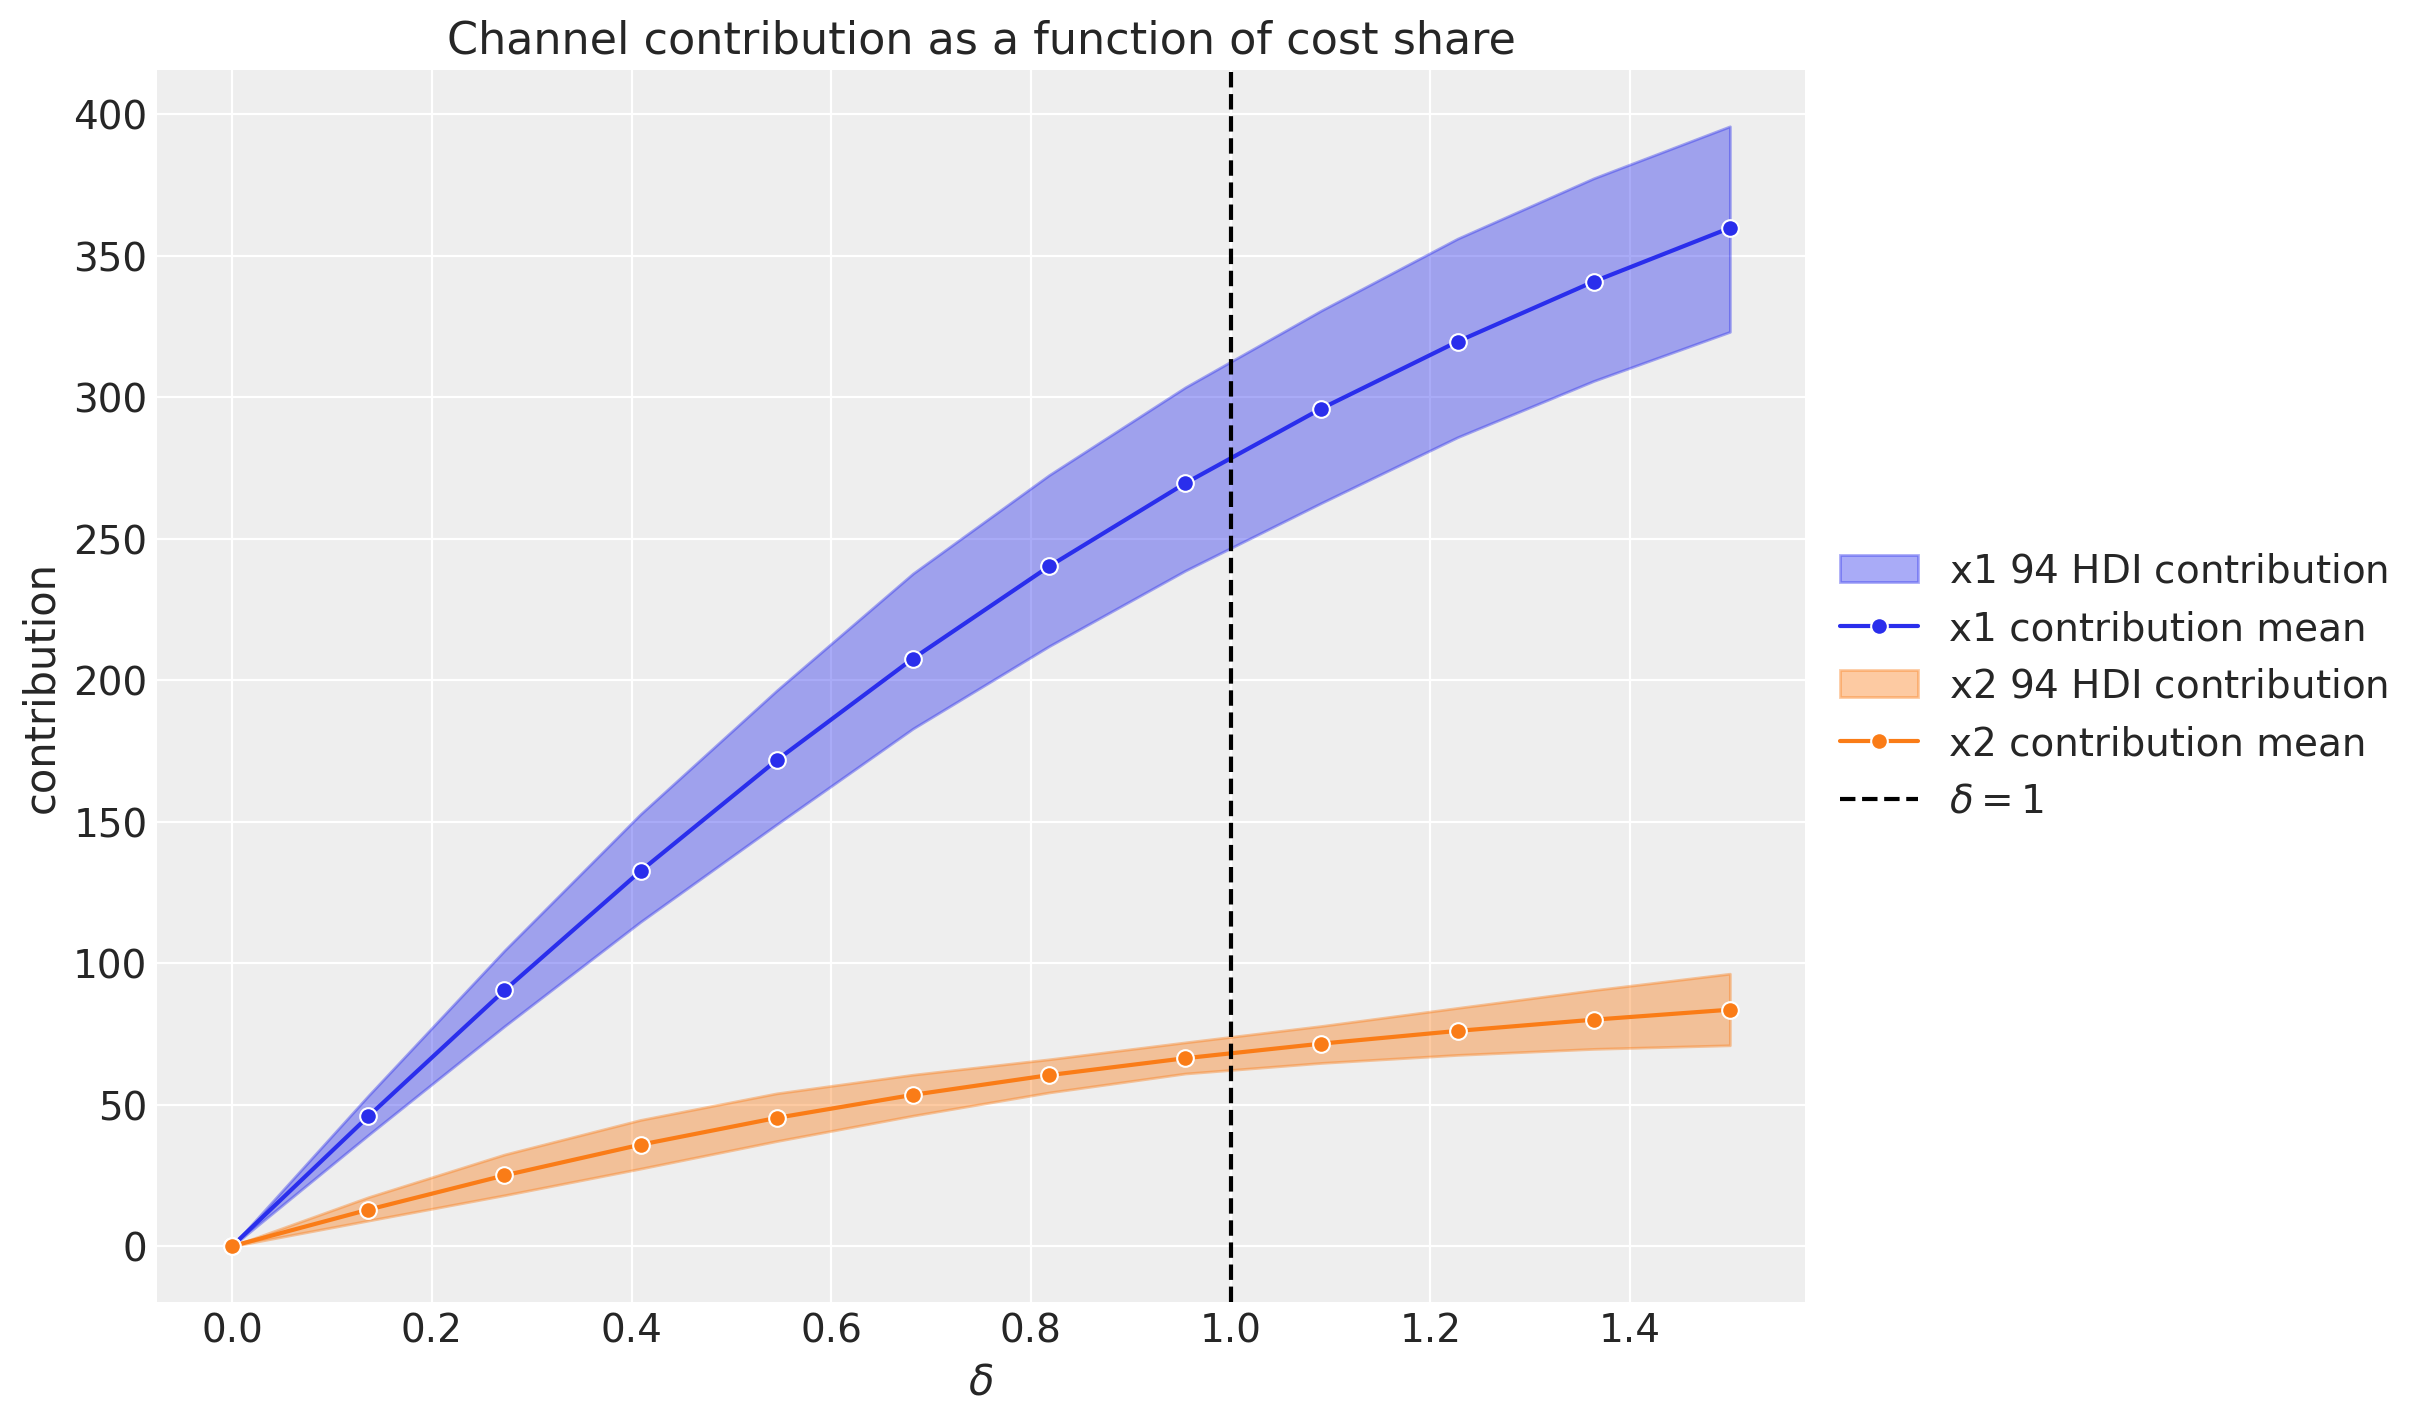
次に,「支出レベルごとのチャンネル貢献度」でプロットします。ドキュメントでは,遅延を考慮したメディアの寄与の総和を計算するのは難しいと言及され,その代替案としてこちらのプロットが挙げられています。$\delta=1$が現在の支出レベルで,$\delta=1.5$が$\delta=1$のときよりも50%支出が増加していることを示します。支出レベルそのときどきのメディアの貢献度を示していることがわかります。
mmm.plot_channel_contributions_grid(start=0, stop=1.5, num=12)
この図から以下の二点がわかります。
- このプロットではadstockとsaturationを考慮している(グラフの形状から)
- 支出がゼロのとき,貢献はゼロである。(仮に過去に支出があった場合その遅延効果が現れることもあり,この限りではない)
これらのグリッド値は,メディア支出の最適化ステップの入力となるようです。が,今回はこの辺りの実装を詰めておらずまた今度ということで…
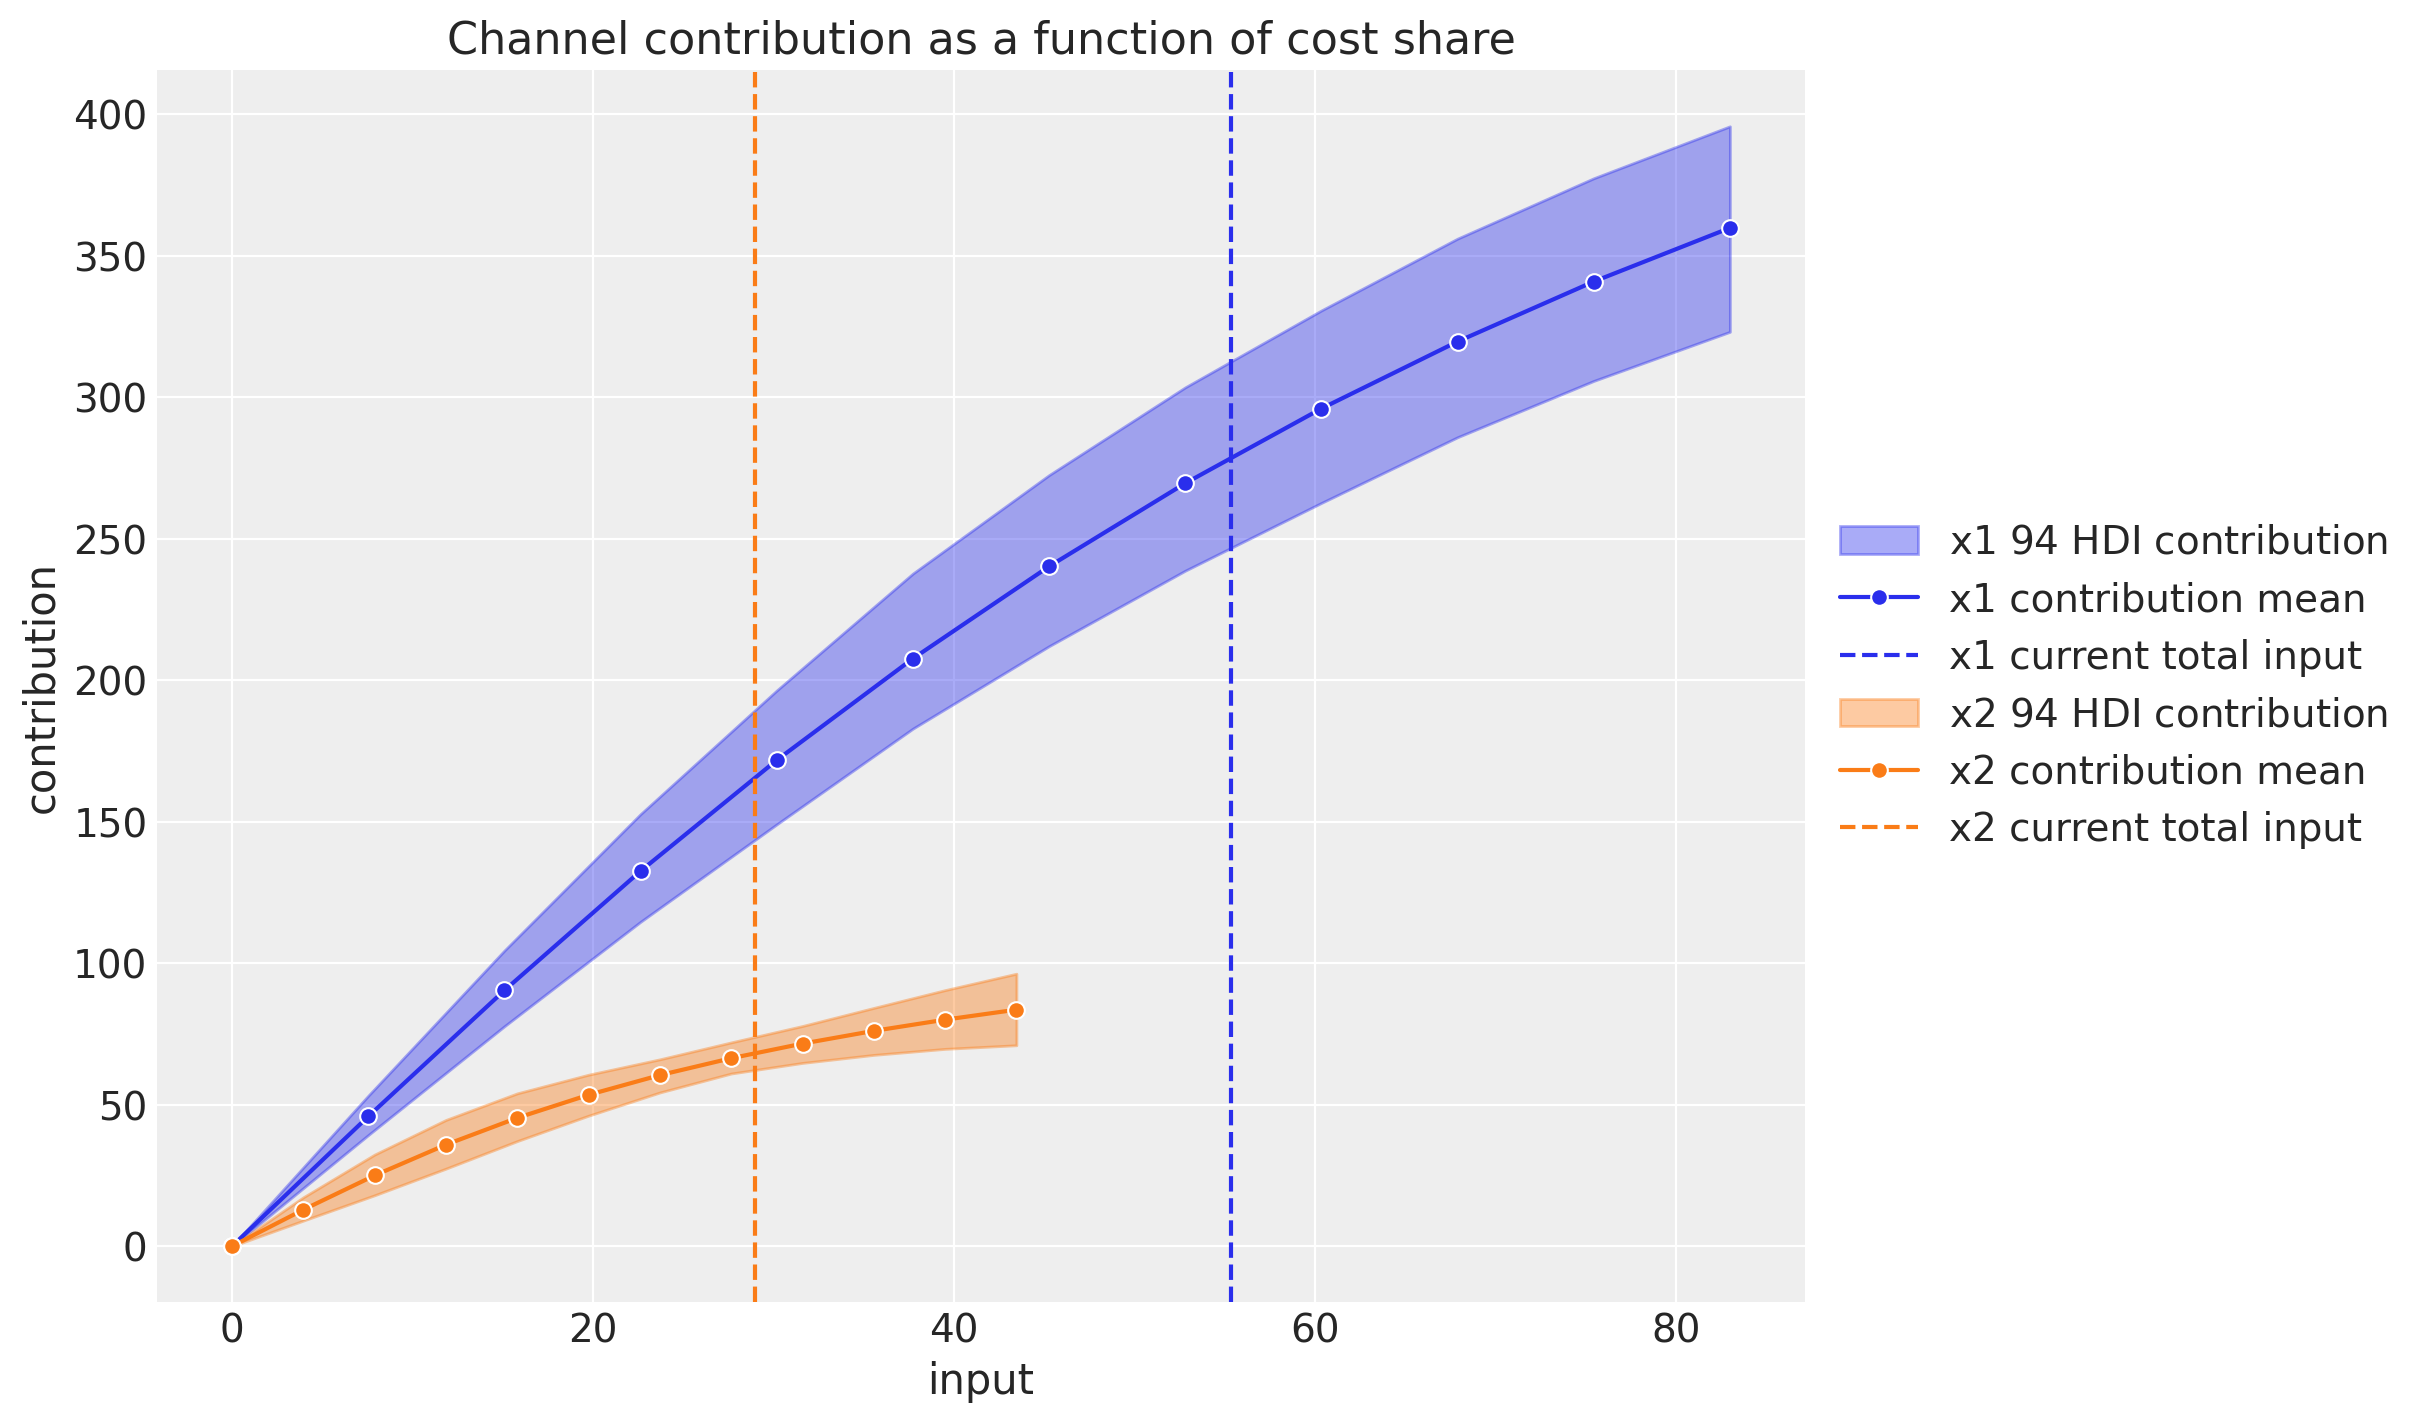
同じようなチャンネル貢献度に関するプロットを,データの入力数をx軸にしてプロットすることもできます。
mmm.plot_channel_contributions_grid(start=0, stop=1.5, num=12, absolute_xrange=True);
x2のほうがデータ作成時の条件が厳しかったため,インプットの数は少なくなっています。
メディア貢献の再現
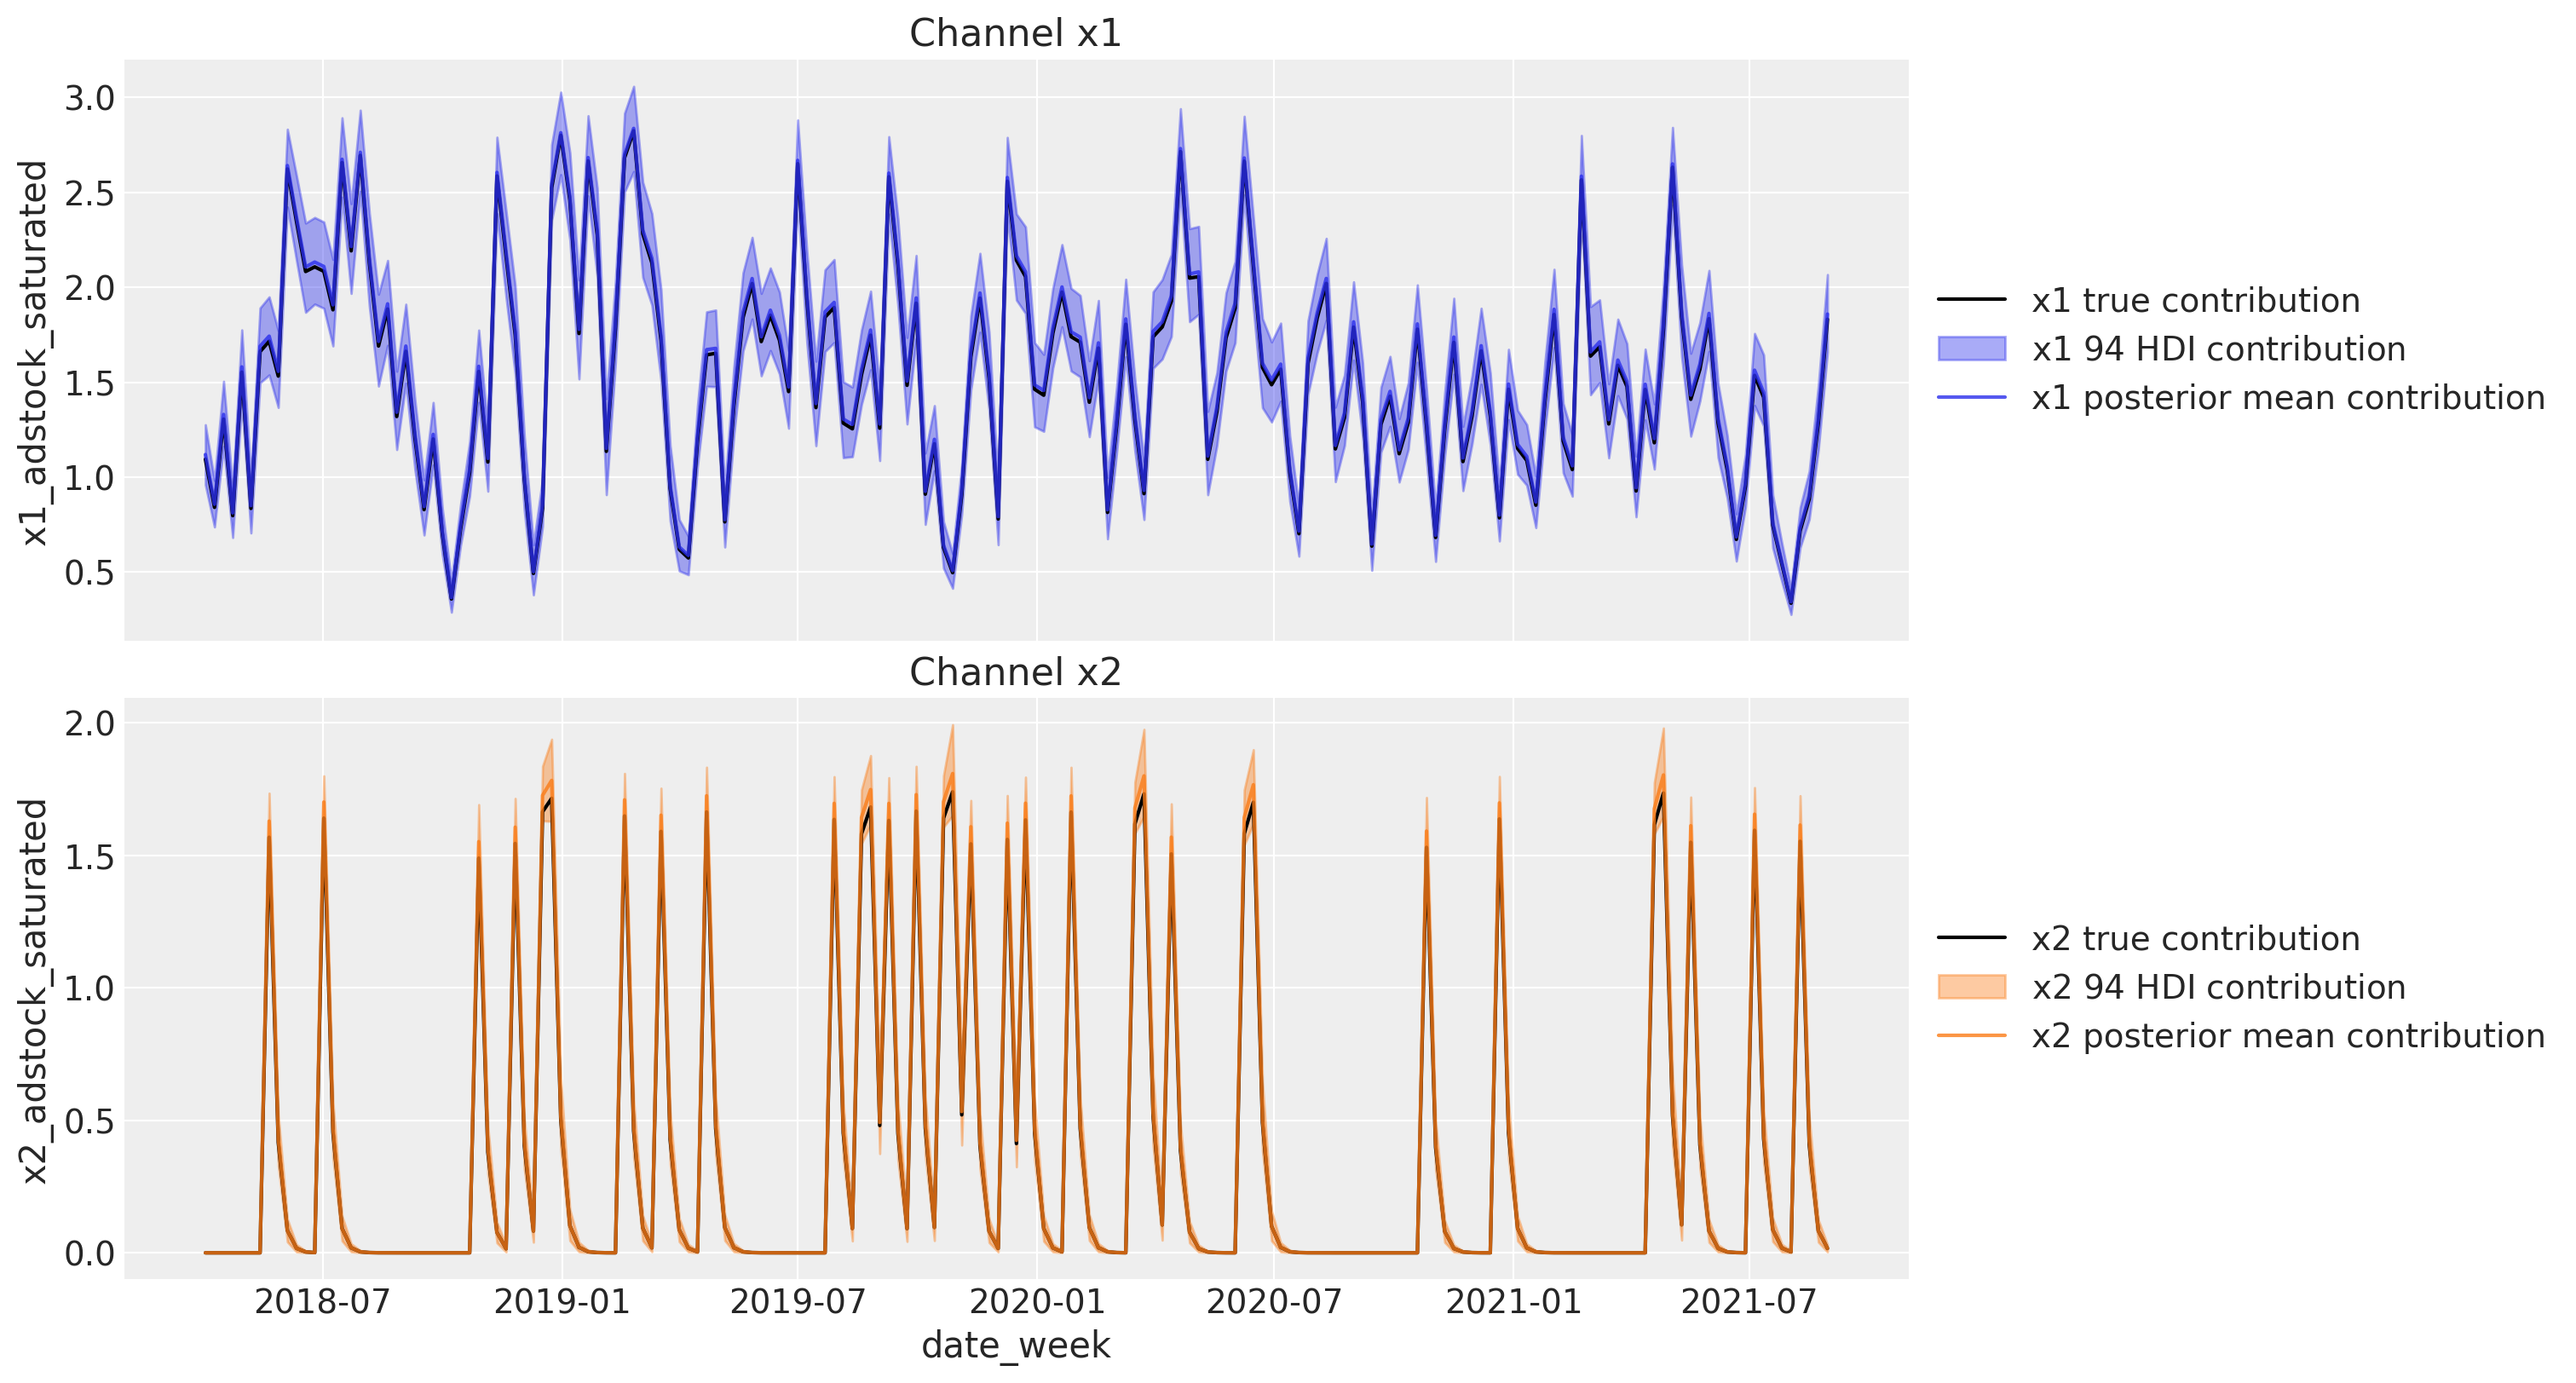
時間を基準にして目的変数に対する各チャンネルの貢献度も算出することができます。つまり本当のメディア貢献度のデータを再現することができるということになります。
channels_contribution_original_scale = mmm.compute_channel_contribution_original_scale()
channels_contribution_original_scale_hdi = az.hdi(
    ary=channels_contribution_original_scale
)

fig, ax = plt.subplots(
    nrows=2, figsize=(15, 8), ncols=1, sharex=True, sharey=False, layout="constrained"
)

for i, x in enumerate(["x1", "x2"]):
    # Estimate true contribution in the original scale from the data generating process
    sns.lineplot(
        x=df["date_week"],
        y=amplitude * betas[i] * df[f"{x}_adstock_saturated"],
        color="black",
        label=f"{x} true contribution",
        ax=ax[i],
    )
    # HDI estimated contribution in the original scale
    ax[i].fill_between(
        x=df["date_week"],
        y1=channels_contribution_original_scale_hdi.sel(channel=x)["x"][:, 0],
        y2=channels_contribution_original_scale_hdi.sel(channel=x)["x"][:, 1],
        color=f"C{i}",
        label=f"{x} $94%$ HDI contribution",
        alpha=0.4,
    )
    # Mean estimated contribution in the original scale
    sns.lineplot(
        x=df["date_week"],
        y=get_mean_contributions_over_time_df[x].to_numpy(),
        color=f"C{i}",
        label=f"{x} posterior mean contribution",
        alpha=0.8,
        ax=ax[i],
    )
    ax[i].legend(loc="center left", bbox_to_anchor=(1, 0.5))
    ax[i].set(title=f"Channel {x}")
ROAS
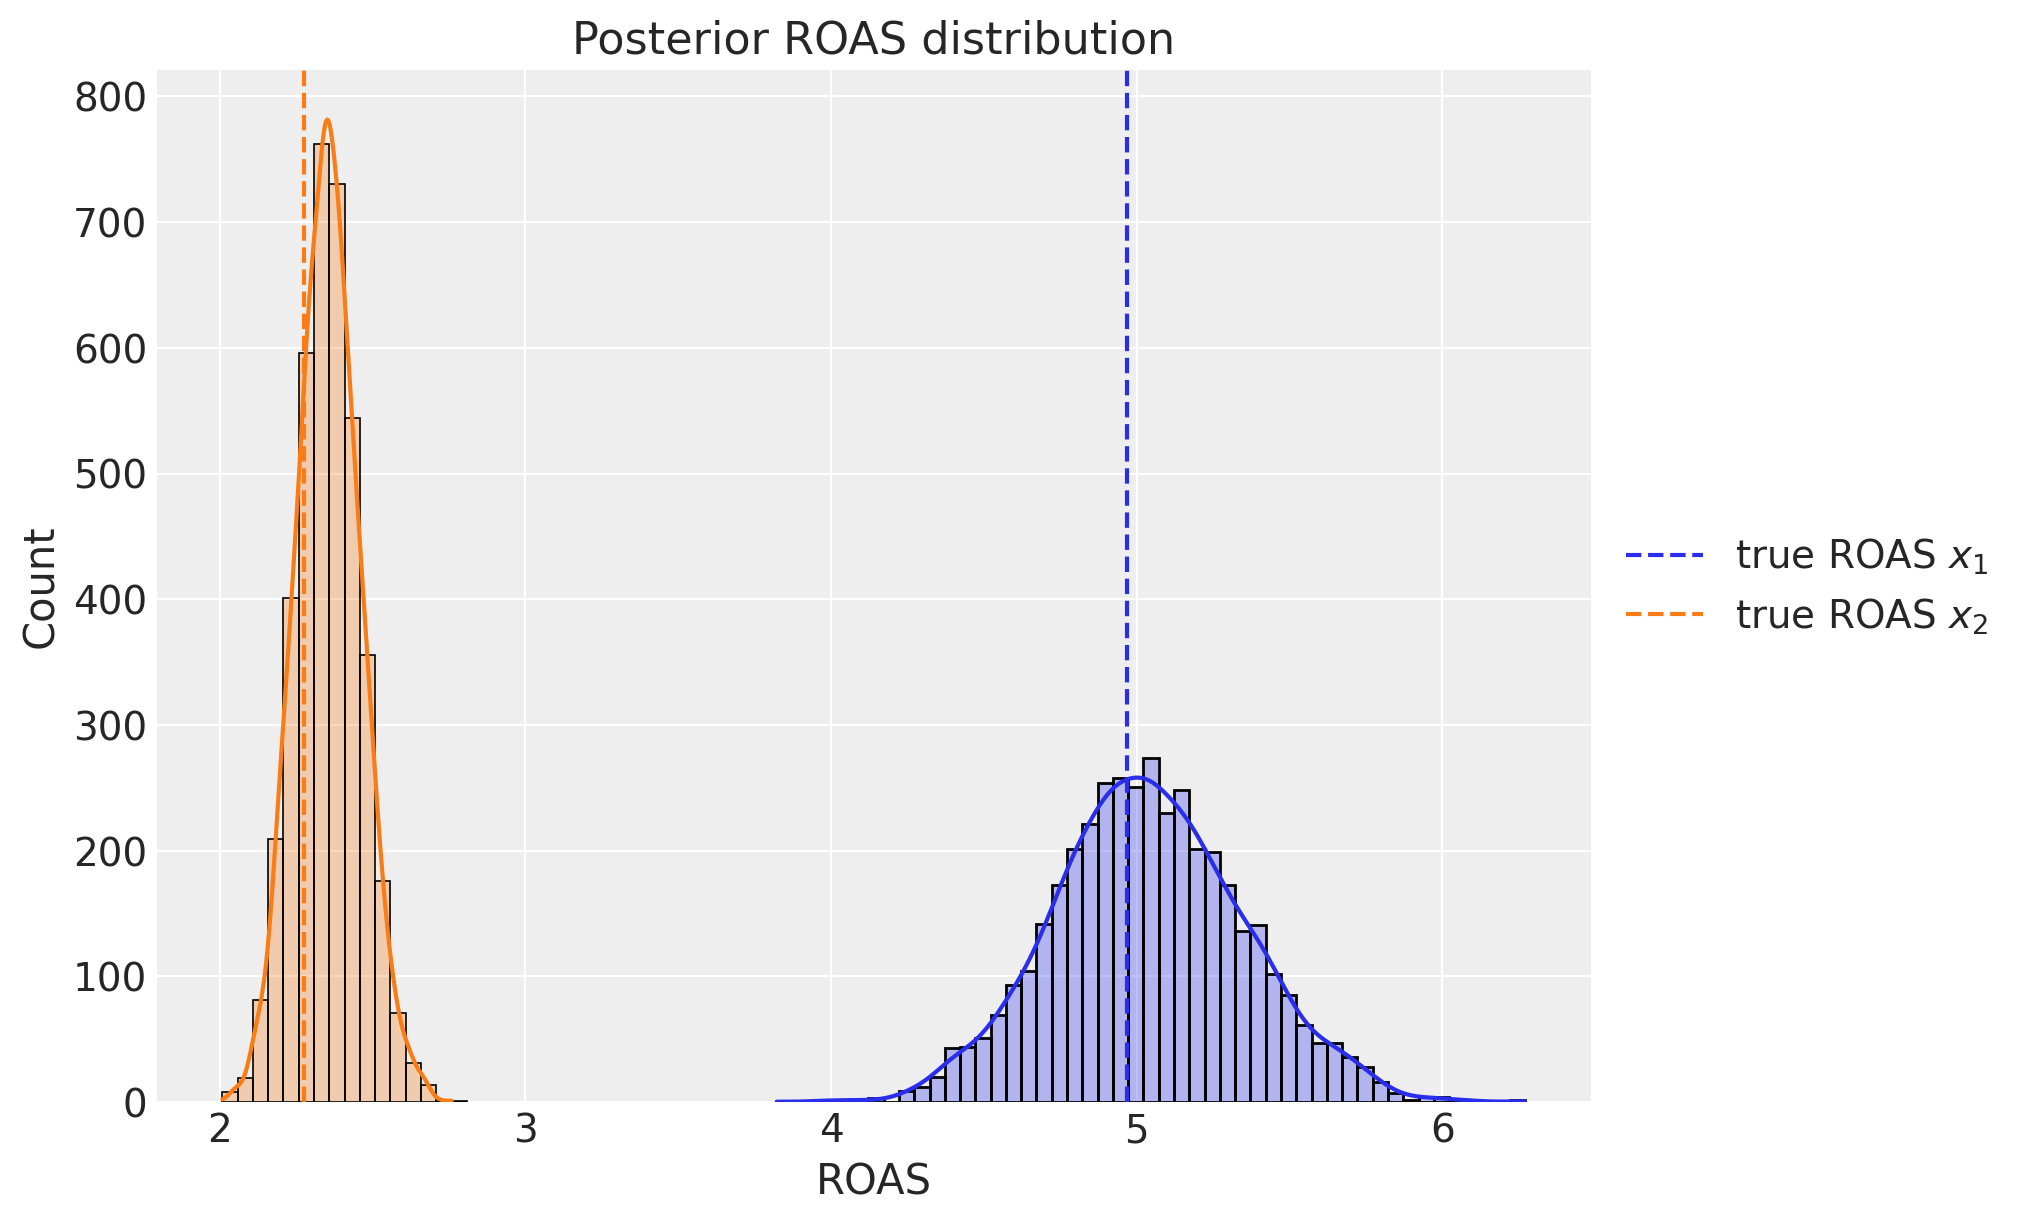
最後に,(近似的ではありますが)ROASを各チャンネルごとに計算します。
channel_contribution_original_scale = mmm.compute_channel_contribution_original_scale()

roas_samples = (
    channel_contribution_original_scale.stack(sample=("chain", "draw")).sum("date")
    / data[["x1", "x2"]].sum().to_numpy()[..., None]
)

fig, ax = plt.subplots(figsize=(10, 6))
sns.histplot(
    roas_samples.sel(channel="x1").to_numpy(), binwidth=0.05, alpha=0.3, kde=True, ax=ax
)
sns.histplot(
    roas_samples.sel(channel="x2").to_numpy(), binwidth=0.05, alpha=0.3, kde=True, ax=ax
)
ax.axvline(x=roas_1, color="C0", linestyle="--", label=r"true ROAS $x_{1}$")
ax.axvline(x=roas_2, color="C1", linestyle="--", label=r"true ROAS $x_{2}$")
ax.legend(loc="center left", bbox_to_anchor=(1, 0.5))
ax.set(title="Posterior ROAS distribution", xlabel="ROAS");
ROAS(広告の費用対効果)の事後分布の結果について,事後平均のあたりに真の値が来ていることがわかり,それぞれのROASをしっかりと推定できていることがわかります。事後分布の結果から,x1の広告の方が費用対効果が良いことがわかります。
おわりに
最後まで読んでいただきありがとうございました。今回はドキュメントのノートブックに沿ってMMMを実装してみました。
ところどころ独自の解釈をしているところがありますので,もし間違いがありましたらコメントいただけますと幸いです。また,参考資料を下に添付しています。
現在はクローズされていますが,ネットプロテクションズではインターン生を募集しております。この記事を読まれた学生の方は長期インターンを応募する際にご検討いただければと思います。
参考
ウェブ上の記事
書籍
