グラフが簡単に作成出来るライブラリを使う!
今回は、Holo Graph Libraryというものを使用します。
日本語の記事があまりなかったので書いてみようと思います。
すごくいいです。折れ線グラフ、棒グラフ、円グラフが簡単に作成できます。
実際に使用するように、データベースから取り出した値をグラフに反映してみましょう。
ライブラリを取込み
Bitbucktからプロジェクトをcloneしてきましょう。↓です。
https://bitbucket.org/danielnadeau/holographlibrary/wiki/Home
git clone https://bitbucket.org/danielnadeau/holographlibrary.git
cloneしてきた、プロジェクトをEclipseでimport
その後、project→properties→AndroidのLibraryで、addを押して先ほどimportしてきたprojectをLibraryに指定します。
準備OK!
折れ線グラフ
xmlの準備
<FrameLayout xmlns:android="http://schemas.android.com/apk/res/android"
    xmlns:tools="http://schemas.android.com/tools"
    android:id="@+id/main"
    android:layout_width="match_parent"
    android:layout_height="match_parent" >

    <com.echo.holographlibrary.LineGraph
        android:id="@+id/holo_graph_view"
        android:layout_width="match_parent"
        android:layout_height="match_parent" />

</FrameLayout>
線グラフに指定したいviewにcom.echo.holographlibrary.LineGraphを指定します。
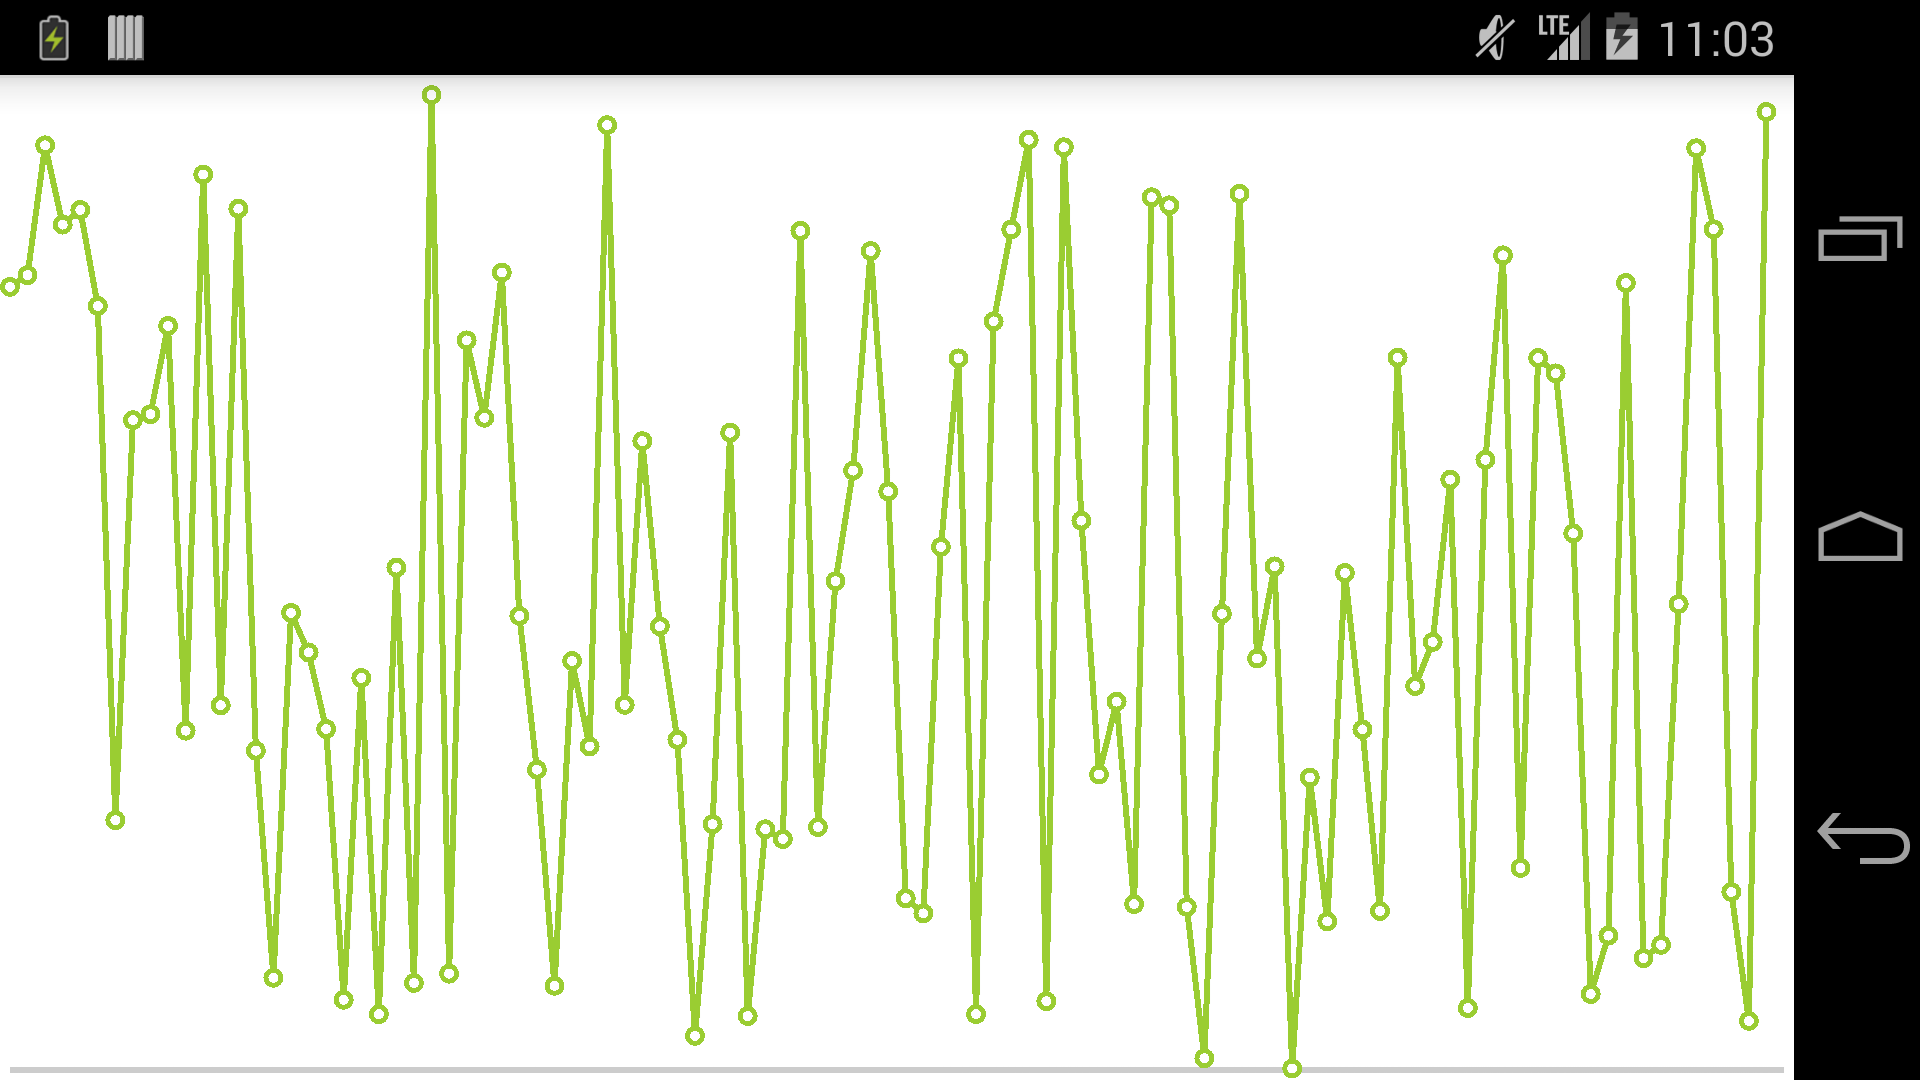
それでは折れ線グラフを作成してみます。
SQLiteで始めに100件ほど、0から1の間の値をランダムで生成し、保存します。
これをグラフに反映させます。
import android.app.Activity;
import android.content.Context;
import android.database.Cursor;
import android.database.sqlite.SQLiteDatabase;
import android.database.sqlite.SQLiteOpenHelper;
import android.graphics.Color;
import android.os.Bundle;
import android.view.Window;

import com.echo.holographlibrary.Line;
import com.echo.holographlibrary.LineGraph;
import com.echo.holographlibrary.LinePoint;

public class MainActivity extends Activity {

	private ExampleOpenHelper mExampleOpenHelper;

	@Override
	public void onCreate(Bundle savedInstanceState) {
		super.onCreate(savedInstanceState);
		requestWindowFeature(Window.FEATURE_NO_TITLE);
		setContentView(R.layout.activity_main);

		mExampleOpenHelper = new ExampleOpenHelper(this);
		SQLiteDatabase db = mExampleOpenHelper.getReadableDatabase(); //データベース取得
		Cursor cursor = db.rawQuery("SELECT * from example", new String[] {});

		// 折れ線グラフ
		int number = 0;
		Line line = new Line();
		boolean next = cursor.moveToFirst();
		while (next) {
			LinePoint linePoint = new LinePoint();
			linePoint.setY(cursor.getFloat(1)); //ランダムで生成した値をSet
			linePoint.setX(number); //x軸を1ずつずらしてSet
			linePoint.setColor(Color.parseColor("#9acd32")); // 丸の色をSet
			line.addPoint(linePoint);
			next = cursor.moveToNext();
			number++;
		}
		line.setColor(Color.parseColor("#9acd32")); // 線の色をSet

		LineGraph graph = (LineGraph) findViewById(R.id.holo_graph_view);
		graph.addLine(line);
		graph.setRangeY(0, 1); // 表示するY軸の最低値・最高値 今回は0から1まで
		graph.setRangeX(0, cursor.getCount()); // 表示するX軸の最低値・最高値 今回は0からデータベースの取得したデータ分まで

		cursor.close();
		db.close();
		mExampleOpenHelper.close();
	}


	private class ExampleOpenHelper extends SQLiteOpenHelper {
		public ExampleOpenHelper(Context context) {
			super(context, "sample.db", null, 1);
		}
		@Override
		public void onCreate(SQLiteDatabase db) {
			/**
			 *  name: exampleテーブル
			 *  test:value
			 */
			db.execSQL("CREATE TABLE example(id INTEGER PRIMARY KEY AUTOINCREMENT, test REAL NOT NULL);");

			// 初期データの投入 100件
			for(int i=0;i<=100;i++){
				db.execSQL("INSERT INTO example(test) values('"+ Math.random() +"')");
			}
		}
		@Override
		public void onUpgrade(SQLiteDatabase db, int oldVersion, int newVersion) {
		}
	}
}
基本的な流れは、以下
Line line = new Line();
LinePoint linePoint = new LinePoint();

linePoint.setX(0); //x軸の値
linePoint.setY(5); //y軸の値
line.addPoint(linePoint);
line.setColor(Color.parseColor("#FFBB33"));

LineGraph lineGraph = (LineGraph)findViewById(R.id.graph);
lineGraph.addLine(line);
line.setRangeY(0, 10);
いいですね!
棒グラフ
<FrameLayout xmlns:android="http://schemas.android.com/apk/res/android"
    xmlns:tools="http://schemas.android.com/tools"
    android:id="@+id/main"
    android:layout_width="match_parent"
    android:layout_height="match_parent" >

    <com.echo.holographlibrary.BarGraph
        android:id="@+id/holo_graph_view"
        android:layout_width="match_parent"
        android:layout_height="match_parent" />

</FrameLayout>
先程の折れ線グラフの箇所を修正
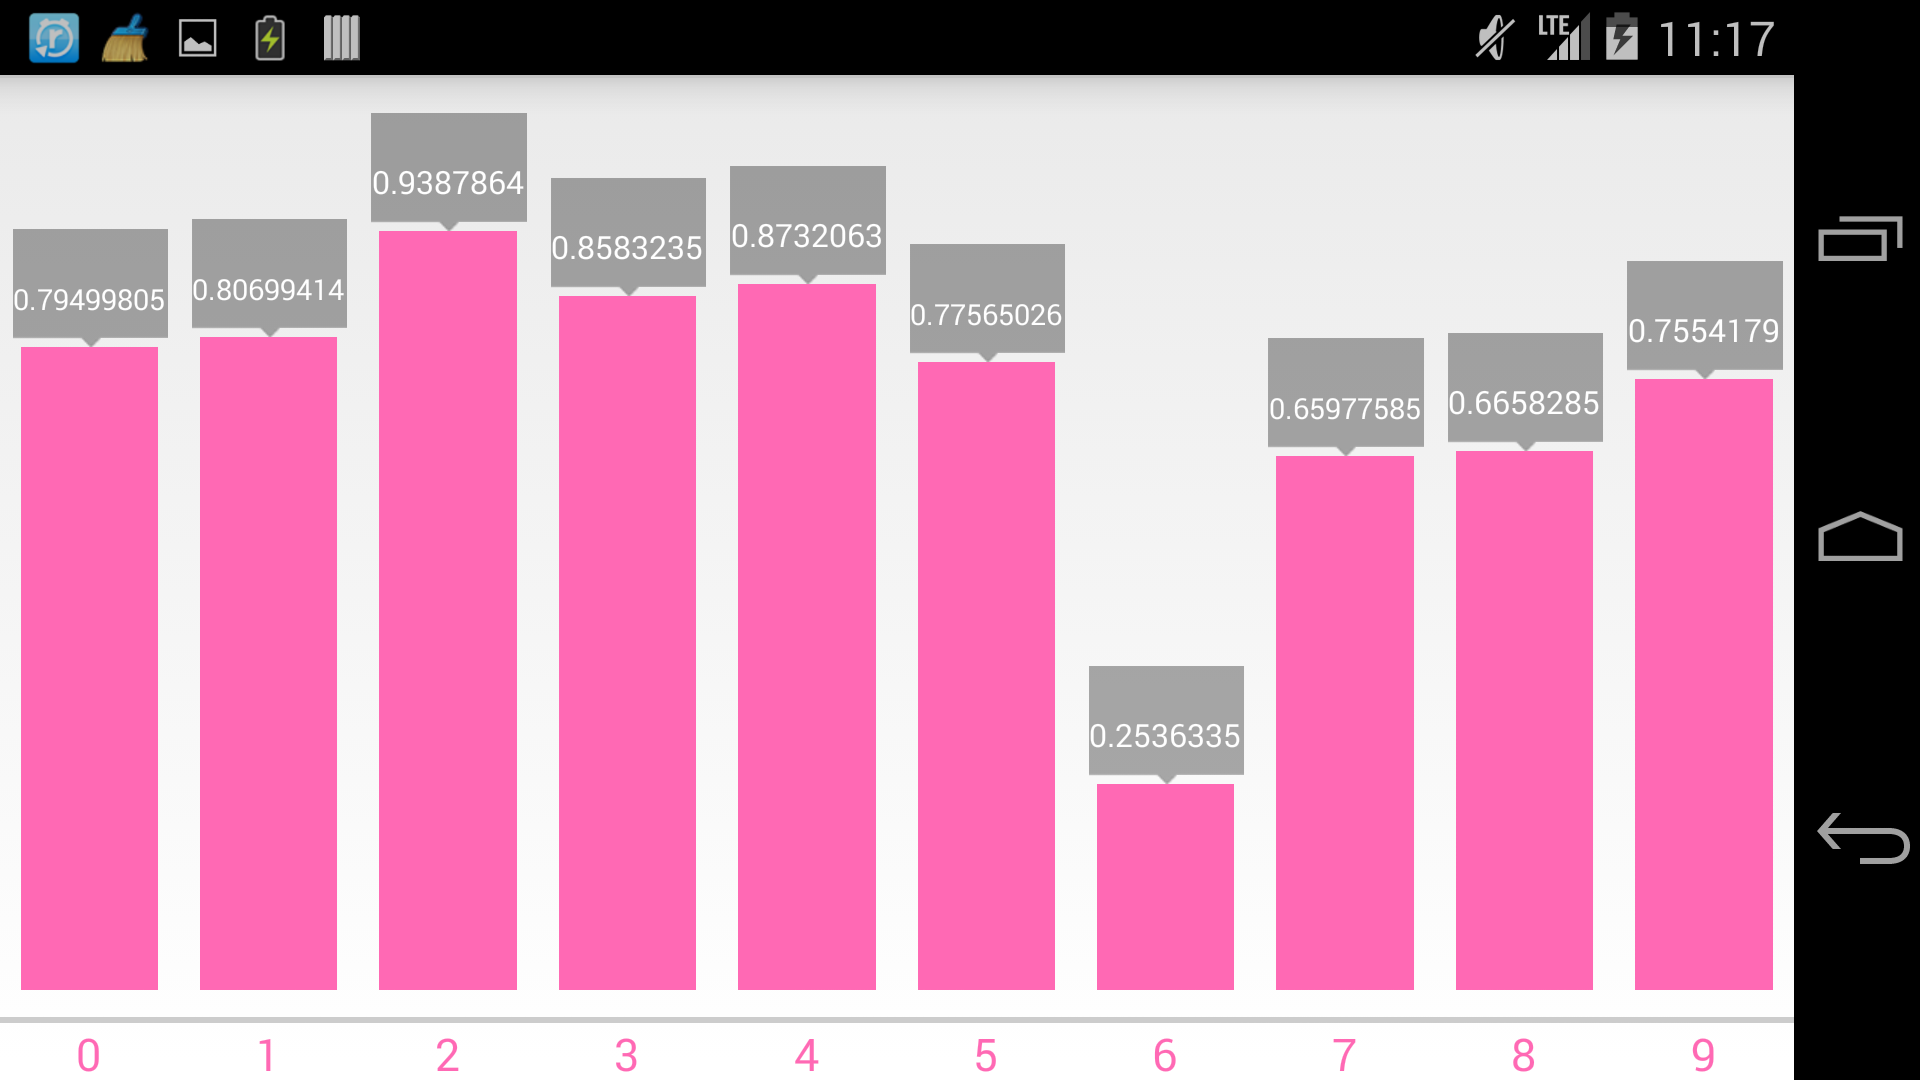
		Cursor cursor = db.rawQuery("SELECT * from example LIMIT 10", new String[] {}); // 10件取得

		// 棒グラフ
		ArrayList<Bar> points = new ArrayList<Bar>();
		int number = 0;
		boolean next = cursor.moveToFirst();
		while (next) {
			Bar bar = new Bar();
			bar.setColor(Color.parseColor("#ff69b4"));
			bar.setValue(cursor.getFloat(1));
			bar.setName(""+number);
			points.add(bar);
			next = cursor.moveToNext();
			number++;
		}

		BarGraph graph = (BarGraph) findViewById(R.id.holo_graph_view);
		graph.setBars(points);
基本的な流れは、以下
ArrayList<Bar> points = new ArrayList<Bar>();
Bar d = new Bar();
d.setColor(Color.parseColor("#99CC00"));
d.setName("Test1");
d.setValue(10);
Bar d2 = new Bar();
d2.setColor(Color.parseColor("#FFBB33"));
d2.setName("Test2");
d2.setValue(20);
points.add(d);
points.add(d2);

BarGraph g = (BarGraph)findViewById(R.id.graph);
g.setBars(points);
いいですね!
※100件分で描画しようとすると、棒グラフが潰れてしまいました。
データベースの値の数に応じて横幅をとって、ScrollViewでスクロール出来る横画面を実装するのもいいかもしれません。※未検証
円グラフ
<FrameLayout xmlns:android="http://schemas.android.com/apk/res/android"
    xmlns:tools="http://schemas.android.com/tools"
    android:id="@+id/main"
    android:layout_width="match_parent"
    android:layout_height="match_parent" >

    <com.echo.holographlibrary.PieGraph
        android:id="@+id/holo_graph_view"
        android:layout_width="match_parent"
        android:layout_height="match_parent" />
</FrameLayout>
先程の棒グラフ箇所を修正
		// 円グラフ
		PieGraph pg = (PieGraph)findViewById(R.id.holo_graph_view);
		String[] color = {"#99CC00","#FFBB33"};

		boolean next = cursor.moveToFirst();
		int number = 0;
		while (next) {
			PieSlice slice = new PieSlice();
			int i = number % color.length;
			slice.setColor(Color.parseColor(color[i])); //色を交互に指定
			slice.setValue(cursor.getFloat(1)*10); // 1以上じゃないとダメ?
			pg.addSlice(slice);
			next = cursor.moveToNext();
			number++;
		}
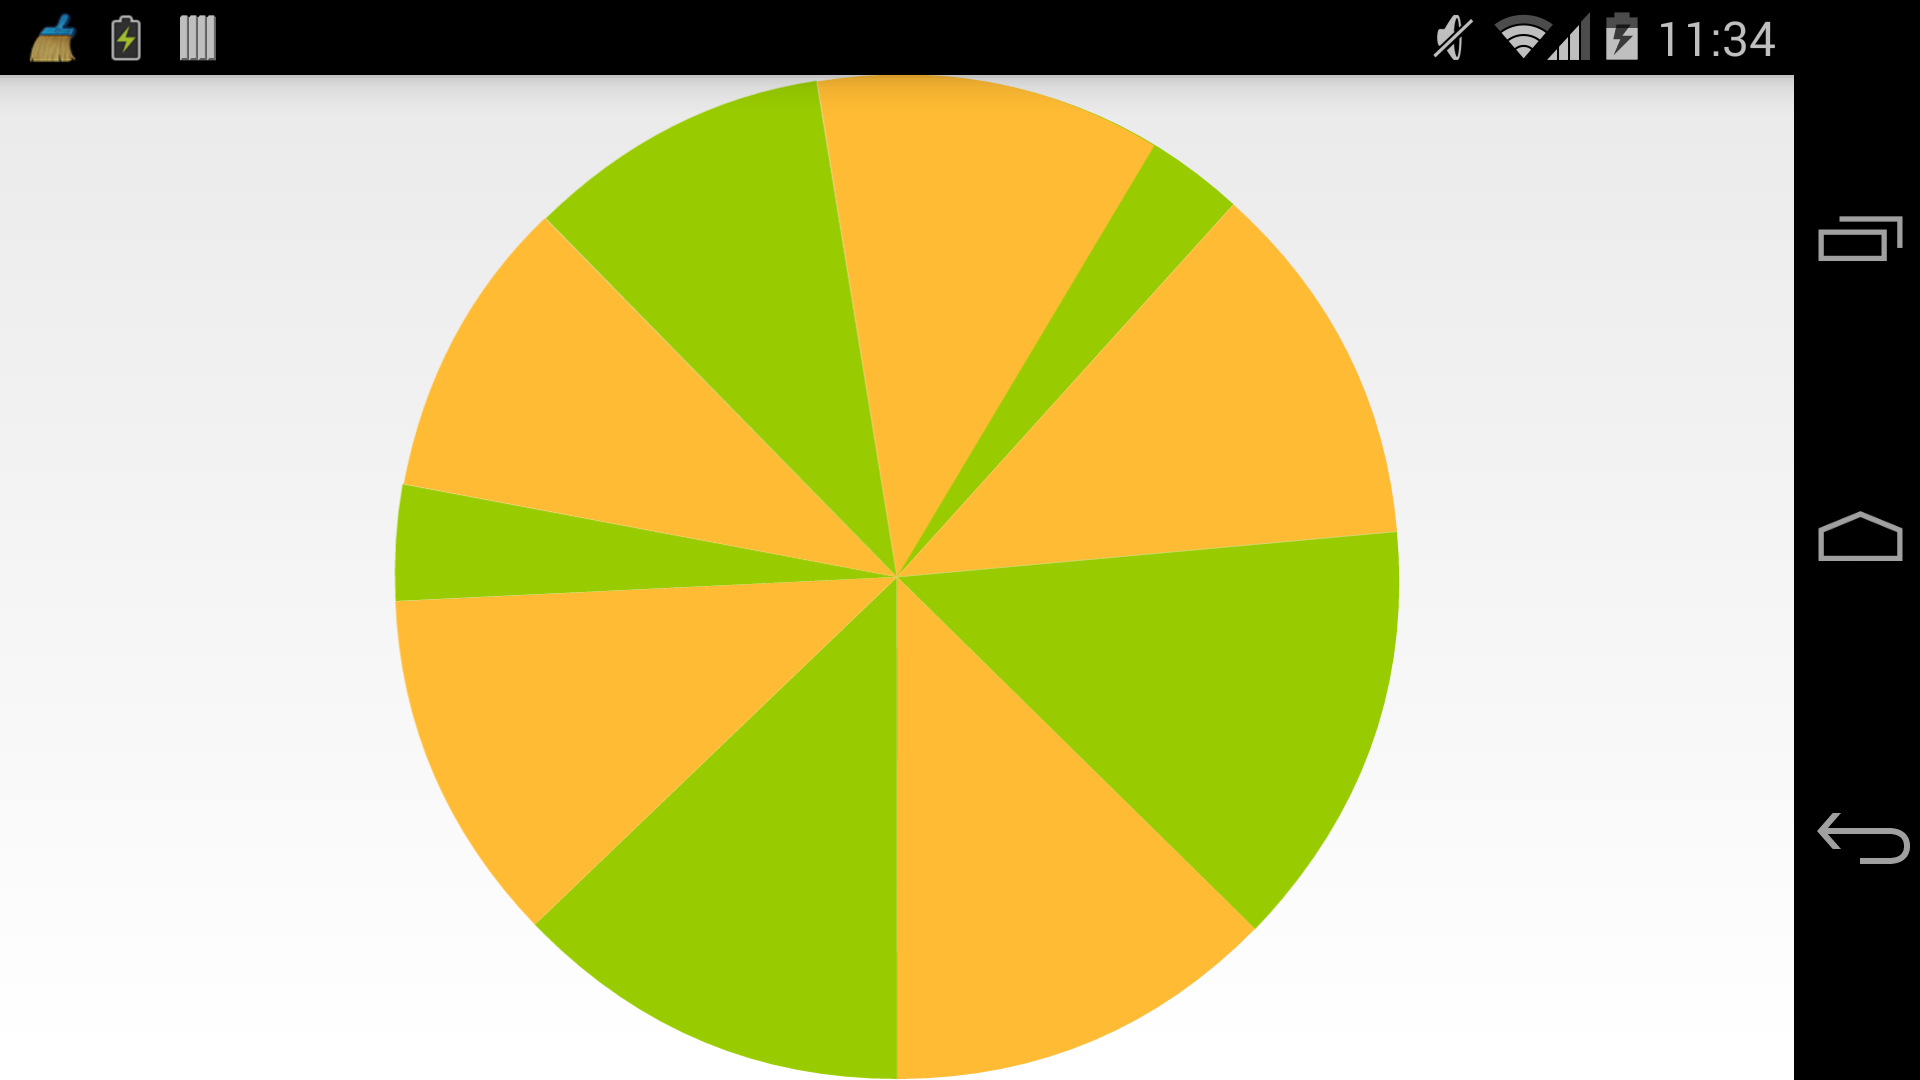
※slice.setValueに1未満の0.〇〇を指定するとグラフが出てこなかったので10をかけてます。
基本的な流れは、以下
PieGraph pg = (PieGraph)findViewById(R.id.graph);
PieSlice slice = new PieSlice();
slice.setColor(Color.parseColor("#99CC00"));
slice.setValue(2);
pg.addSlice(slice);
slice = new PieSlice();
slice.setColor(Color.parseColor("#FFBB33"));
slice.setValue(3);
pg.addSlice(slice);
slice = new PieSlice();
slice.setColor(Color.parseColor("#AA66CC"));
slice.setValue(8);
pg.addSlice(slice);
いいですね!
参考
https://bitbucket.org/danielnadeau/holographlibrary/wiki/Home
http://dev.classmethod.jp/smartphone/android/android-tips-holographlibrary/


