はじめに
本 Tips では、データ間の相関の可視化手法の一つである、Chord diagram を描画する手法をご紹介します。描画には、"chorddiag" パッケージを使用します。
本Tipsで使用するデータ
以下のデータを、ファイル名 "yamate-line.txt" で、作業ディレクトリ配下に保存します。データは、山手線の駅間の所要時間です。
サンプルデータ
品川 目黒 渋谷 原宿 新宿 高田馬場 池袋 巣鴨 田端 日暮里 上野 秋葉原 東京 新橋
品川 0 7 12 14 18 22 25 28 24 21 17 14 10 7
目黒 7 0 5 7 11 15 18 23 31 28 24 21 17 14
渋谷 12 5 0 2 6 10 13 18 22 25 29 26 22 19
原宿 14 7 2 0 4 8 11 16 20 23 27 28 24 21
新宿 18 11 6 4 0 4 7 12 16 19 23 26 28 25
高田馬場 22 15 10 8 4 0 3 8 12 15 19 22 26 29
池袋 25 18 13 11 7 3 0 5 9 12 16 19 23 26
巣鴨 28 23 18 16 12 8 5 0 4 7 11 14 18 21
田端 24 31 22 20 16 12 9 4 0 3 7 10 14 17
日暮里 21 28 25 23 19 15 12 7 3 0 4 7 11 14
上野 17 24 29 27 23 19 16 11 7 4 0 3 7 10
秋葉原 14 21 26 28 26 22 19 14 10 7 3 0 4 7
東京 10 17 22 24 28 26 23 18 14 11 7 4 0 3
新橋 7 14 19 21 25 29 26 21 17 14 10 7 3 0
Chord diagram を描画する
▼サンプルスクリプト
R
# 環境情報
# R version 3.2.5 (2016-04-14) - Very, Very Secure Dishes
# 作業ディレクトリの指定
setwd( "working_dir" )

# 必要に応じて、パッケージをインストール
install.packages( "RColorBrewer" )
install.packages( "devtools" )
install_github( "mattflor/chorddiag" )

# ライブラリの読み込み
library( RColorBrewer )
library( devtools )
library( chorddiag )

# データの読み込み
yamate-line <- as.matrix(read.table('yamate-line.txt', header=T, row.names=1))

# Chord diagram を描画する
groupColors <- brewer.pal(14, "Set3")
chorddiag(yamate-line, groupColors = groupColors, groupnamePadding = 20)
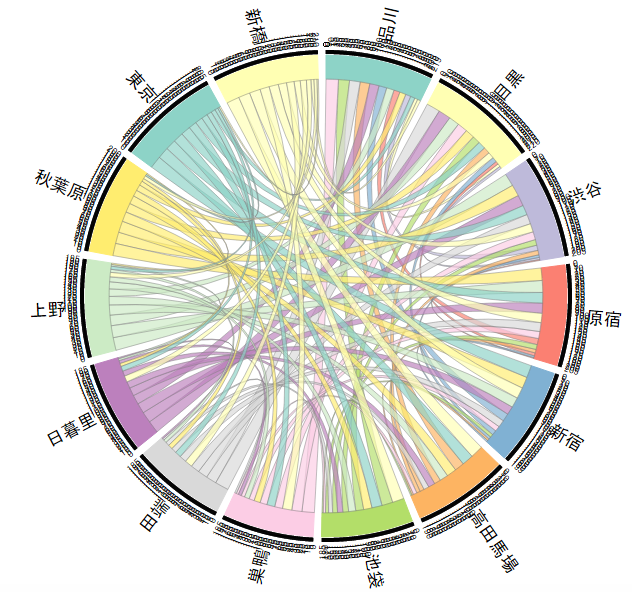
実行結果
リファレンス
https://github.com/mattflor/chorddiag
http://data-steve.github.io/d3-r-chord-diagram-of-white-house-petitions-data/