研究でgnuplotを使い倒したので細かい小ワザ描画オプションをシェア。
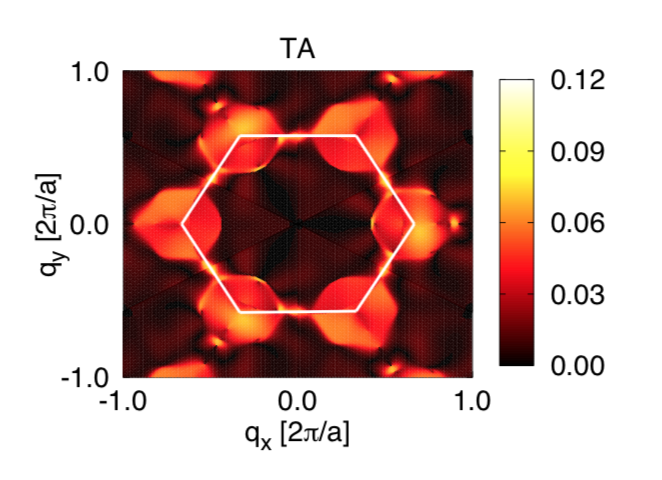
まずはスクリプトと完成図。

# ! /usr/local/bin/
set terminal postscript enhanced solid color "Helvetica" 30
set output "test.ps"
set tics font "Helvetica,30"

set palette rgb 21,22,23
set ticslevel 0
set cbrange [0:0.12]
set cbtic 0.03
set format y  "{%0.1F}"
set format x  "{%0.1F}"
set format cb  "{%0.2F}"
set xrange [-1:1]
set yrange [-1:1]
# set yrange [-1.14546:1.14546]
set colorbox user origin 0.715,0.245
set rmargin 9
# unset colorbox
set size 1,1.1
set border back
set xlabel "q_x [2{/Symbol p}/a]" offset 0,.5
set xtics 1 offset 0,.2
set ytics 1 offset 0.2,0
set ylabel "q_y [2{/Symbol p}/a]" offset 2.5,0 rotate by 90
set zlabel "g^2 (eV)"

set arrow from 0.33300, 0.57677  to 0.6670,  0   nohead front  lw 3 lc rgb "white"
set arrow from 0.6670,  0.00000  to 0.33300, 0.57677-1.14546   nohead front  lw 3 lc rgb "white"
set arrow from 0.33300, 0.57677-1.14546 to  -0.33300, -0.57677   nohead front  lw 3 lc rgb "white"
set arrow from -0.33300, -0.57677  to -0.667, 0.00   nohead front  lw 3 lc rgb "white"
set arrow from -0.667,0 to -0.333,0.57677    nohead front  lw 3 lc rgb "white"
set arrow from -0.333,0.57677 to 0.333,0.57677    nohead front  lw 3 lc rgb "white"
# set cblabel "eV^2"  offset -2,5 rotate by 90


range1="u 4:5:(sqrt($2))"
range2="u ($4):(-$5):(sqrt($2))"
range3="u ((1-$4)/2+sqrt(3)/2*(1.71819-$5)):(-sqrt(3)/2*$4+$5/2):(sqrt($2))"
range4="u ((1-$4)/2+sqrt(3)/2*(1.71819-$5)-2):(-sqrt(3)/2*$4+$5/2):(sqrt($2))"
range5="u ($4-1):($5-1.71819):(sqrt($2))"
range6="u ($4-1):(-$5+1.71819):(sqrt($2)):(sqrt($2))"
opt="w points palette pointsize 1 pointtype 5 notitle"


set title "TA" offset 0,-0.7
Plt_dat="crysDPconst_0.333-0.333TA"
plot Plt_dat @range1 @opt, Plt_dat @range2 @opt, Plt_dat @range3 @opt, Plt_dat @range4 @opt,Plt_dat @range5 @opt, Plt_dat @range6 @opt


!evince test.eps
小ワザ解説
\#!/usr/bin/gnuplot
無くても動くけどvi環境でgnuplotスクリプトに色が付かない時にはこれで色がつく。パスが分からなければコマンドラインでwhich gnuplotで表示できる。
set terminal postscript enhanced solid color "Helvetica" 30
set tics font "Helvetica,10"
postscriptファイル作成オプション。フォントはHelveticaでフォントサイズは30。
目盛のフォントサイズを別に指定。epsやpdfにするカラーバーなどがズレる事あり。
set palette rgb 21,22,23
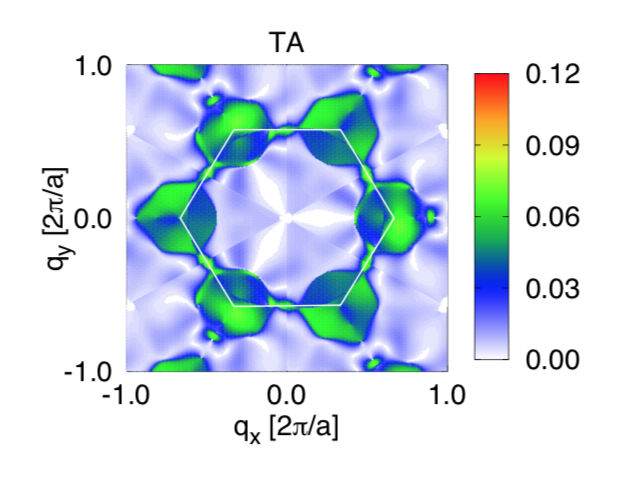
カラーバーの色の変更。ちなみにデフォルトだと以下の表示になる。

以下の色つけもポピュラー
set palette defined (0 'white', 0.25 'blue', 0.5 'green', 0.75 'yellow', 1 'red')
set format y  "{%0.1F}"
set format x  "{%0.1F}"
set format cb  "{%0.2F}"
目盛の数字の桁数の表示を調整できる。{%0.1F}で0.1や0.5という表示、{%0.2F}で0.10や0.50という表示。指数表示をしたい場合は
"10^{%T}"で10^{4}とかって表示できる。
set colorbox user origin 0.715,0.245  #カラーバーの位置調整
set size 1,1.1  #プロットするグラフのサイズ変更。これで縦横比も調整可能
set rmargin 9 #グラフ外側(right side)のマージン変更
set border back #グラフの枠をプロットの奥に
set arrow from 0.33300, 0.57677  to 0.6670,  0   nohead front  lw 3 lc rgb "white"
set arrow from 0.6670,  0.00000  to 0.33300, 0.57677-1.14546   nohead front  lw 3 lc rgb "white"
set arrow from 0.33300, 0.57677-1.14546 to  -0.33300, -0.57677   nohead front  lw 3 lc rgb "white"
set arrow from -0.33300, -0.57677  to -0.667, 0.00   nohead front  lw 3 lc rgb "white"
set arrow from -0.667,0 to -0.333,0.57677    nohead front  lw 3 lc rgb "white"
set arrow from -0.333,0.57677 to 0.333,0.57677    nohead front  lw 3 lc rgb "white"
グラフ内に六角形の補助線を追加。プロットに埋もれないようにfrontオプションでプロットの手前に来るように設定
range1="u 4:5:(sqrt($2))"
range2="u ($4):(-$5):(sqrt($2))"
range3="u ((1-$4)/2+sqrt(3)/2*(1.71819-$5)):(-sqrt(3)/2*$4+$5/2):(sqrt($2))"
range4="u ((1-$4)/2+sqrt(3)/2*(1.71819-$5)-2):(-sqrt(3)/2*$4+$5/2):(sqrt($2))"
range5="u ($4-1):($5-1.71819):(sqrt($2))"
range6="u ($4-1):(-$5+1.71819):(sqrt($2)):(sqrt($2))"
opt="w points palette pointsize 1 pointtype 5 notitle"


set title "TA" offset 0,-0.7
Plt_dat="crysDPconst_0.333-0.333TA"
plot Plt_dat @range1 @opt, Plt_dat @range2 @opt, Plt_dat @range3 @opt, Plt_dat @range4 @opt,Plt_dat @range5 @opt, Plt_dat @range6 @opt
プロット時のオプションやプロットの仕方をStringの変数として定義。使うときは @変数(eg. @range1や@opt)として使う。
生データは以下のように菱形であるので平行移動したものを組み合わせて全体の図を作成。

ちなみに変数として使わないと以下のようにめちゃくちゃ長いコマンドになる。
plot "crysDPconst_0.333-0.333TA" u 4:5:(sqrt($2)) w points palette pointsize 0.3 pointtype 5 notitle, "crysDPconst_0.333-0.333TA" u ($4):(-$5):(sqrt($2)) w points palette pointsize 0.3 pointtype 5 notitle , "crysDPconst_0.333-0.333TA" u ((1-$4)/2+sqrt(3)/2*(1.71819-$5)):(-sqrt(3)/2*$4+$5/2):(sqrt($2)) w points palette pointsize 0.3 pointtype 5 notitle, "crysDPconst_0.333-0.333TA" u ((1-$4)/2+sqrt(3)/2*(1.7 1819-$5)-2):(-sqrt(3)/2*$4+$5/2):(sqrt($2)) w points palette pointsize 0.3 pointtype 5 notitle ,"crysDPconst_0.333-0.333TA" u ($4-1):($5-1.71819):(sqrt($2)) w points palette pointsize 0.3 pointtype 5 notitle , "crysDPconst_0.333-0.333TA" u ($4-1):(-$5+1.71819):(sqrt($2)):(sqrt($2)) w points palette pointsize 0.3 pointtype 5 notitle
