private void button_Click(object sender, EventArgs e)
{
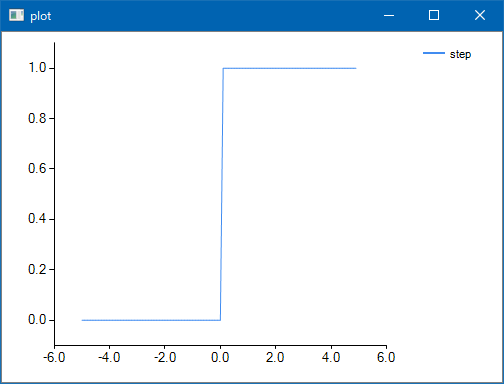
var x = np_arange(-5.0, 5.0, 0.1);
var y = step_function(x);
var plt = new Chart();
plt_plot(plt, x, y);
plt_xlim(plt, -6.0, 6.0);
plt_ylim(plt, -0.1, 1.1);
plt_show(plt);
}
private U[] np_arange<T, U>(T start, T end, U step) where T : struct where U : struct
{
var start_ = (dynamic)start;
var end_ = (dynamic)end;
var step_ = (dynamic)step;
return Enumerable.Range((int)(start_ / step_), (int)((end_ - start_) / step_)).Select(x => (U)(x * step_)).ToArray();
}
private int[] step_function<T>(T[] x) where T : struct
{
return x.Select(n => ((dynamic)n > 0) ? 1 : 0).ToArray();
}
private void plt_plot<T, U>(Chart plt, T[] x, U[] y) where T : struct where U : struct
{
plt.Size = new System.Drawing.Size(500, 350);
plt.ChartAreas.Add("step");
plt.Legends.Add("step");
plt.Series.Add("step");
plt.ChartAreas["step"].AxisX.MajorGrid.Enabled = false;
plt.ChartAreas["step"].AxisX.LabelStyle.Format = "0.0";
plt.ChartAreas["step"].AxisX.Minimum = (dynamic)x.First();
plt.ChartAreas["step"].AxisX.Maximum = (dynamic)x.Last();
plt.ChartAreas["step"].AxisY.MajorGrid.Enabled = false;
plt.ChartAreas["step"].AxisY.LabelStyle.Format = "0.0";
plt.ChartAreas["step"].AxisY.Minimum = (dynamic)y.First();
plt.ChartAreas["step"].AxisY.Maximum = (dynamic)y.Last();
plt.Series["step"].ChartType = SeriesChartType.Line;
foreach (var n in x.Zip(y, Tuple.Create))
{
plt.Series["step"].Points.AddXY(n.Item1, n.Item2);
}
}
private void plt_xlim(Chart plt, double minimum, double maximum)
{
plt.ChartAreas["step"].AxisX.IntervalOffset = 0.0;
plt.ChartAreas["step"].AxisX.Minimum = minimum;
plt.ChartAreas["step"].AxisX.Maximum = maximum;
plt.ChartAreas["step"].AxisX.Interval = 2;
}
private void plt_ylim(Chart plt, double minimum, double maximum)
{
plt.ChartAreas["step"].AxisY.IntervalOffset = 0.1;
plt.ChartAreas["step"].AxisY.Minimum = minimum;
plt.ChartAreas["step"].AxisY.Maximum = maximum;
plt.ChartAreas["step"].AxisY.Interval = 0.2;
}
private void plt_show(Chart plt)
{
Bitmap bitmap = new Bitmap(plt.Width, plt.Height);
plt.DrawToBitmap(bitmap, new Rectangle(System.Drawing.Point.Empty, plt.Size));
Cv2.ImShow("plot", BitmapConverter.ToMat(bitmap));
}
参考文献:
斎藤康毅(2016)『ゼロから作るDeep Learning』オライリー・ジャパン