はじめに
pythonを使ったデータ解析環境として、まず用意したいライブラリの一つが、matplotlibだと思います。少なくとも僕はそう思っています。
なので、macのpython環境でもまずmatplotlibを入れることを考えました。
matplotlibのインストールと実行
とりあえずpipenv環境をactivateして、いつも通り下記を実行すると問題なくするっと入ります。
$ pip install matplotlib
じゃあいけるだろうと思い、下記を実行。
import matplotlib.pyplot as plt
a = [1, 2, 5, 4, 3]
plt.plot(a)
ImportError: Python is not installed as a framework. The Mac OS X backend will not be able to function correctly if Python is not installed as a framework. See the Python documentation for more information on installing Python as a framework on Mac OS X. Please either reinstall Python as a framework, or try one of the other backends. If you are using (Ana)Conda please install python.app and replace the use of 'python' with 'pythonw'. See 'Working with Matplotlib on OSX' in the Matplotlib FAQ for more information.
なんかエラー出た。。
macでのmatplotlibインストール エラー対策
どうやらmacあるあるらしく、たくさん解決法が書いてありました。
matplotlibのmatplotlibrcファイルのbackendをmacosxから、TkAggに変えろ、というもの。
早速、matplotlibrcの場所を下記コマンドで調べて書き換える。
import matplotlib
matplotlib.matplotlib_fname()

.venv/lib/python3.5/site-packages/matplotlib/mpl-data/matplotlibrc'
# backend: macosx
backend: TkAgg
そして、また実行してみると、

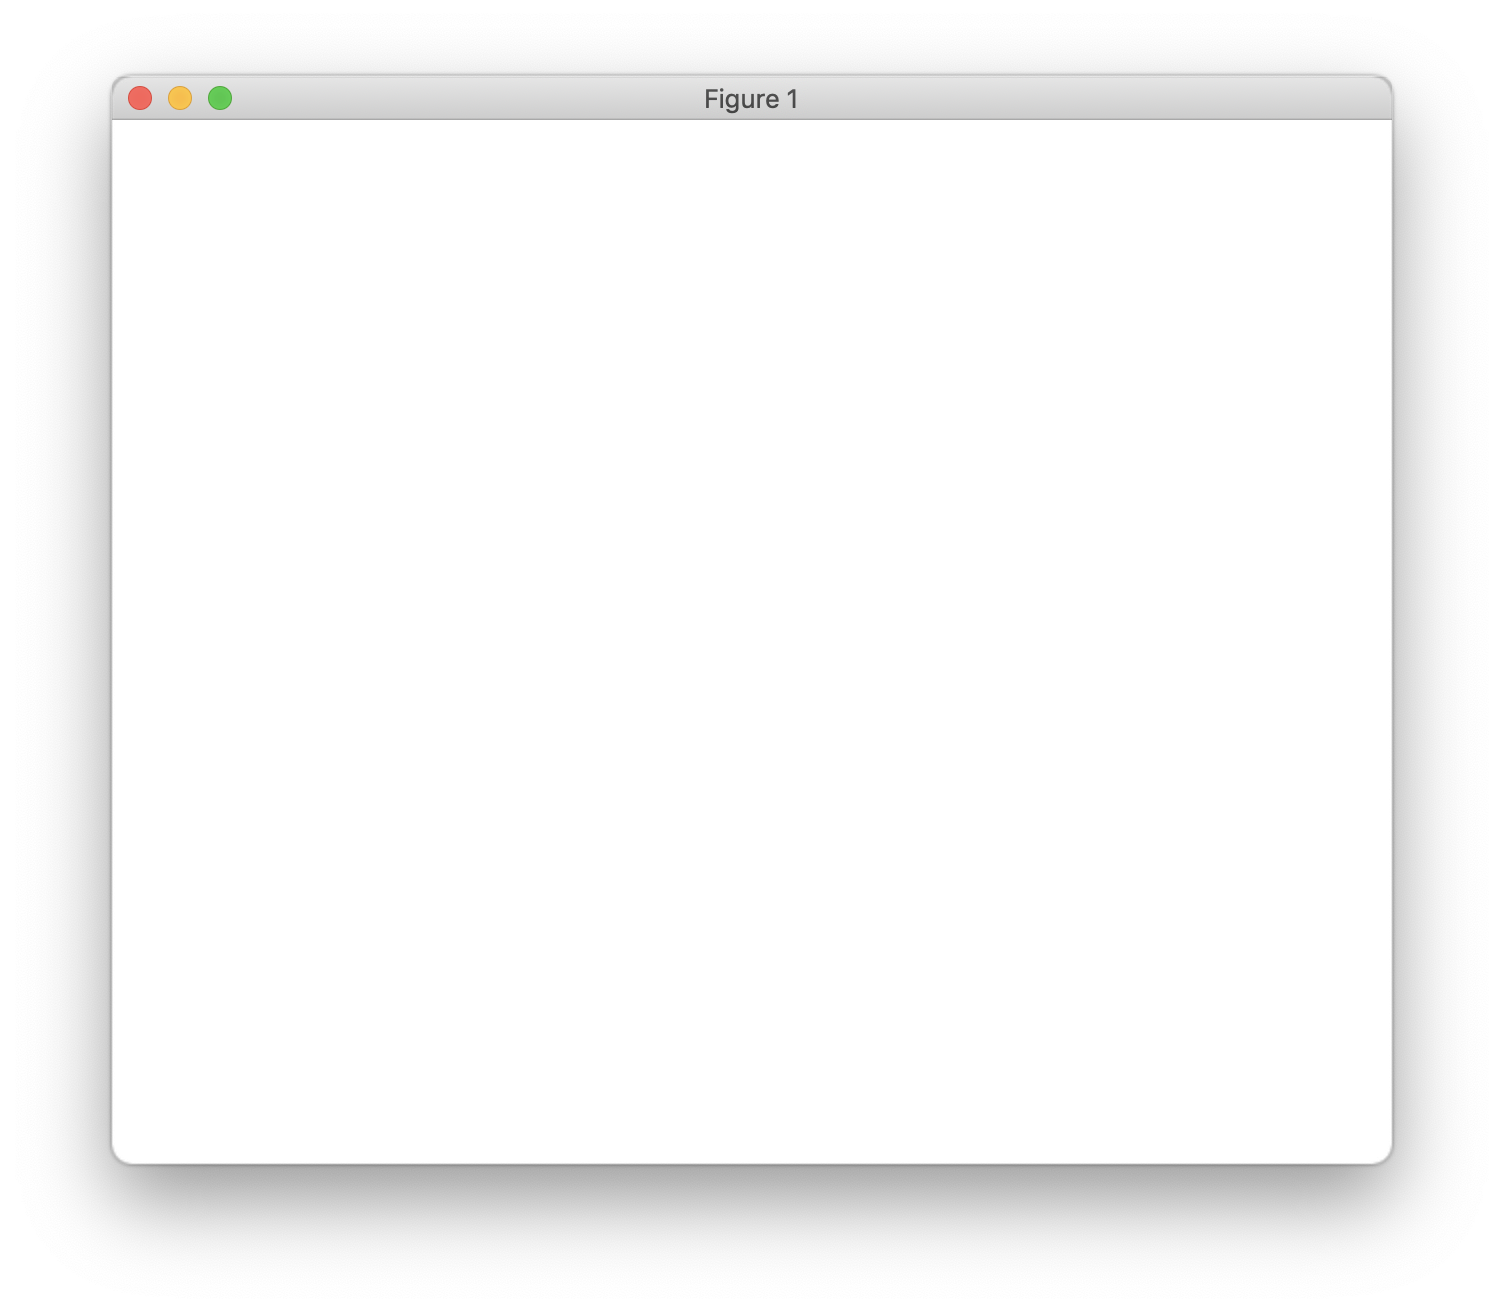
いやいや、グラフ出ないじゃん。
ということで、別情報を得て、backendをQtAggに変更するとできると知る。GUIとしてPyQtを使う手のようです。下記の方法でうまくいきました。
$ pip install PyQt5
# backend: macosx
# backend: TkAgg
backend: Qt5Agg
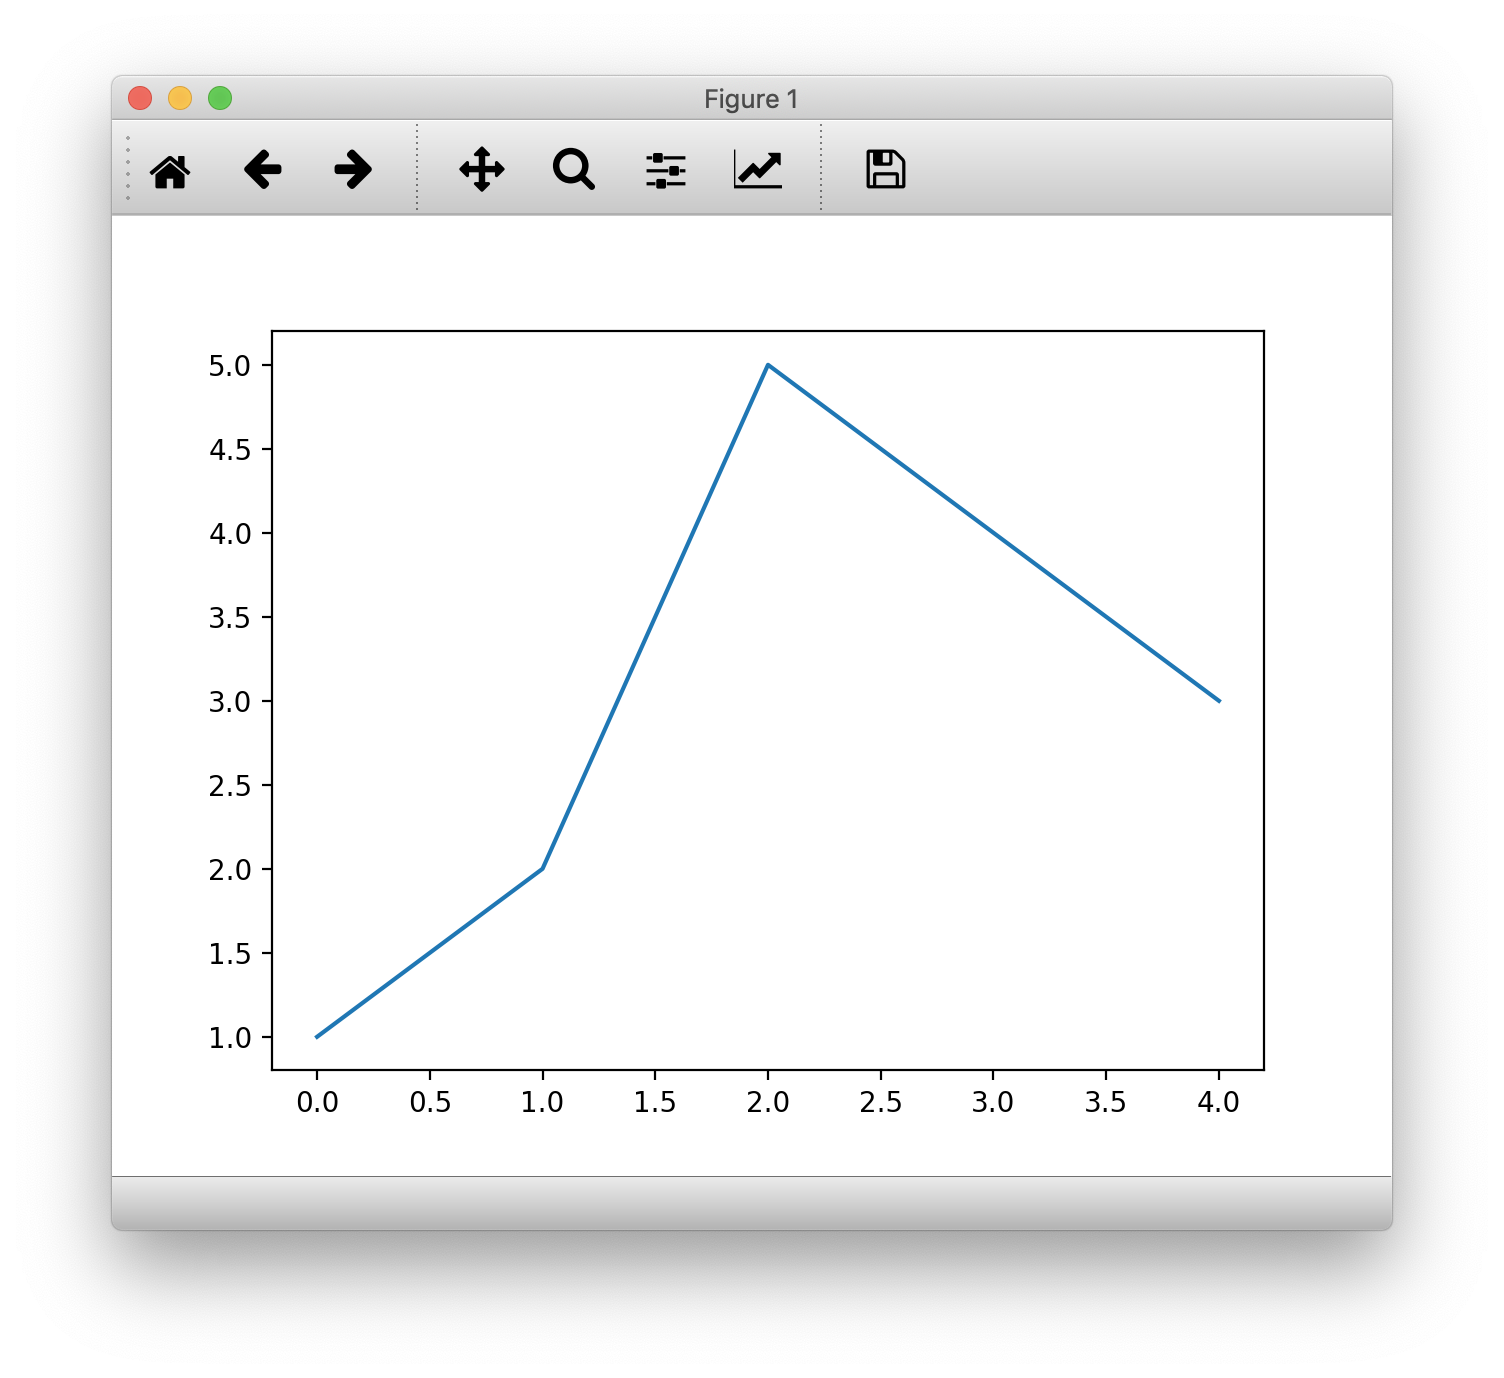
これで、matplotlibのコードを動かすと・・

動きました。
まとめ
とりあえず2019/2の段階では、PyQt5をインストールして、backendをQt5Aggにすれば動きそうです。Qt4Aggにすれば動くという話も出回っていますが、私の環境ではうまくいきませんでした。
皆さんのご参考になれば。