実行した環境
UbuntuStudio 18.04
Python 3.6.5
参考
The cartopy Feature interface
https://scitools.org.uk/cartopy/docs/v0.15/matplotlib/feature_interface.html
Pythonで世界地図-3(日本地図)
https://qiita.com/ty21ky/items/b59e7d9e4b164a803c1f
インストール
NameError: name 'cartopy' is not defined
等のエラーがでたら、パッケージが不足しているのでインストールが必要です。
パッケージの探し方(Ubuntuの場合)
$ pip search Cartopy
Cartopy (0.16.0)  - A cartographic python library with Matplotlib support for visualisation
インストールの例(Ubuntuの場合)
$ pip install Cartopy
# !/usr/bin/python3
# coding: UTF-8
import matplotlib.pyplot as plt
import cartopy.crs as ccrs
import cartopy.feature as cfeature
from matplotlib.offsetbox import AnchoredText
import cartopy.io.shapereader as shpreader #シェイプファイルを使用
font = {'family':'IPAGothic'} #日本語Fontを指定
def main():
#シェイプファイル
fname = 'ne_10m_admin_1_states_provinces/ne_10m_admin_1_states_provinces.shp' #国境線を表示
shapes = list(shpreader.Reader(fname).geometries())
ax = plt.axes(projection=ccrs.PlateCarree())
ax.add_geometries(shapes, ccrs.PlateCarree(), edgecolor='red', facecolor='gray', alpha=0.3)
ax.set_extent([80, 170, -45, 45]) #[lon1,lon2,lat1,lat2]
ax.stock_img() #陸地・海底の形状を表示
# Create a feature for States/Admin 1 regions at 1:50m from Natural Earth
states_provinces = cfeature.NaturalEarthFeature(
category='cultural',
name='admin_1_states_provinces_lines',
scale='10m', #'50m',
facecolor='none')
SOURCE = 'Natural Earth'
LICENSE = 'public domain'
ax.coastlines(resolution='10m') #海岸線 下のax.add_feature(cfeature.COASTLINE) どちらか必要
#ax.add_feature(cfeature.LAND) #この塗りつぶしも荒い
#ax.add_feature(cfeature.COASTLINE) #この海岸線は荒い
ax.add_feature(states_provinces, edgecolor='gray') #県境を表示(全世界)
# ライセンス情報のテキスト注釈を右下に追加します。
text = AnchoredText(r'$\mathcircled{{c}}$ {}; license: {}'
''.format(SOURCE, LICENSE),
loc=4, prop={'size': 12}, frameon=True)
ax.add_artist(text)
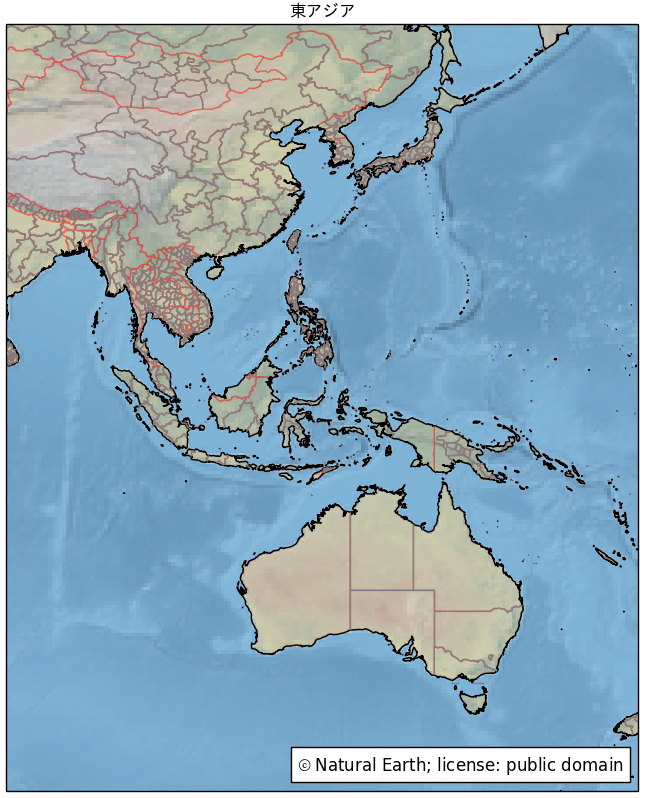
plt.title('東アジア', **font)
plt.show()
if __name__ == '__main__':
main()
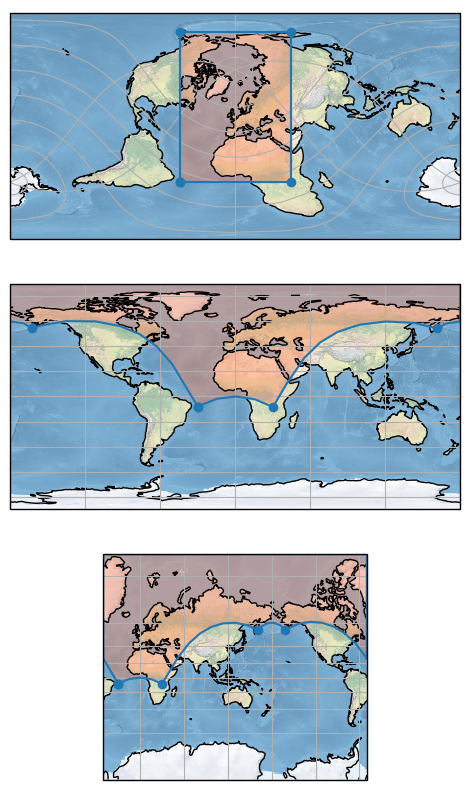
cartopy Rotated pole boxes
回転した極座標系でボックスが定義されているときに、ボックスが反る方法
参考
Rotated pole boxes
https://scitools.org.uk/cartopy/docs/v0.15/examples/rotated_pole.html
Cartopy projection list
https://scitools.org.uk/cartopy/docs/v0.15/crs/projections.html
# !/usr/bin/python3
# coding: UTF-8

"""
回転ポールボックス
------------------
この例は、回転した極座標系でボックスが定義されているときに、ボックスが反る方法を示しています。
ポリゴンにポールを含めることの効果を見るには、 `` box_top``を `` 44``、 `` 46``、 `` 75``に変更してみてください。
"""

import matplotlib.pyplot as plt
import cartopy.crs as ccrs

def main():                  #回転しない基準  北緯90度            東経0度が上
    rotated_pole = ccrs.RotatedPole(pole_latitude=45, pole_longitude=180) #地図の種類
                                       #基準 北緯45度            東経180度が上
    box_top = 75
    x, y = [-44, -44, 45, 45, -44], [-45, box_top, box_top, -45, -45] #[左下、左上、右上、右下、左下]

    ax = plt.subplot(311, projection=rotated_pole)
    ax.stock_img() #陸地・海底の形状
    ax.coastlines() #海岸線
    ax.plot(x, y, marker='o', transform=rotated_pole) #点
    ax.fill(x, y, color='coral', transform=rotated_pole, alpha=0.4) #BOX
    ax.gridlines()

    ax = plt.subplot(312, projection=ccrs.PlateCarree()) #地図の種類
    ax.stock_img()
    ax.coastlines()
    ax.plot(x, y, marker='o', transform=rotated_pole)
    ax.fill(x, y, transform=rotated_pole, color='coral', alpha=0.4)
    ax.gridlines()
    '''
    ax = plt.subplot(313, projection=ccrs.AlbersEqualArea(central_longitude=130.0)) #地図の種類
    ax.stock_img()
    ax.coastlines()
    ax.plot(x, y, marker='o', transform=rotated_pole)
    ax.fill(x, y, transform=rotated_pole, color='coral', alpha=0.4)
    ax.gridlines()

    ax = plt.subplot(313, projection=ccrs.LambertConformal(central_longitude=-96.0, central_latitude=39.0)) #地図の種類
    ax.stock_img()
    ax.coastlines()
    ax.plot(x, y, marker='o', transform=rotated_pole)
    ax.fill(x, y, transform=rotated_pole, color='coral', alpha=0.4)
    ax.gridlines()

    ax = plt.subplot(313, projection=ccrs.LambertCylindrical(central_longitude=130.0)) #地図の種類
    ax.stock_img()
    ax.coastlines()
    ax.plot(x, y, marker='o', transform=rotated_pole)
    ax.fill(x, y, transform=rotated_pole, color='coral', alpha=0.4)
    ax.gridlines()
    '''
    ax = plt.subplot(313, projection=ccrs.Mercator(central_longitude=130.0)) #地図の種類
    ax.stock_img()
    ax.coastlines()
    ax.plot(x, y, marker='o', transform=rotated_pole)
    ax.fill(x, y, transform=rotated_pole, color='coral', alpha=0.4)
    ax.gridlines()

    plt.show()


if __name__ == '__main__':
    main()