参考
Basemap tutorial
http://basemaptutorial.readthedocs.io/en/latest/backgrounds.html#warpimage
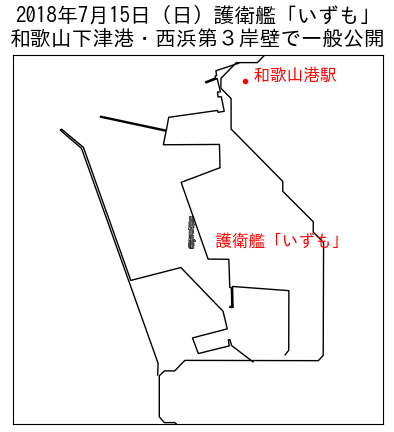
地図が古いので、港の部分を埋め立てました。
# !/usr/bin/python3
# coding: UTF-8
from mpl_toolkits.basemap import Basemap
import matplotlib.pyplot as plt
font = {'family':'IPAGothic'} #日本語Fontを指定
fig = plt.figure()
lon1 = 135.1427 #地図中心
lat1 = 34.2044
lon2 = 0.015 #地図の大きさ(片側)
lat2 = 0.015
map = Basemap(llcrnrlon=lon1-lon2,llcrnrlat=lat1-lat2,urcrnrlon=lon1+lon2,urcrnrlat=lat1+lat2,resolution='f',projection='cyl')
map.drawcoastlines() #海岸線
# 港埋め立て部海岸線
x1=[135.149775,135.150064,135.150075,135.145504,135.145547,135.145268,135.145301,135.14544,135.145408,135.145279,135.145204,135.14352,135.141331,135.144485,135.144442,135.139893,135.140108,135.134765,135.134808,135.140129,135.140322,135.144281,135.144324,135.144829,135.144593,135.144324,135.144281,135.144517,135.14426,135.143359,135.143305,135.144131,135.144088,135.144206,135.144153,135.146]
y1=[34.195036,34.195400,34.200241,34.200578,34.198874,34.198874,34.198967,34.198976,34.200458,34.200502,34.202783,34.202801,34.209029,34.210218,34.212108,34.212082,34.213182,34.214326,34.214397,34.213262,34.214309,34.214868,34.214717,34.214797,34.215977,34.215968,34.216358,34.216376,34.217449,34.217103,34.217183,34.217511,34.217653,34.217707,34.218088,34.2187]
x2,y2=map(x1,y1)
plt.plot(x2, y2, linewidth = 1, color = 'black', linestyle = '-')
x3=[135.147167,135.145429,135.14529,135.145161,135.145236,135.142726,135.142254,135.145075,135.144732,135.141309,135.137243,135.133402,135.131621,135.131514,135.133241,135.139464,135.139421]
y3=[34.194459,34.195782,34.196261,34.196252,34.195755,34.195134,34.196403,34.197139,34.198568,34.202117,34.20107,34.211869,34.21335,34.213271,34.211798,34.194335,34.1934]
x4,y4=map(x3,y3)
plt.plot(x4, y4, linewidth = 1, color = 'black', linestyle = '-')
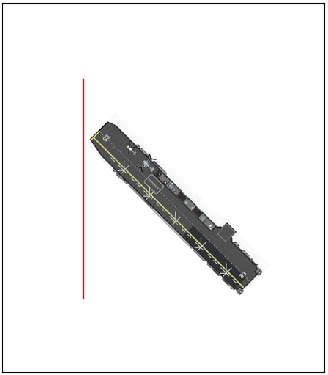
# 護衛艦「いずも」イメージ貼り付け
x00, y00 = map(135.141865, 34.203586) #IMG左下
x01, y01 = map(135.142451, 34.206226) #IMG右上
plt.imshow(plt.imread('./izumo.png'), extent = (x00, x01, y00, y01))
plt.text(135.143412, 34.203812, " " + "護衛艦「いずも」", fontsize=12, color='red', **font)
x10=135.146481 #和歌山港駅
y10=34.217272
map.plot(x10, y10, 'ro', markersize=3)
plt.text(x10, y10, " " + "和歌山港駅", fontsize=12, color='red', **font)
plt.title('2018年7月15日(日)護衛艦「いずも」\n和歌山下津港・西浜第3岸壁で一般公開', **font,fontsize=15)
plt.show()
画像を回転する
参考
Matplotlib rotate image file by X degrees
https://stackoverflow.com/questions/31401812/matplotlib-rotate-image-file-by-x-degrees
matplotlib.pyplot.imshow ドキュメント
https://matplotlib.org/api/_as_gen/matplotlib.pyplot.imshow.html
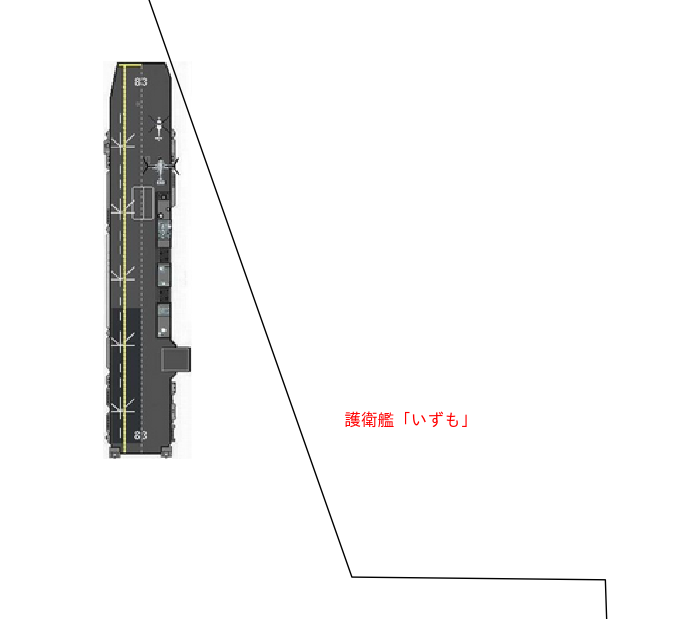
回転する方法がわかったのですが、画像を表示するplt.imshow(plt.imread('./izumo.png'), extent = (x00, x01, y00, y01))
extentの座標の指示が、画像の左下と右上を指示するため、少しややこしいです。
回転なし
x00, y00 = map(135.141865, 34.203586) #IMG左下
x01, y01 = map(135.142451, 34.206226) #IMG右上

plt.imshow(plt.imread('./izumo.png'),  extent = (x00, x01, y00, y01))
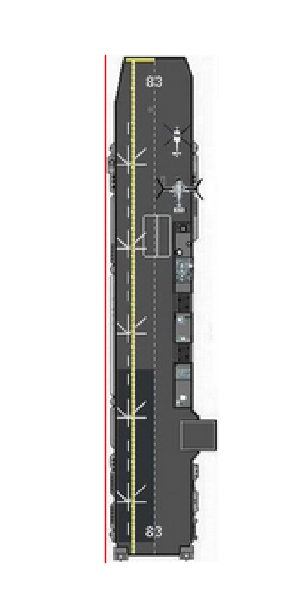
回転なしと同じ座標のままで回転させる
from scipy import ndimage #画像回転

x00, y00 = map(135.141865, 34.203586) #IMG左下
x01, y01 = map(135.142451, 34.206226) #IMG右上

img = plt.imread('./izumo.png')
rotated_img = ndimage.rotate(img, 45)
plt.imshow(rotated_img,  extent = (x00, x01, y00, y01))
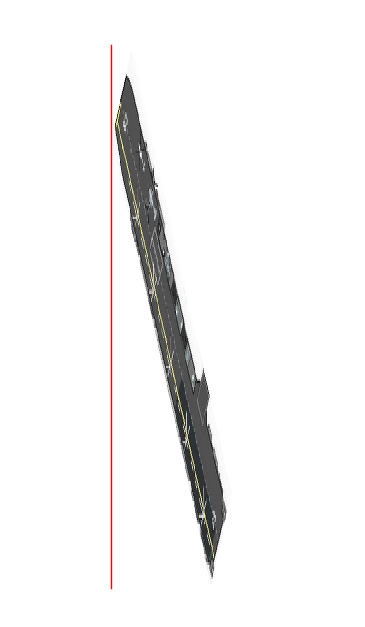
45度回転
from scipy import ndimage #画像回転

x00, y00 = map(135.141865, 34.203586) #IMG左下
x01, y01 = map(135.1441052, 34.20582616) #IMG右上

img = plt.imread('./izumo.png')
rotated_img = ndimage.rotate(img, 45)
plt.imshow(rotated_img,  extent = (x00, x01, y00, y01))
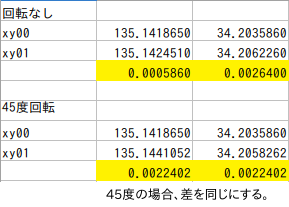
Xy01とxy00の差だけではなく、画像の全長も同じにするには、座標の調整が必要です。
もっと他に良い関数・ライブラリがあるかも知れないです。