1.はじめに
dlibを使って顔検出(顔の位置や部位の検出)を行い、発展として瞳の位置の検出をやってみた。
開発環境は、Ubuntu 20.04(WSL2)、Python 3.8.10、dlib 19.23.0。
まず、画像の読み込みと表示まで。
import cv2
import dlib
import numpy as np
from matplotlib import pyplot as plt
%matplotlib inline
plt.gray()  # グレースケール表示に必要

img_cv2 = cv2.imread('data/lena.png', cv2.IMREAD_COLOR)
height, width = img_cv2.shape[:2]
img_RGB = cv2.cvtColor(img_cv2, cv2.COLOR_BGR2RGB)
plt.imshow(img_RGB)
2.顔の位置・部位の検出
2-1. 顔の位置の検出
dlibを利用し、HOG特徴量を用いた顔の位置の検出を行う。
detector = dlib.get_frontal_face_detector()
CUT_OFF = -0.1
rects, scores, types = detector.run(img_cv2, 1, CUT_OFF)

print('------rects------')
print(rects)
print('------scores------')
print(scores)
print('------types------')
print(types)
------rects------
rectangles[[(218, 219) (373, 374)]]
------scores------
[0.9606970344683554]
------types------
[2]
図に表示して、検出結果を確認する。
tmp_img = img_cv2.copy()
for i, rect in enumerate(rects):
    top, bottom, left, right = rect.top(), rect.bottom(), rect.left(), rect.right()
    cv2.rectangle(tmp_img, (left, top), (right, bottom), (0, 255, 0))

tmp_img_RGB = cv2.cvtColor(tmp_img, cv2.COLOR_BGR2RGB)
plt.imshow(tmp_img_RGB)
2-2. 顔の部位の検出
dlibでは、顔の部位を68個の点(landmarks)で表す。
dlibの機能を使って、この 68 landmarks の検出を行う。
必要になる "shape_predictor_68_face_landmarks.dat" は、下記からダウンロードできる。
http://dlib.net/files/
# dlibの座標の出力形式を(x, y)のタプル形式に変換する
def part_to_coordinates(part):
    return (part.x, part.y)

def shape_to_landmark(shape):
    landmark = []
    for i in range(shape.num_parts):
        landmark.append(part_to_coordinates(shape.part(i)))
    return landmark


predictor = dlib.shape_predictor('./data/shape_predictor_68_face_landmarks.dat')
shape = predictor(img_cv2, rects[0])

# 検出したshapeをlandmark(x,y座標のリスト)に変換
landmark = shape_to_landmark(shape)
for point in landmark:
    cv2.circle(tmp_img, point, 2, (255, 0, 255), thickness=-1)

tmp_img_RGB = cv2.cvtColor(tmp_img, cv2.COLOR_BGR2RGB)
plt.imshow(tmp_img_RGB)
3.瞳の位置の検出
3-1. 目の部分の切り出し
瞳の位置の検出に先立ち、目の部分を切り出しておく。
(上下左右に3画素ずつマージンを設ける)
def cut_out_eye_img(img_cv2, eye_points):
    height, width = img_cv2.shape[:2]
    x_list = []; y_list = []
    for point in eye_points:
        x_list.append(point[0])
        y_list.append(point[1])
    x_min = max(min(x_list) - 3, 0)
    x_max = min(max(x_list) + 4, width)
    y_min = max(min(y_list) - 3, 0)
    y_max = min(max(y_list) + 4, height)
    eye_img = img_cv2[y_min : y_max, x_min : x_max]
    return eye_img, x_min, x_max, y_min, y_max

eye_img, x_min, x_max, y_min, y_max = cut_out_eye_img(img_cv2, landmark[36:42])

# 表示確認
eye_img_copy = eye_img.copy()
landmark_local = []
for point in landmark[36:42]:
    point_local = (point[0] - x_min, point[1] - y_min)
    landmark_local.append(point_local)
    cv2.circle(eye_img_copy, point_local, 1, (255, 0, 255), thickness=-1)

tmp_img_RGB = cv2.cvtColor(eye_img_copy, cv2.COLOR_BGR2RGB)
plt.imshow(tmp_img_RGB)
3-2. 瞳位置の検出(1) 矩形の列ごとの和を比較
瞳(特に、虹彩の中心にある瞳孔)が周りより暗い色であることを利用して位置を検出する方法を模索する。
まず第一に、切り出した矩形の列ごとの和を求め、列同士を単純比較することで検出できないか試してみる。
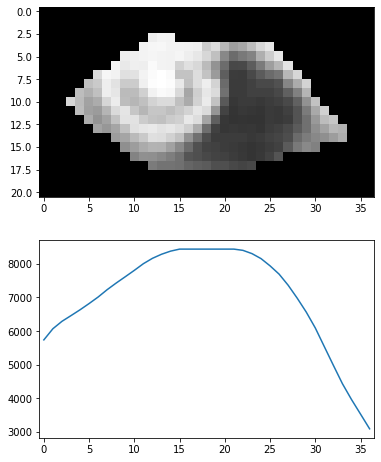
グレースケール化し、ネガ→ポジ反転して暗い色ほど値が大きくなるようにした上で、列ごとの和を求めて比較してみる。
# グレースケース化
eye_img_gray = cv2.cvtColor(eye_img, cv2.COLOR_BGR2GRAY)

# ポジ→ネガ反転
eye_img_negative = 255 - eye_img_gray
# plt.imshow(eye_img_negative)
eye_img_gray.shape

# 列ごとに縦方向の和を求める
sum_x = np.sum(eye_img_negative, axis=0)

# グラフ化
fig = plt.figure(figsize=(6, 8))
plt.subplots_adjust(wspace=0.5)
ax1 = fig.add_subplot(2, 1, 1)
ax1.imshow(eye_img_negative)
ax2 = fig.add_subplot(2, 1, 2)
ax2.plot(sum_x)
ax2.set_xlim([-0.5, 36.5])

fig.show()
やってみると、瞳以外の列も高い値を示していることが分かった。
目の領域外(まつ毛や瞼の影)の黒い部分が大きく影響していると考えられる。
この方法でうまく検出できる画像もあるのではと思われるが、比較的良い条件のこの画像でもうまく検出できないということは、あまり良い方法ではなかったらしい。
3.3. 瞳位置の検出(2) 目の部分を切り取って列ごとの和を比較
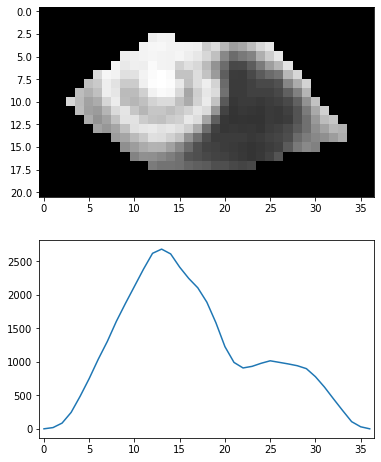
目の領域外の影響を排除するため、マスク処理によって目の領域の画素だけを取り出す。
マスクは、目の周りのポイントをつないだ多角形を作り、内部を塗りつぶすことで作成する。
改めて列ごとの和を求めて比較してみる。
# グレースケース化
eye_img_gray = cv2.cvtColor(eye_img, cv2.COLOR_BGR2GRAY)

# ポジ→ネガ反転
eye_img_negative = 255 - eye_img_gray
eye_img_gray.shape

# 目の部分をマスク処理
eye_mask = np.zeros_like(eye_img_gray)
eye_mask = cv2.fillConvexPoly(eye_mask, np.array(landmark_local), True, 1)
eye_img_negative_masked = np.where(eye_mask == 1, eye_img_negative, 0)

# 列ごとに縦方向の和を求める
sum_x = np.sum(eye_img_negative_masked, axis=0)

# グラフ化
fig = plt.figure(figsize=(6, 8))
plt.subplots_adjust(wspace=0.5)
ax1 = fig.add_subplot(2, 1, 1)
ax1.imshow(eye_img_negative_masked)
ax2 = fig.add_subplot(2, 1, 2)
ax2.plot(sum_x)
ax2.set_xlim([-0.5, 36.5])

fig.show()
上記のように、瞳の位置(x:12~14)で他の場所より大きな値となった。
瞳の位置が検出できたと考えられる。
3.4. 瞳位置の検出(3) 移動平均
上記方法で、この画像ではうまく瞳の位置を検出できたが、
・結膜(白目)部分とと虹彩(黒目)部分がはっきりしている
・虹彩と瞳孔(虹彩の中心の特に黒い部分)の差が大きい
という有利な条件が揃っていたことが大きいのでは、と考えられる。
よりロバスト(頑強)な検出方法を模索し、移動平均(moving average)を試してみる。
# 画像の大きさ
height, width = eye_img.shape[:2]

# グレースケース化
eye_img_gray = cv2.cvtColor(eye_img, cv2.COLOR_BGR2GRAY)

# ポジ→ネガ反転
eye_img_negative = 255 - eye_img_gray
eye_img_gray.shape

# 目の部分をマスク処理
eye_mask = np.zeros_like(eye_img_gray)
eye_mask = cv2.fillConvexPoly(eye_mask, np.array(landmark_local), True, 1)
eye_img_negative_masked = np.where(eye_mask == 1, eye_img_negative, 0)

# 列ごとに縦方向の和を求める
sum_x = np.sum(eye_img_negative_masked, axis=0)

# 移動平均を求める
n = 5
v = np.full(width, 1/n)
moving_ave = np.convolve(sum_x, v, mode='same')

# グラフ化
fig = plt.figure(figsize=(6, 8))
plt.subplots_adjust(wspace=0.5)
ax1 = fig.add_subplot(2, 1, 1)
ax1.imshow(eye_img_negative_masked)
ax2 = fig.add_subplot(2, 1, 2)
ax2.plot(moving_ave)
ax2.set_xlim([-0.5, 36.5])

fig.show()
移動平均を用いることでグラフがスムーズになり、よりロバストになったのではと推察されるが、その反面、残念ながらどの列が瞳孔か判別できなくなってしまった。
方法の改善が必要。
3.5. 瞳位置の検出(4) 重み付き移動平均
ロバスト性と分解能の両立を求め、重み付き移動平均(weighing moving average)を試してみる。
# 画像の大きさ
height, width = eye_img.shape[:2]

# グレースケース化
eye_img_gray = cv2.cvtColor(eye_img, cv2.COLOR_BGR2GRAY)

# ポジ→ネガ反転
eye_img_negative = 255 - eye_img_gray
eye_img_gray.shape

# 目の部分をマスク処理
eye_mask = np.zeros_like(eye_img_gray)
eye_mask = cv2.fillConvexPoly(eye_mask, np.array(landmark_local), True, 1)
eye_img_negative_masked = np.where(eye_mask == 1, eye_img_negative, 0)

# 列ごとに縦方向の和を求める
sum_x = np.sum(eye_img_negative_masked, axis=0)

# 重み付き移動平均を求める
v = np.array([0.1, 0.2, 0.4, 0.2, 0.1])
weighing_moving_ave_x = np.convolve(sum_x, v, mode='same')

# グラフ化
fig = plt.figure(figsize=(6, 8))
plt.subplots_adjust(wspace=0.5)
ax1 = fig.add_subplot(2, 1, 1)
ax1.imshow(eye_img_negative_masked)
ax2 = fig.add_subplot(2, 1, 2)
ax2.plot(weighing_moving_ave_x)
ax2.set_xlim([-0.5, 36.5])

fig.show()
重み付き平均を用いることで、格段に分解能が向上した。
これでロバスト性と分解能が両立できているのではないかと思われる。
縦方向でも試してみる。
# 横方向の和を求める
sum_y = np.sum(eye_img_negative_masked, axis=1)

# 重み付き移動平均を求める
v = np.array([0.1, 0.2, 0.4, 0.2, 0.1])
weighing_moving_ave_y = np.convolve(sum_y, v, mode='same')

# グラフ化
fig = plt.figure(figsize=(3, 12))
plt.subplots_adjust(wspace=0.5)
ax1 = fig.add_subplot(2, 1, 1)
ax1.imshow(cv2.rotate(eye_img_negative_masked, cv2.ROTATE_90_COUNTERCLOCKWISE))
ax2 = fig.add_subplot(2, 1, 2)
ax2.plot(weighing_moving_ave_y)
ax2.set_xlim([-0.5, 20.5])

fig.show()
pupil_x = np.argmax(weighing_moving_ave_x)
pupil_y = np.argmax(weighing_moving_ave_y)
print(f'center : ({pupil_x}, {pupil_y})')

eye_img_copy = eye_img.copy()
cv2.line(eye_img_copy, (pupil_x - 2, pupil_y), (pupil_x + 2, pupil_y), (0, 255, 0))
cv2.line(eye_img_copy, (pupil_x, pupil_y - 2), (pupil_x, pupil_y + 2), (0, 255, 0))

tmp_img_RGB = cv2.cvtColor(eye_img_copy, cv2.COLOR_BGR2RGB)
plt.imshow(tmp_img_RGB)
横方向ほどではないが、y=9の周囲で他よりも高い数値が観測できる。
つまり、縦方向の瞳の位置も求めることができたと言える。
最期に、求めた位置を画像に重ねて表示してみる。


