Unityで点群データの効率的な探索をするために3次元のkd木探索法が使えるかなと思ったのですが、C#で書く前にグラフを出力して確認しながらアルゴリズムを理解した方が良いと思ったので一度Pythonで実装してみます。
....簡単に実装したいなら既にscipyなどのライブラリで提供されているのでそちらを使うと良いと思います。
参考
以下の@fj-thさんの記事を読んでいることを前提とします。
アルゴリズムの説明とC言語でkd-treeの実装をしています。
2次元のkd木
3次元のkd木は、2次元のkd木を拡張するれば良いので、まず@fj-thさんのC言語のkd-木(リポジトリ)をPythonに書き換えます。
ただPythonで書き換えただけなので説明は割愛します。
以下のノートブックを参照ください。
-
kd_tree_2d.ipynb

ノードによる分割結果

3次元のkd木
kd-treeクラス
2次元のkd木を拡張する形で実装します。
import numpy as np
import matplotlib.pyplot as plt
from mpl_toolkits.mplot3d import Axes3D
"""
特定列を基準にソート
axis_xy : xなら0 yなら1 zなら2
"""
def sortxyz(arr:np.ndarray,axis_xyz:int,offset:int = 0):
    axis = axis_xyz + offset # offset
    return arr[np.argsort(arr[:,axis])]

# test
arr = np.array([[1000000,2,50],
               [2000000,0,100],
               [3000000,1,200]])
print(sortxyz(arr,0))

x_col = 0
y_col = 1
z_col = 2
class Node:
    def set_node(self,points:np.ndarray,right:int,depth:int):
        if right < 0:
            return None
        elif right == 0:
            return self.set_leaf(points[right],depth)

        axis = depth % 3
        sorted_points = sortxyz(points[:right + 1],axis)
        if axis == 0:
            self.left_most = sorted_points[0][x_col]
            self.right_most = sorted_points[right][x_col]
        elif axis == 1:
            self.bottom_most = sorted_points[0][y_col]
            self.top_most = sorted_points[right][y_col]
        else:
            self.front_most = sorted_points[0][z_col]
            self.back_most = sorted_points[right][z_col]

        median = int(right / 2)
        self.border = (sorted_points[median][x_col:] + sorted_points[median+1][x_col:])/2.0
        self.location = sorted_points[median]
        self.depth = depth
        self.right_child = Node().set_node(sorted_points[median
                                                          + 1:],right -( median + 1),depth + 1)
        self.left_child = Node().set_node(sorted_points,median,depth + 1)

        #ここから先は関連付け
        if not(axis == 1):
            if(not(self.right_child is None) and not(self.left_child is None)):
                self.top_most = self.right_child.top_most if self.right_child.top_most > self.left_child.top_most else self.left_child.top_most
                self.bottom_most = self.right_child.bottom_most if self.right_child.bottom_most < self.left_child.bottom_most else self.left_child.bottom_most
            elif not(self.right_child is None):
                self.top_most = self.right_child.top_most
                self.bottom_most = self.right_child.bottom_most
            elif not(self.left_child is None):
                self.top_most = self.left_child.top_most
                self.bottom_most = self.left_child.bottom_most
            else:
                self.top_most = self.location[y_col]
                self.bottom_most = self.location[y_col]
        if not(axis == 0):
            if(not(self.right_child is None) and not(self.left_child is None)):
                self.right_most = self.right_child.right_most if self.right_child.right_most > self.left_child.right_most else self.left_child.right_most
                self.left_most = self.right_child.left_most if self.right_child.left_most < self.left_child.left_most else self.left_child.left_most
            elif not(self.right_child is None):
                self.right_most = self.right_child.right_most
                self.left_most = self.right_child.left_most
            elif not(self.left_child is None):
                self.right_most = self.left_child.right_most
                self.left_most = self.left_child.left_most
            else:
                self.right_most = self.location[x_col]
                self.left_most = self.location[x_col]
        if not(axis == 2):
            if(not(self.right_child is None) and not(self.left_child is None)):
                self.back_most = self.right_child.back_most if self.right_child.back_most > self.left_child.back_most else self.left_child.back_most
                self.front_most = self.right_child.front_most if self.right_child.front_most < self.left_child.front_most else self.left_child.front_most
            elif not(self.right_child is None):
                self.back_most = self.right_child.back_most
                self.front_most = self.right_child.front_most
            elif not(self.left_child is None):
                self.back_most = self.left_child.back_most
                self.front_most = self.left_child.front_most
            else:
                self.back_most = self.location[z_col]
                self.front_most = self.location[z_col]

        return self
    def set_leaf(self,location:np.ndarray,depth:int):
        self.location = location
        self.left_child = None
        self.right_child = None
        self.depth = depth
        self.left_most = location[x_col]
        self.right_most = location[x_col]
        self.top_most =   location[y_col]
        self.bottom_most = location[y_col]
        self.front_most = location[z_col]
        self.back_most = location[z_col]
        return self
    def is_contained(self,sx:int,tx:int,sy:int,ty:int,sz:int,tz:int):
        """
        > regionノードから始まるsubtreeの要素が指定領域にすっぽり収まっているか否かを返す。
        > 各ノードに、自分以下の子の最大、最小値をもたせているので、それを参照するだけで判定できる。
        実装参考のis_contained関数より引用
        """
        return not(self.left_most < sx or self.right_most > tx or \
                    self.top_most > ty or self.bottom_most < sy or \
                    self.front_most < sz or self.back_most > tz)
class Tree:
    def build(self,points):
        node = Node().set_node(points,len(points) - 1,0)
        self.top_node = node
        return node
    def search(self,r:list):
        x,y,z = r
        sx,tx = x
        sy,ty = y
        sz,tz = z
        search_results = []
        def _search(v:Node):
            nonlocal search_results,sx,tx,sy,ty
            if v.right_most < sx or v.left_most > tx or \
                v.bottom_most > ty or v.top_most < sy or \
                v.front_most > tz or v.back_most < sz:
                return;
            if v.left_child is None and v.right_child is None:
                if sx <= v.location[x_col] and sy <= v.location[y_col] and  sz <= v.location[z_col] and\
                    tx >= v.location[x_col] and ty >= v.location[y_col] and  tz >= v.location[z_col]:
                    self.search_results.append(v.location)
                    return
            if not(v.left_child is None):
                if(v.left_child.is_contained(sx,tx,sy,ty,sz,tz)):
                    search_results += self.report_subtree(v.left_child)
                else:
                    _search(v.left_child)
            if not(v.right_child is None):
                if(v.right_child.is_contained(sx,tx,sy,ty,sz,tz)):
                    search_results += self.report_subtree(v.right_child)
                else:
                    _search(v.right_child)
        _search(self.top_node)
        return search_results
    def report_subtree(self,node:Node = None,parent:Node=None,parent_border_axis:tuple = None,draw_border:tuple = None):
        """
        draw_border:tuple = (ax,max_x,min_x,max_y,min_y,max_z,min_z)
        """
        if node is None:
            node = self.top_node
        if node.left_child is None and node.right_child is None:
            return [node.location]
        pba = parent_border_axis
        if not (draw_border is None) :
            def _plot(axis:int,s,e):
                if axis == 0:
                    x = [s[0],e[0]]
                    y = [s[1],e[1]]
                    z = np.linspace(s[2], e[2])
                    Y, Z = np.meshgrid(y, z)
                    X = np.array([x] * Y.shape[0])
                    ax.plot_surface(X, Y, Z)
                elif axis == 1:
                    x = [s[0],e[0]]
                    y = [s[1],e[1]]
                    z = np.linspace(s[2], e[2])
                    X, Z = np.meshgrid(x, z)
                    Y = np.array([y] * X.shape[0])
                    ax.plot_surface(X, Y, Z)
                else:
                    x = np.linspace(s[0], e[0])
                    y = [s[1],e[1]]
                    z = [s[2],e[2]]
                    Z, X = np.meshgrid(z,x)
                    Y = np.array([y] * Z.shape[0])
                    ax.plot_surface(X, Y, Z)
            ax,xmax,xmin,ymax,ymin,zmax,zmin = draw_border
            s = node.border.copy()
            e = [0,0,0]
            if parent is None:
                s[1] = ymax
                s[2] = zmax
                e = np.array([s[0],ymin,zmin])
                pba = (s[0],None,s[2])
                _plot(0,s,e)
            else:
                if not(pba[0] is None) and not(pba[2] is None): #前がxの区切り(yz線) => 今がyの区切り(xz線)
                    x = xmax if(pba[0] < s[0]) else xmin
                    z = zmax if(pba[2] < s[2]) else zmin
                    s[0] = pba[0]
                    s[2] = pba[2]
                    e = np.array([x,s[1],z])
                    pba = (s[0],s[1],None)
                    _plot(1,s,e)
                elif not(pba[1] is None) and not(pba[0] is None): #前がyの区切り(xz線) => 今がzの区切り(xy線)

                    x = xmax if(pba[0] < s[0]) else xmin
                    y = ymax if(pba[1] < s[1]) else ymin
                    s[1] = pba[1]
                    s[0] = pba[0]
                    e = np.array([x,y,s[2]])
                    pba = (None,s[1],s[2])
                    _plot(2,s,e)
                else: #前がzの区切り(xy線) => 今がxの区切り(yz線)
                    y = ymax if(pba[1] < s[1]) else ymin
                    z = zmax if(pba[2] < s[2]) else zmin
                    s[2] = pba[2]
                    s[0] = pba[0]
                    e = np.array([s[0],y,z])
                    pba = (s[0],None,s[2])
                    _plot(0,s,e)

        arr = []
        if not (node.left_child is None):
            arr += self.report_subtree(node.left_child,node,pba,draw_border)
        if not (node.right_child is None):
            arr += self.report_subtree(node.right_child,node,pba,draw_border)
        return arr
追加したNodeクラスのfront_mostとback_mostが各ノードのz軸の範囲を持ちます。
テストデータ作成とkd-tree構築
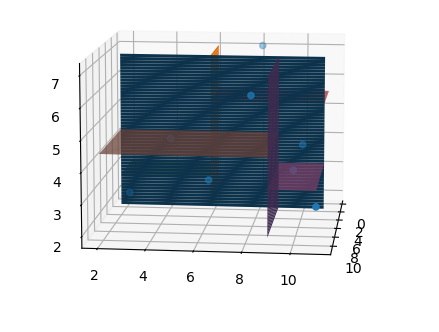
テストデータを使って境界を表示してみます。
# test
points = [[1,2,2],
          [2,4,4],
          [5,6,3],
          [7,8,6],
          [3,10,4],
          [11,11,3],
         [10,10,4],
         [0,8,7]]
points = np.array(points)
tree = Tree()
node = tree.build(points)
fig = plt.figure()
ax = fig.add_subplot(projection='3d')
ax.scatter(points[:,x_col],points[:,y_col],points[:,z_col])
plt.show()
%matplotlib notebook
fig = plt.figure()
ax = fig.gca(projection='3d')
ax.scatter(points[:,x_col],points[:,y_col],points[:,z_col])
tree.report_subtree(draw_border=(ax,points[:,x_col].max(),points[:,x_col].min(),points[:,y_col].max(),points[:,y_col].min(),points[:,z_col].max(),points[:,z_col].min()))
#ax.view_init(elev=10, azim=50)
plt.show()
グルグルグラフを回転させてみると点が分けられていることがわかると思います。
探索
次に探索してみます。search関数の引数にx,y,zの範囲を指定すると返り値にその範囲内の点が返されます。
results = np.array(tree.search([[0,10],[8,10],[0,6]]))
print(results)
fig = plt.figure()
ax = fig.gca(projection='3d')
ax.scatter(results[:,x_col],results[:,y_col],results[:,z_col])
plt.xlim([points[:,x_col].min()-1,points[:,x_col].max()+1])
plt.ylim([points[:,y_col].min()-1,points[:,y_col].max()+1])
plt.show()

"""
results : [[ 3 10  4]
 [ 7  8  6]
 [10 10  4]]
"""
(グラフがわかりにくいですが)できました。
どちらかというと3次元に拡張するより、アルゴリズムの理解と境界のグラフ表示に時間がかかりました。


