はじめに
今年も異常気象で各地で大雨による水害等が発生していますが、私も大雨が降ると水没するイオンがあるような地域に住んでいるので、どの場所が冠水するのかという情報は常に気になっています。
というわけで、今回は国土交通省が公開しているハザードマップをLeaflet上に表示させて水没しやすい地域を視覚化してみました。
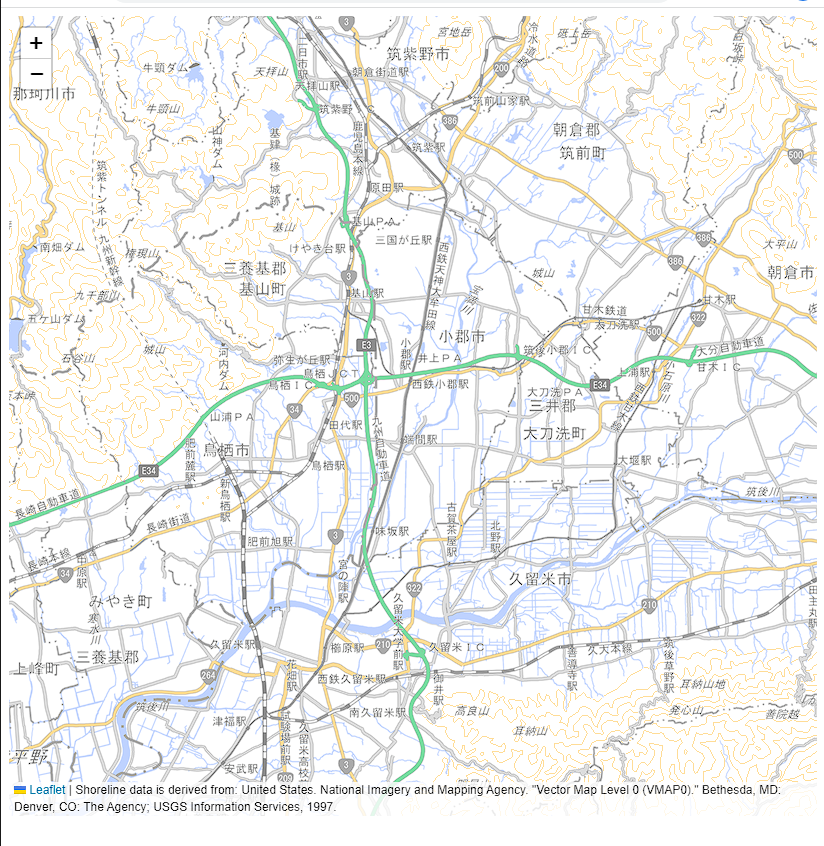
Step1 Leafletに地理院タイルを表示する
まずはLeafletのチュートリアルを参考に地理院タイルを表示させてみます。
今回、地理院タイルはハザードマップが見やすくなるように淡色地図を選んでみました。
<!DOCTYPE html>
<html>
  <head>
    <title>Leaflet</title>
  	<meta charset="utf-8">
  	<meta name="viewport" content="width=device-width, initial-scale=1.0">
    <link rel="stylesheet" href="https://unpkg.com/leaflet@1.9.4/dist/leaflet.css" integrity="sha256-p4NxAoJBhIIN+hmNHrzRCf9tD/miZyoHS5obTRR9BMY=" crossorigin=""/>
    <script src="https://unpkg.com/leaflet@1.9.4/dist/leaflet.js" integrity="sha256-20nQCchB9co0qIjJZRGuk2/Z9VM+kNiyxNV1lvTlZBo=" crossorigin=""></script>
    <style type="text/css">
    <!--
      #map { height: 800px;}
    -->
    </style>
  </head>
  <body>
    <div id="map"></div>
    <script>
    	var map = L.map('map').setView([33.40874793564865, 130.5637869912768], 15);
            L.tileLayer('https://cyberjapandata.gsi.go.jp/xyz/pale/{z}/{x}/{y}.png', {
            attribution: 'Shoreline data is derived from: United States. National Imagery and Mapping Agency. "Vector Map Level 0 (VMAP0)." Bethesda, MD: Denver, CO: The Agency; USGS Information Services, 1997.'
    	}).addTo(map);
    </script>
  </body>
</html>
Step2 ハザードマップを重ねる
ハザードマップポータルサイトが公開しているオープンデータを取得してLeaflet上のレイヤーとして重ねて表示させてみます。
オープンデータにも色々種類があるのですが、ここでは「洪水浸水想定区域(想定最大規模)」を取得してみます。
やり方は地理院タイルとほぼ同じです。URLさえ指定すれば後はLeafletが勝手にタイルを取得して表示してくれます。あと不透明度を50%にしています。
L.tileLayer('https://disaportaldata.gsi.go.jp/raster/01_flood_l2_shinsuishin_kuni_data/{z}/{x}/{y}.png', {
    opacity: 0.5
}).addTo(map);
地図上に洪水浸水想定区域が重なって表示されるようになります。
こうやって見ると、思った以上に広範囲がまっ赤に染まってヤバい地域だということが分かりますね。

