この記事は古川研究室 Workout_calendar 22日目の記事です.
本記事は古川研究室の学生が学習の一環として書いたものです.内容が曖昧であったり表現が多少異なったりする場合があります.
概要
第1回目と第2回目の記事は最尤推定とMAP推定の回帰に関しての記事でした.第3回目である本記事では,ベイズ推定を使用した回帰に関してまとめたいと思います.
この記事で行ったことは具体的に以下になります.
- (理論)ベイズ推定によるモデルのパラメータ$\mathbf{w}$の事後分布の推定
- (実装)導出した事後分布を用いた回帰
- (実装)逐次学習(パラメータ更新の部分)
- (実装)新規入力$x^*$に対する予測分布のプロット
ちなみに,ベイズ推定については第1回目の記事で簡単に触れているのでよろしければご覧ください
課題設定
与えられているもの
入力$\mathbf x=(x_1,...,x_N), x\in\mathbf R$と出力$\mathbf y=(y_1,...,y_N), y\in\mathbf R$のデータセット
仮定
・$\mathbf x$と$\mathbf y$のデータセットは,独立同分布(i.i.d.)に従うとします.
・$y_i,f,\epsilon$を次のように仮定します($\beta$はガウスノイズの精度でスカラーです).
\begin{eqnarray}
y_i&=&f(x_i;\mathbf w)+\epsilon_i
\end{eqnarray}
\begin{eqnarray}
f(x_i;\mathbf w)=\mathbf{w}^T\boldsymbol{\phi}(x_i)
\end{eqnarray}
\begin{eqnarray}
\epsilon_i&\sim& N(0,\beta^{-1})
\end{eqnarray}
$;;;$ここで,基底関数$\boldsymbol{\phi}(x)$とパラメータ$\mathbf{w}$は$D$個あるので次のようになります.
\begin{eqnarray}
\boldsymbol{\phi}(x_i)&=&(\phi_1(x_i),...,\phi_{D}(x_i))^T
\end{eqnarray}
\begin{eqnarray}
\mathbf{w}&=&(w_1,...,w_{D})^T
\end{eqnarray}
・事前分布は,あまり大きな$\mathbf{w}$を取らないと仮定します(ハイパーパラメータ$\alpha$はガウス分布の精度でスカラーです).
$$p(\mathbf w|\alpha)=N(\mathbf w|\mathbf 0,\alpha^{-1}\mathbf I)$$
ベイズ推定のタスク
ベイズの定理からパラメータ$\mathbf w$の事後分布を推定します.
\begin{eqnarray}
p(\mathbf {w}|\mathbf x, \mathbf y, \alpha, \beta)
&=&\frac{p(\mathbf y|\mathbf x,\mathbf w,\beta)p(\mathbf w|\alpha)}{p(\mathbf y|\mathbf x, \alpha, \beta)}\\\
\end{eqnarray}
また,推定して得られた$\mathbf w$の事後分布から,新規入力$x^*$に対する出力$y^*$の予測分布が得られます.
解析解の導出
-
ベイズの定理を用いて事後分布を推定する
-
新規入力$x^*$に対する出力$y^*$の予測分布を求める
1. パラメータの事後分布を推定する
はじめに,観測データ$(x_i,y_i)$が与えられているとすると,仮定から尤度$p\left(y_i|x_i,\mathbf{w},\beta\right)$は,
\begin{eqnarray}
p\left(y_i|x_i,\mathbf{w},\beta\right)
&=&N\left(y_i|f(x_i),\beta^{^-1}\right)\\
&=&\sqrt\frac{\beta}{{2\pi}}\exp\left(-\frac{\beta}{2}(y_i-f(x_i))^{2}\right)\\
&=&\sqrt\frac{\beta}{{2\pi}}\exp\left(-\frac{\beta}{2}\left(y_i-\mathbf{w}^{T}\boldsymbol{\phi}\left(x_i\right)\right)^{2}\right)
\end{eqnarray}
となります.ここで,計算を簡単にするために尤度に対数をとると,
\ln p\left(y_i|x_i,\mathbf{w},\beta\right)=\frac{1}{2}\ln \frac{\beta}{2\pi}-\frac{\beta}{2}\left(y_i-\mathbf{w}^{T}\boldsymbol{\phi}(x_i)\right)^{2}
です.従って,データ全体の対数尤度は,
\begin{eqnarray}
\ln p(\mathbf y|\mathbf x,\mathbf{w},\beta)
&=&\sum_{i=1}^{N}\ln p(y_i|x_i,\mathbf{w},\beta)\\
&=&\sum_{i=1}^{N} \left \{ \frac{1}{2}\ln \frac{\beta}{2\pi}-\frac{\beta}{2}(y_i-\mathbf{w}^{T}\boldsymbol{\phi}(x_i))^{2} \right\} \\
&=&-\frac{\beta}{2}\sum_{i=1}^{N}(y_i-\mathbf{w}^{T}\boldsymbol{\phi}(x_i))^{2}+\frac{N}{2}\ln \beta-\frac{N}{2}\ln {2\pi}\\
&=&-\frac{\beta}{2}\|\mathbf{y}-\Phi\mathbf{w}\|^{2}+\frac{N}{2}\ln \beta-\frac{N}{2}\ln {2\pi}\\
&=&-\frac{\beta}{2}\|\mathbf{y}-\Phi\mathbf{w}\|^{2}+const
\end{eqnarray}
となります.ここで,$N$はデータ数,$D$はパラメータの個数,$const$は$\mathbf{w}$に関して定数であることを表し,$\mathbf{y},\mathbf{w},\Phi$はそれぞれ,
\begin{eqnarray}
\mathbf{y}&=&\left(y_1,...,y_N\right)^{T}\\
\mathbf{w}&=&(w_1,...,w_D)^{T}\\
\Phi &=&
\left(
\begin{array}{cccc}
\phi_{1}(x_1) & \cdots & \phi_{D}(x_1)\\
\vdots & \ddots & \vdots\\
\phi_{1}(x_N) & \cdots & \phi_{D}(x_N)\\
\end{array}
\right)\\
\end{eqnarray}
となっています.
パラメータの事前分布
今,パラメータ$\mathbf w$はあまり大きな値を取らないと仮定すると.ガウス分布を使って事前分布$p(\mathbf{w}|\alpha)$を次のように定義できます.
\begin{eqnarray}
p(\mathbf{w}|\alpha)=N(\mathbf{w}|\mathbf 0,\alpha^{-1}\mathbf I)
\end{eqnarray}
ここで,$\alpha$はガウス分布の精度を表しており,ハイパーパラメータです.
更に,対数事前分布$\ln p(\mathbf{w}|\alpha)$は,
\begin{eqnarray}
\ln p(\mathbf w|\alpha)
&=&\ln \left\{\sqrt{\frac{\alpha}{2\pi}}\exp\left(-\frac{\alpha}{2}\|\mathbf w\|^2\right)\right\}
&=&-\frac{\alpha}{2}\|\mathbf w\|^2+const
\end{eqnarray}
となります.ここで,パラメータ$\mathbf{w}$に関して定数なものは$const$にまとめています.
パラメータの事後分布
ベイズの定理から,パラメータ$\mathbf{w}$の事後分布$p(\mathbf{w}|\mathbf x, \mathbf y,\alpha,\beta)$は
\begin{eqnarray}
\ln p(\mathbf{w}|\mathbf x, \mathbf y,\beta,\alpha)
&=& \ln p(\mathbf y|\mathbf x,\mathbf{w},\beta)+\ln p(\mathbf {w}|\alpha)-\ln p(\mathbf y|\mathbf x, \alpha,\beta)\\
&=& -\frac{\beta}{2}\|\Phi\mathbf{w}-\mathbf{y}\|^{2}-\frac{\alpha}{2}\|\mathbf{w}\|^{2}+const\\
&=&-\frac{\beta}{2}(\Phi\mathbf{w}-\mathbf{y})^{T}(\Phi\mathbf{w}-\mathbf{y})-\frac{\alpha}{2}\mathbf{w}^{T}\mathbf{w}+const\\
&=&-\frac{\beta}{2}\{\mathbf{w}^T\Phi^{T}\Phi\mathbf{w}-\mathbf{w}^T\Phi^T\mathbf{y}-\mathbf{y}^T\Phi\mathbf{w}+\mathbf{y}^T\mathbf{y}\}+\frac{\alpha}{2}\mathbf{w}^T\mathbf{w}+const\\
&=&-\frac{\beta}{2}\{\mathbf{w}^T\Phi^{T}\Phi\mathbf{w}-2\mathbf{y}^T\Phi\mathbf{w}+\mathbf{y}^T\mathbf{y}\}+\frac{\alpha}{2}\mathbf{w}^T\mathbf{w}+const\\
&=&-\frac{1}{2}(\beta\mathbf{w}^T\Phi^{T}\Phi\mathbf{w}+\alpha\mathbf{w}^T\mathbf{w})+(\beta\mathbf{y}^T\Phi)\mathbf{w}+const\\
&=&-\frac{1}{2}\mathbf{w}^T(\beta\Phi^{T}\Phi+\alpha \mathbf{I})\mathbf{w}+(\beta\mathbf{y}^T\Phi)\mathbf{w}+const
\end{eqnarray}
となっています.$const$については,パラメータ$\mathbf{w}$に無関係な定数です.ここで,尤度(関数)と事前分布の関係が共役な関係になるように事前分布を選ぶと事後分布が事前分布と同じ分布になるので,事後分布は多変量ガウス分布$N(\mathbf{w}|\mathbf{m,S})$になります.ここで,事後分布に対数を取ると対数事後分布$\ln p(\mathbf{w}|\mathbf x, \mathbf y,\alpha,\beta)$は,
\begin{eqnarray}
\ln p(\mathbf{w}|\mathbf x,\mathbf y,\alpha,\beta)
&=&\frac{1}{\sqrt{(2\pi)|S|}}\exp\left(-\frac{1}{2}(\mathbf{w}-\mathbf{m})^TS^{-1}(\mathbf{w}-\mathbf{m})\right)\\
&=&-\frac{1}{2}(\mathbf{w}-\mathbf{m})^TS^{-1}(\mathbf{w}-\mathbf{m})+const\\
&=&-\frac{1}{2}\mathbf{w}^TS^{-1}\mathbf{w}+\mathbf{m}^{T}\mathbf{S}^{-1}\mathbf{w}+const
\end{eqnarray}
となって,先ほど導出した対数尤度の式
\begin{eqnarray}
\ln p(\mathbf w|X,\beta,\alpha)=-\frac{1}{2}\mathbf w^T(\beta\Phi^{T}\Phi+\alpha \mathbf I)\mathbf w+(\beta\mathbf y^T\Phi)\mathbf w+const
\end{eqnarray}
と見比べると,「$\mathbf{w}^{T}〇\mathbf{w}$」と「$〇\mathbf{w}$」の項の係数は対応した関係になっているので次のようになります.
\begin{eqnarray}
\mathbf{S}^{-1}=(\beta\Phi^{T}\Phi+\alpha \mathbf{I})
\end{eqnarray}
\begin{eqnarray}
\mathbf{m}^{T}\mathbf{S}^{-1}=\beta\mathbf{y}^T\Phi
\end{eqnarray}
これを$\mathbf{m}$と$\mathbf{S}$について解きます.まず,$\mathbf{S}$は次のようになります.
$$\mathbf{S}=(\beta\Phi^{T}\Phi+\alpha \mathbf{I})^{-1}$$
次に,$\mathbf{m}$を求めるために式変形すると
\begin{eqnarray}
\mathbf m^T\mathbf{S}^{-1}&=&\beta\mathbf{y}^T\Phi\\
\mathbf m^T&=&\beta\mathbf{y}^T\Phi S\\
\mathbf m^T&=&\beta\mathbf{y}^T\Phi (\beta\Phi^{T}\Phi+\alpha \mathbf{I})^{-1}\\
\mathbf m^T&=&\mathbf y^T\Phi(\Phi^T\Phi+\lambda \mathbf I)^{-1}\\
\end{eqnarray}
従って,$\mathbf{m}$は
\begin{eqnarray}
\mathbf{m}
&=&(y^T\Phi(\Phi^T\Phi+\lambda \mathbf I)^{-1})^T\\
&=&((\Phi^{T}\Phi+\lambda \mathbf{I})^{-1})^T(\mathbf y^T\Phi)^T\\
&=&(\Phi^{T}\Phi+\lambda \mathbf{I})^{-1}\Phi^{T}\mathbf{y}
\end{eqnarray}
となります.ここで,$(\Phi^{T}\Phi+\lambda \mathbf{I})^{-1}$は対称行列,$\lambda$は$\lambda=\frac{\alpha}{\beta}$です.
まとめると,事後分布が多変量ガウス分布$N(\mathbf{w}|\mathbf{m},\mathbf{S})$のとき,その$\mathbf m$と$\mathbf S$は,
\begin{eqnarray}
\mathbf{S}&=&(\beta\Phi^{T}\Phi+\alpha \mathbf{I})^{-1}\\
\mathbf{m}&=&(\Phi^{T}\Phi+\lambda \mathbf{I})^{-1}\Phi^{T}\mathbf{y}
\end{eqnarray}
となることが分かりました.ここで,$\mathbf{m}$についてよく見てみるとこれはパラメータをMAP推定したときの結果と一致していることが分かります.つまり,ベイズ推定で求めたパラメータの事後分布の平均値はMAP推定の結果と等価になるということがこのことから分かります.
2. 新規入力に対する予測分布を求める
推定された事後分布から,新規入力$x^*$に対する出力$y^*$の予測分布$p(y^{*}|x^{*},\mathbf x, \mathbf y,\alpha,\beta)$は次のようになります.
\begin{eqnarray}
p(y^{*}|x^{*},\mathbf x,\mathbf y,\alpha,\beta)
&=&\int p(y^{*}|x^{*},\mathbf{w},\beta)p(\mathbf{w}|\mathbf x, \mathbf y,\alpha,\beta)d\mathbf{w}\\
&=&\int N(y^{*}|\mathbf{w}^{T}\mathbf{\phi}(x^{*}),\beta^{-1})N(\mathbf{w}|\mathbf{m,S})d\mathbf{w}
\end{eqnarray}
この予測分布の式は,ガウス分布同士の畳み込み積分になっています.ここで,ガウス分布同士の畳み込み積分を求める公式は,パターン認識と機械学習[1]の式2-116を使うと,次のように求めることができます(この部分はいずれ証明したい).
\begin{eqnarray}
p(y^{*}|x^{*},\mathbf x, \mathbf y,\alpha,\beta)=N(y^{*}|\mathbf{m}^T\mathbf{\phi}(x^*),\beta^{-1}+\mathbf{\phi}(x^*)^T\mathbf{S}\mathbf{\phi}(x^*))
\end{eqnarray}
おまけ 事後分布の更新について
実際の環境では,例えばPCのメモリの都合などで全てのデータを一度に計算できなかったり,逐一結果を確認したい場合があります.そこで,データを分割して事後分布を逐次的に更新できるようにしたいです.ここで,尤度に対して共役な事前分布を選ぶことで事後分布が事前分布と同じ確率分布になることを利用し,次の時刻$t+1$での事後分布の$\mathbf m_{t+1},\mathbf S_{t+1}$は,現在の時刻$t$での$\mathbf m_{t},\mathbf S_{t}$の結果を使って次のようになります(この証明もいずれしたい).
\begin{eqnarray}
\mathbf{S}_{t+1}&=&\mathbf{S}_{t}^{-1}+\beta\Phi^T\Phi\\
\mathbf{m}_{t+1}&=&\mathbf{S}_{t+1}(\mathbf{S}_{t}^{-1}\mathbf{m}_{N}+\beta\Phi^{T}\mathbf y)
\end{eqnarray}
ベイズ推定を用いた回帰の実装
実験1.ベイズ推定を用いた線形回帰
はじめに,ベイズ推定を用いた最も単純な線形回帰を実装します.実装したプログラムは以下となっており,事前分布の精度$\alpha=1$,ガウスノイズの精度$\beta=0.5$と仮定しています.
# ベイズ推定を用いた線形回帰
%matplotlib inline
import numpy as np
import matplotlib.pyplot as plt
import matplotlib.animation as anim
import copy

def phi(X):
    # X      : [[x0],[x1],...]
    # return : [[phi_1(x),...,phi_n(x)] for x in X]

    Phi = np.array([[1,x[0]] for x in X]) # 9th poliminal
    return Phi.T

def Phi(X):
    return phi(X).T

def maltivariate_gaussian_distribution(x, mu, sigma):
    # x(weight): D dimension maltivariate
    #        mu: D dimension
    #     sigma: D×D dimension
    exp = np.exp(-(1/2)*np.dot(np.transpose(x-mu), np.dot(np.linalg.inv(sigma),(x-mu))))
    return (1/(np.sqrt(2*np.pi)**(mu.shape[0]/2)))*(1/np.linalg.det(sigma)**(1/2))*exp

# モデルをデータにfitする
def update(n, ax, sample):
    global S, m, posterior, prior, w0, w1
    ax[0].cla()
    ax[1].cla()
    ax[2].cla()

    # データを全て使用して学習するとき
    #a = sample[:,0] + epsilon
    #b = sample[:,1] + epsilon

    # データを少しずつ増やして学習するとき(今までのデータ+新規データで使用するとき)
    #a = np.array(sample[:n+1,0]) + epsilon
    #b = np.array(sample[:n+1,1]) + epsilon

    # 新規データだけで逐次的に学習するとき(今までのデータは使用しない)
    a = np.array([[i] for i in sample[n,0]]) + epsilon
    b = np.array([[i] for i in sample[n,1]]) + epsilon

    # 事後分布
    if n == 0:
        temp = beta*np.dot(Phi(a).T, Phi(a))
        S = np.linalg.inv(temp + alpha*np.eye(len(temp)))
        m = np.dot(beta*np.dot(S, Phi(a).T), b)
    S0 = copy.deepcopy(S)
    m0 = copy.deepcopy(m)
    S = np.linalg.inv(np.linalg.inv(S0) + beta*np.dot(Phi(a).T, Phi(a)))
    m = np.dot(S, (np.dot(np.linalg.inv(S0), m0) + beta*np.dot(Phi(a).T, b)))

    # 事後分布から重みパラメータを確率的に選択
    multi_normal = np.random.multivariate_normal(m.ravel(), S, size=5)
    w0_pred = multi_normal[:, 0]
    w1_pred = multi_normal[:, 1]

    # 描画
    cordinate = []
    X, Y=np.meshgrid(np.linspace(-scope,scope,N),np.linspace(-scope,scope,N))
    for i in range(len(X)):
        temp = []
        for j in range(len(Y)):
            temp.append([[X[i,j]], [Y[i,j]]])
        cordinate.append(temp)
    cordinate = np.array(cordinate)

    posterior = np.array(posterior)
    posterior = np.array([maltivariate_gaussian_distribution(cordinate[i,j], m, S) for i in range(N) for j in range(N)])
    posterior = posterior.reshape(N,N)

    ax[0].pcolormesh(X, Y, posterior, cmap=None)
    ax[0].scatter(w0_pred, w1_pred, marker='x', c='r', label='sample',s=75)
    ax[1].plot(np.linspace(-scope,scope,N), w0 + w1 * np.linspace(-scope,scope,N), label='true line',color='b', zorder=1)
    ax[1].scatter(a, b, label='train data', color='b',marker='*',s=75,zorder=3)
    for k, (wp0, wp1) in enumerate(zip(w0_pred, w1_pred)):
        ax[1].plot(np.linspace(-scope,scope,N), wp0 + wp1 * np.linspace(-scope,scope,N), label='predicted line' if k==0 else "", c='r', zorder=2)
    ax[0].set_title('prior/posterior({}epoch)'.format(n+1))
    ax[1].set_title('data space({}epoch)'.format(n+1))
    ax[0].set_xlabel('w0')
    ax[0].set_ylabel('w1')
    ax[1].set_xlabel('x')
    ax[1].set_ylabel('y')
    ax[1].set_xlim(-scope,scope)
    ax[1].set_ylim(-scope,scope)

    # 予測分布を求める
    # 2次元座標を与えて各点の確率を出力する
    predictive_distribution = np.zeros((N,N))
    for i, x_i in enumerate(np.linspace(-scope,scope,N)):     # x座標
        for j, y_j in enumerate(np.linspace(-scope,scope,N)): # y座標
            x_i = np.array([[x_i]])
            y_j = np.array([[y_j]])
            pd_m = np.dot(m.T, phi(x_i))
            pd_S = beta**(-1) + np.dot(np.dot(phi(x_i).T, S), phi(x_i))
            predictive_distribution[j][i] = maltivariate_gaussian_distribution(y_j, pd_m, pd_S).ravel()[0]

    ax[2].pcolor(np.linspace(-scope,scope,N), np.linspace(-scope,scope,N), predictive_distribution)
    ax[2].scatter(x_test,y_test,label='test data',color='r',marker='*',s=75)
    ax[2].set_title('predictive distribution({}epoch)'.format(n+1))
    ax[2].set_xlabel('x')
    ax[2].set_ylabel('y')
    ax[2].set_xlim(-scope,scope)
    ax[2].set_ylim(-scope,scope)
    fig.tight_layout()
    ax[0].legend(loc='upper right')
    ax[1].legend(loc='upper right')
    ax[2].legend(loc='upper right')

if __name__ == '__main__':
    np.random.seed(0)
    N = 100              # 学習データの個数
    N_test = 25          # テストデータの個数
    beta = 0.5           # 既知であると仮定
    alpha = 1            # ハイパーパラメータ
    epsilon = 0.000001   # ランク落ちのための値
    epochs = 50          # 試行回数
    scope = 3.0          # データの定義域 -scope から scope まで
    w0 = -0.3            # 直線の切片パラメータ
    w1 = 0.5             # 直線の傾きパラメータ
    prior = []
    posterior = []

    x = np.linspace(-scope,scope,N)
    y = (w0 + w1 * x) + np.random.normal(0, beta, N)
    x_test = np.linspace(-scope,scope,N_test)
    y_test = np.sin(x_test) + np.random.normal(0, 0.5, len(x_test))

    x = np.array([[i] for i in x])
    y = np.array([[i] for i in y])

    # データをシャッフルする
    sample = np.random.permutation([[i,j] for i,j in zip(x,y)])
    fig, ax = plt.subplots(1,3,figsize=(12,4))
    ani = anim.FuncAnimation(fig, update, fargs = (ax, sample), interval = 400, frames = 30)
    ani.save("bayesian_linear_regression.gif", writer = 'imagemagick')
    print('finished')
実験1-1 学習データを1試行ごとに増やしたときの線形回帰
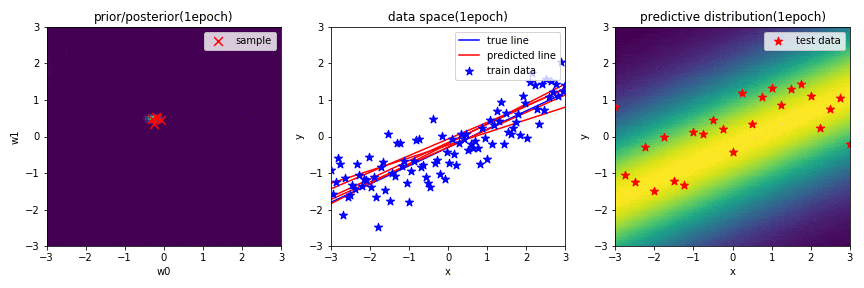
はじめに,学習結果の図についての簡単な説明をします.
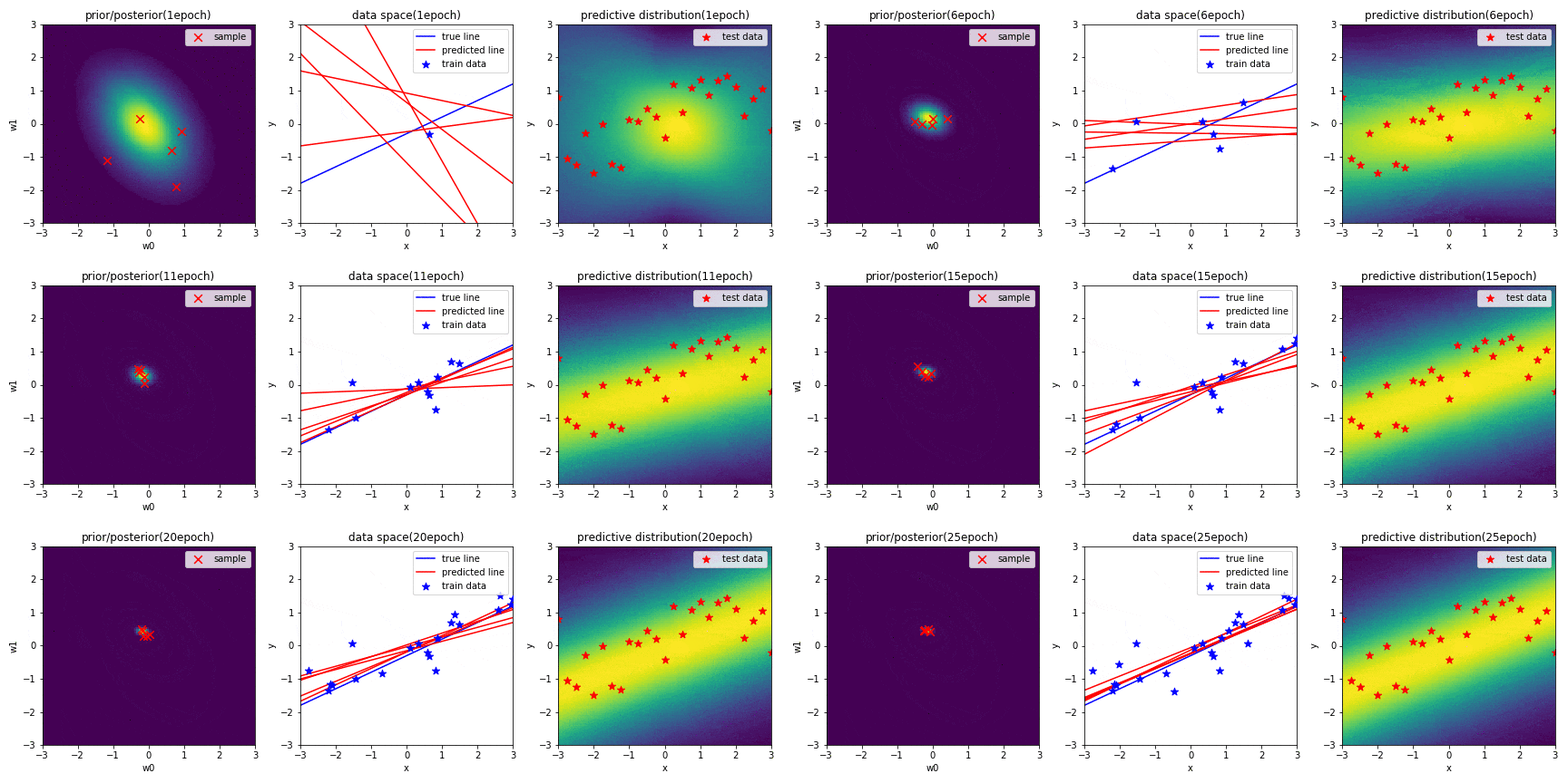
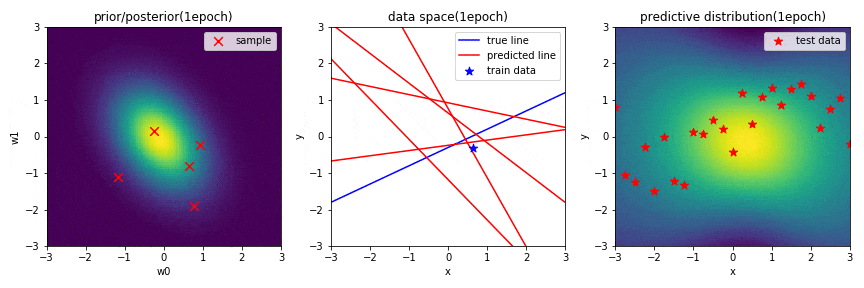
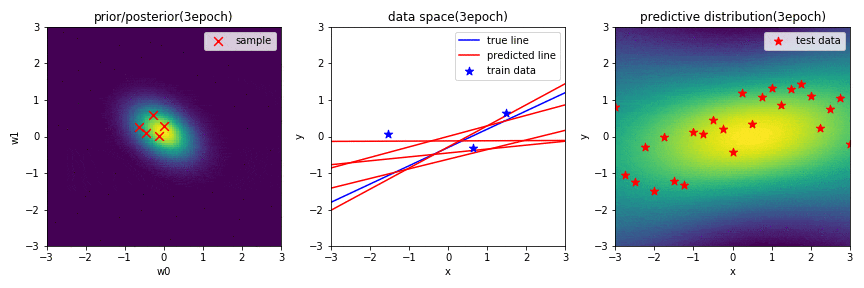
左図は,パラメータ$\mathbf{w}$に関する2次元ガウス分布の事後分布を表しています.赤×は,この分布からランダムでサンプリングされた$\mathbf{w}(w_0, w_1)$を示しています.
中央の図は,横軸が入力$x$,縦軸が出力$y$のデータ空間を表しています.青の直線は真の関数,青点は観測データ,赤の直線は,左図の分布からランダムでサンプリングされた$\mathbf{w}(w_0, w_1)$によって引かれる直線を示しています.
右図は,新規入力$x^*$に対する出力$y^*$の予測分布を表しており,出力値に対して,自信があるときは確率が高く,自信があまりない(不確実性が高い)ときは確率が低く表示されます.また,汎化性があるかどうかを確認するために,テストデータを配置しています.
※ 左図と右図のカラーマップは,黄色に近いほど確率が高く,また,黒色に近いほど確率が低いことを表しています.
データを1点学習したときの学習結果(GIF画像の1epoch目)
中央の図から,$\mathbf{w}$の事後分布からランダムにサンプリングした$\mathbf{w}$で引いた赤の直線が,学習したデータ近傍を通る直線になっていることが分かります.更に,予測分布に関しても,学習した場所から離れるにつれて,不確実性が高くなっていることが分かります.
データを3点学習したときの学習結果(GIF画像の3epoch目)
中央の図から,データを3点学習しただけで,ある程度同じ指向性を持った直線が何度も引けていることが分かります.また,予測分布が少し直線のような形状になっていることが分かります.
データを25点学習したときの学習結果(GIF画像の25epoch目)
十分データを学習した結果,$\mathbf{w}$の事後分布がほとんど収束したことが分かります.そのため,中央の図から,何度$\mathbf{w}$をサンプリングしても似たような直線になっていることが分かります.更に,予測分布も,はっきりと直線のような外形になっていることが確認できました.
実験1-2 新規データのみ学習したときの線形回帰
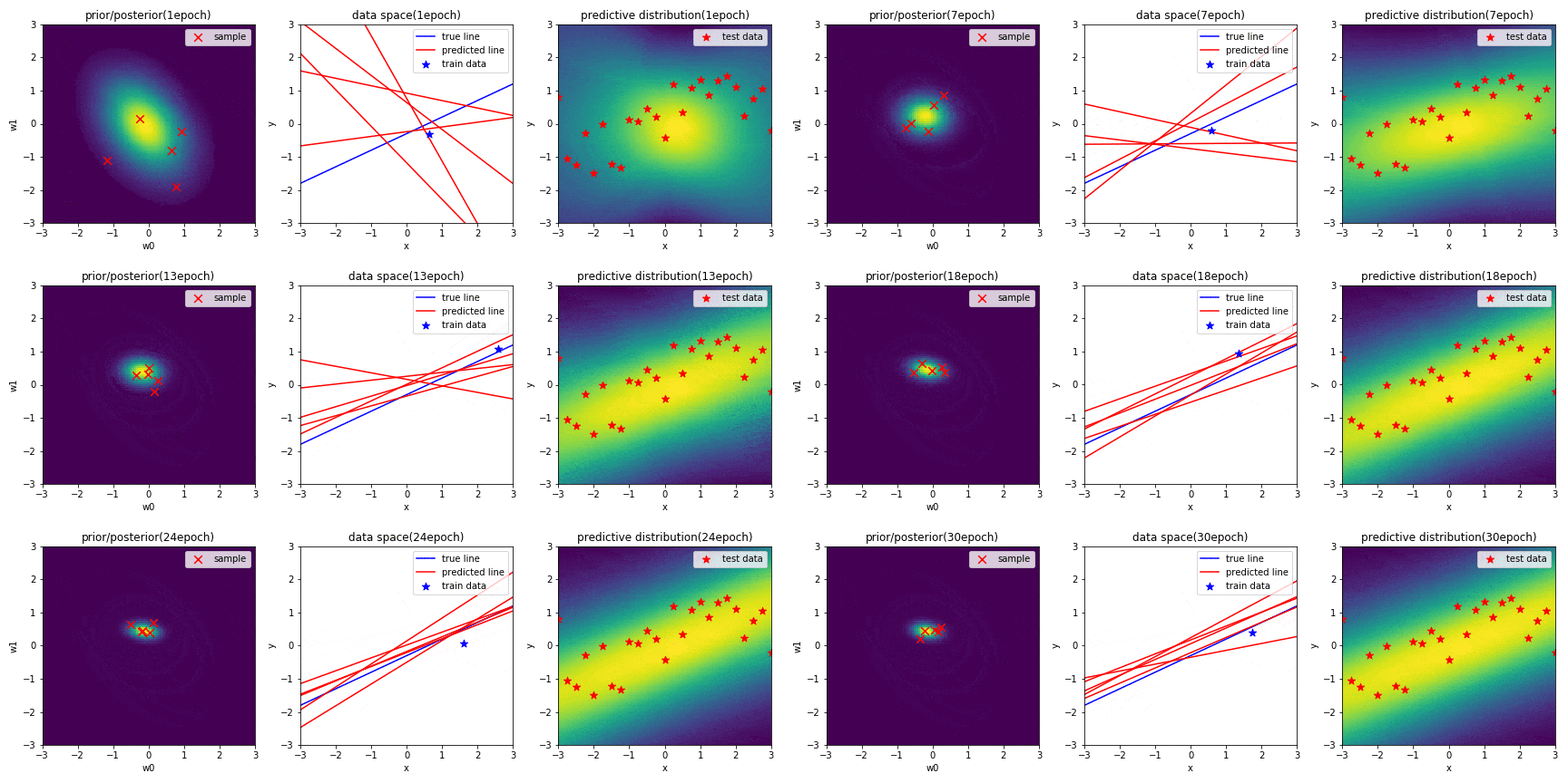
新規データだけを学習したときの結果が上のGIF画像です.1-1の結果と比べ,$\mathbf{w}$の事後分布が収束するのに時間がかかっていますが,推定自体は上手くできていることが分かります.
実験1-3 大量のデータを一度に学習したときの線形回帰
新規データを一度に100点学習させたときの結果が上図です.大量のデータを一度に学習させることで,1-1の結果と比べて$\mathbf{w}$の事後分布が早く収束することが分かりました.
実験2 ベイズ推定を用いたsin関数の回帰
次に,sin関数に対して多項式を用いて回帰を行います.
# ベイズ推定を用いたsin関数の回帰
%matplotlib inline
import numpy as np
import matplotlib.pyplot as plt
import matplotlib.animation as anim
import copy

def phi(X):
    # X      : [[x0],[x1],...]
    # return : [[phi_1(x),...,phi_n(x)] for x in X]

    #Phi = np.array([[1,x[0],x[0]**2,x[0]**3] for x in X]) # 3 poliminal
    Phi = np.array([[1,x[0],x[0]**2,x[0]**3,x[0]**4,x[0]**5,x[0]**6,x[0]**7,x[0]**8,x[0]**9] for x in X]) #  poliminal
    return Phi.T

def Phi(X):
    return phi(X).T

def maltivariate_gaussian_distribution(x, mu, sigma):
    # x(weight): D dimension maltivariate
    #        mu: D dimension
    #     sigma: D×D dimension
    exp = np.exp(-(1/2)*np.dot(np.transpose(x-mu), np.dot(np.linalg.inv(sigma),(x-mu))))
    return (1/(np.sqrt(2*np.pi)**(mu.shape[0]/2)))*(1/np.linalg.det(sigma)**(1/2))*exp

# モデルをデータにfitする
def update(n, ax, sample):
    global S, m
    ax[0].cla()
    ax[1].cla()

    # データを全て使用して学習するとき
    #a = sample[:,0] + epsilon
    #b = sample[:,1] + epsilon

    # データを少しずつ増やして学習するとき(今までのデータ+新規データで使用するとき)
    a = np.array(sample[:n+1,0]) + epsilon
    b = np.array(sample[:n+1,1]) + epsilon

    # 新規データだけで逐次的に学習するとき(今までのデータは使用しない)
    #a = np.array([[i] for i in sample[n,0]]) + epsilon
    #b = np.array([[i] for i in sample[n,1]]) + epsilon

    # 事後分布
    if n == 0:
        temp = beta*np.dot(Phi(a).T, Phi(a))
        S = np.linalg.inv(temp + alpha*np.eye(len(temp)))
        m = np.dot(beta*np.dot(S, Phi(a).T), b)
    S0 = copy.deepcopy(S)
    m0 = copy.deepcopy(m)
    S = np.linalg.inv(np.linalg.inv(S0) + beta*np.dot(Phi(a).T, Phi(a)))
    m = np.dot(S, (np.dot(np.linalg.inv(S0), m0) + beta*np.dot(Phi(a).T, b)))

    # 事後分布から重みパラメータを確率的に選択する
    multi_norm = np.random.multivariate_normal(m.ravel(), S, size=5)

    # 描画
    ax[0].plot(np.linspace(-scope,scope,N), np.sin(np.linspace(-scope,scope,N)), label='true curve',color='b', zorder=1)
    ax[0].scatter(a, b, label='train data', color='b',marker='*',s=75,zorder=3)
    r = np.linspace(-scope,scope,N)
    for w in multi_norm:
        ax[0].plot(r, [np.dot(w, [t**i for i in range(len(w))]) for t in r], c='r', zorder=2)
    ax[0].set_title('data space({}epoch)'.format(n+1))
    ax[0].set_xlabel('x')
    ax[0].set_ylabel('y')
    ax[0].set_xlim(-scope,scope)
    ax[0].set_ylim(-2,2)

    # 予測分布を求める
    # 2次元座標を与えて各点の確率を出力する
    predictive_distribution = np.zeros((N,N))
    for i, x_i in enumerate(np.linspace(-scope,scope,N)):     # x座標
        for j, y_j in enumerate(np.linspace(-scope,scope,N)): # y座標
            x_i = np.array([[x_i]])
            y_j = np.array([[y_j]])
            pd_m = np.dot(m.T, phi(x_i))
            pd_S = beta**(-1) + np.dot(np.dot(phi(x_i).T, S), phi(x_i))
            predictive_distribution[j][i] = maltivariate_gaussian_distribution(y_j, pd_m, pd_S).ravel()[0]

    ax[1].pcolor(np.linspace(-scope,scope,N), np.linspace(-scope,scope,N), predictive_distribution)
    ax[1].scatter(x_test,y_test,label='test data',color='r',marker='*',s=75)
    ax[1].set_title('predictive distribution({}epoch)'.format(n+1))
    ax[1].set_xlabel('x')
    ax[1].set_ylabel('y')
    ax[1].set_xlim(-scope,scope)
    ax[1].set_ylim(-2,2)
    fig.tight_layout()
    ax[0].legend(loc='upper right')
    ax[1].legend(loc='upper right')

if __name__ == '__main__':
    np.random.seed(100)
    N = 100              # 学習データの個数
    N_test = 25          # テストデータの個数
    beta = 1             # 既知であると仮定
    alpha = 1            # ハイパーパラメータ
    epsilon = 0.000001   # ランク落ちのための値
    epochs = 50          # 試行回数
    scope = 4.0          # データの定義域 -scope から scope まで

    x = np.linspace(-scope,scope,N)
    y = np.sin(x) + np.random.normal(0, 0.5, N)
    x_test = np.linspace(-scope,scope,N_test)
    y_test = np.sin(x_test) + np.random.normal(0, 0.5, len(x_test))

    x = np.array([[i] for i in x])
    y = np.array([[i] for i in y])

    # データをシャッフルする
    sample = np.random.permutation([[i,j] for i,j in zip(x,y)])
    fig, ax = plt.subplots(1,2,figsize=(14,6))
    ani = anim.FuncAnimation(fig, update, fargs = (ax, sample), interval = 400, frames = 5)
    ani.save("bayesian_regression_poliminal.gif", writer = 'imagemagick')
    print('finished')
実験2-1 9次多項式による回帰
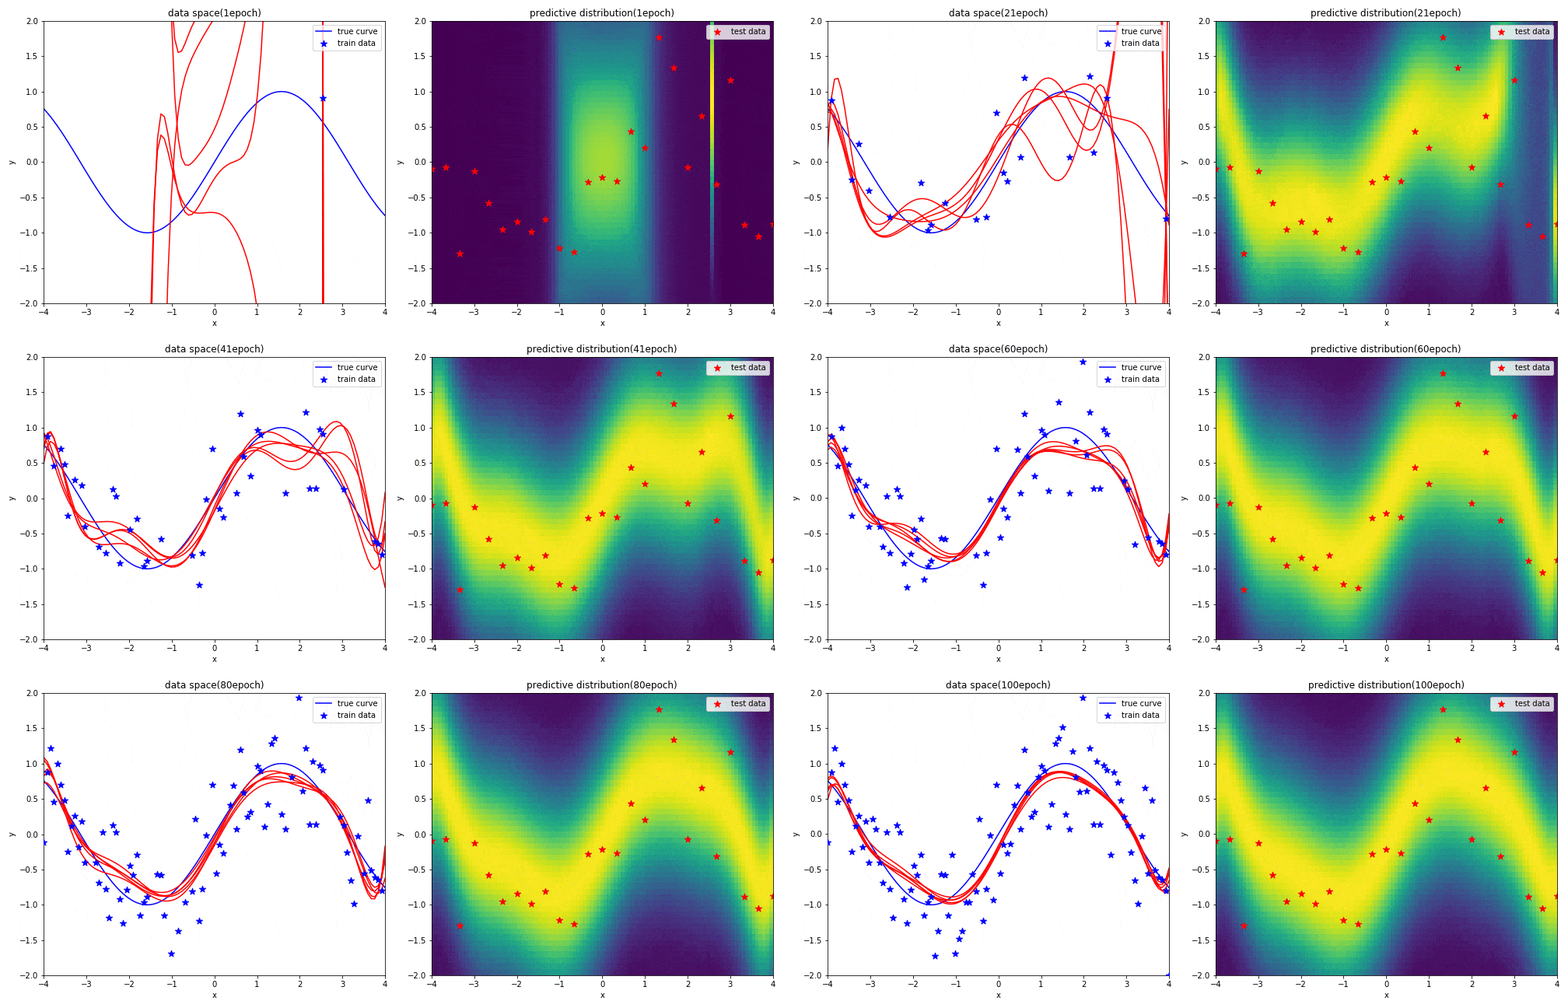
はじめに左図がデータ空間を,右図が予測分布を表しています.見方については,実験1と同じです.
表現力が高い9次多項式を用いると,初めの方の学習では発散したような曲線になるものの,ある程度データを学習させればsin関数に上手く曲線フィッテイングできることが分かりました.
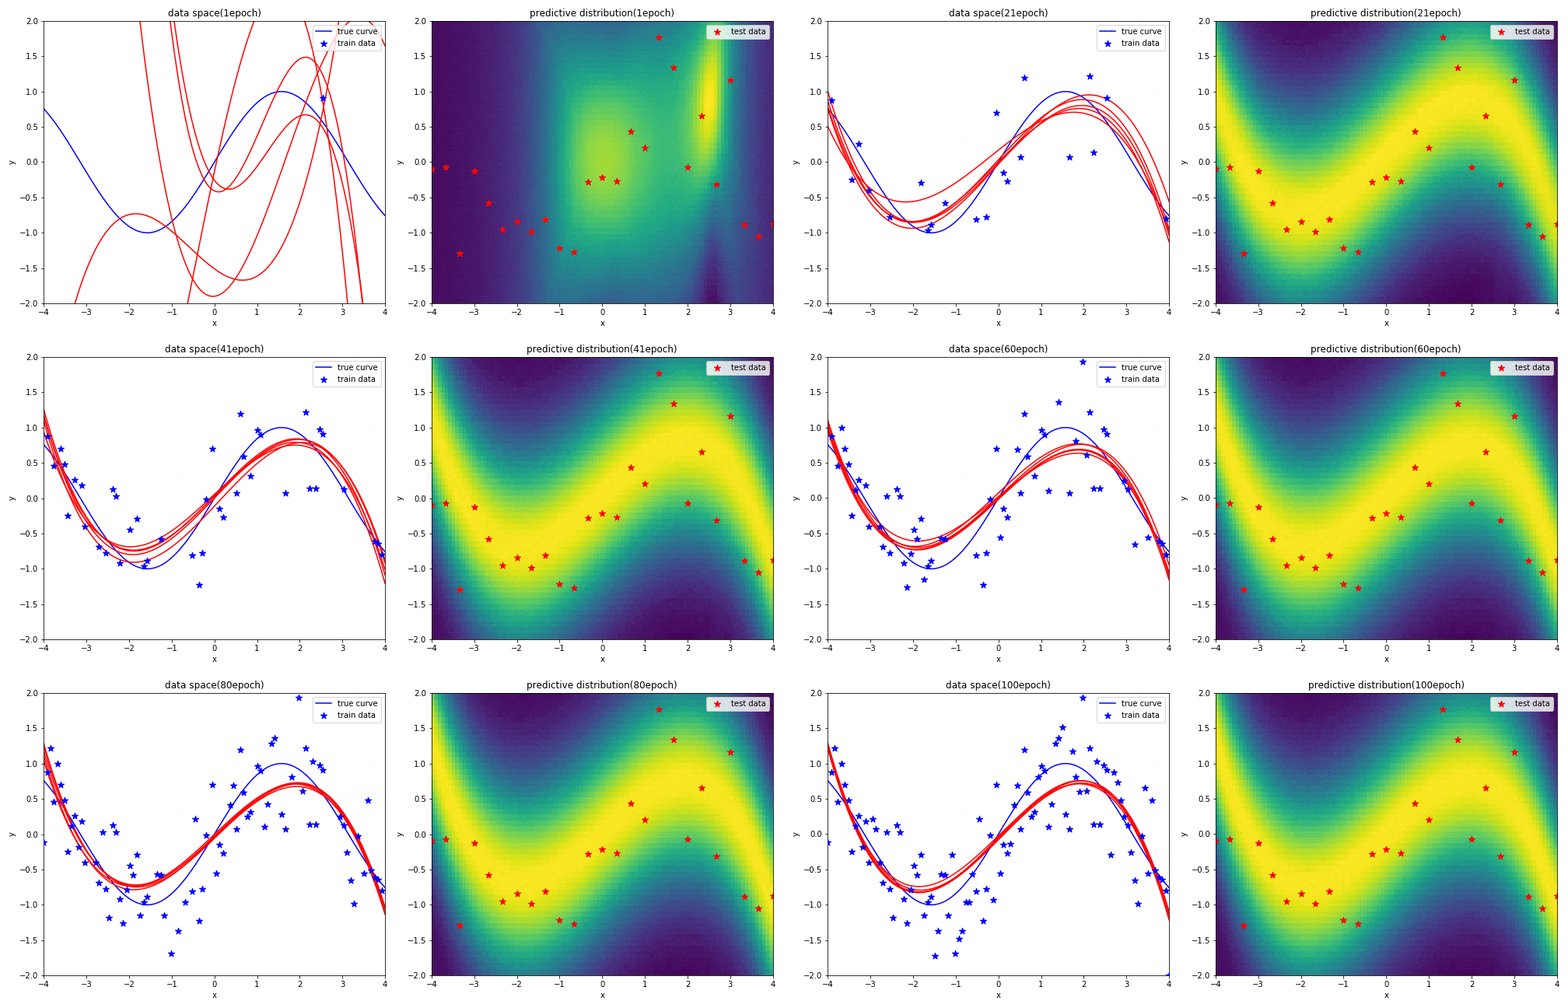
実験2-2 3次多項式による回帰
$x$が-1から1の範囲におけるsin関数に対して,3次多項式を使うことで上手く曲線フィッテングできることが分かります.
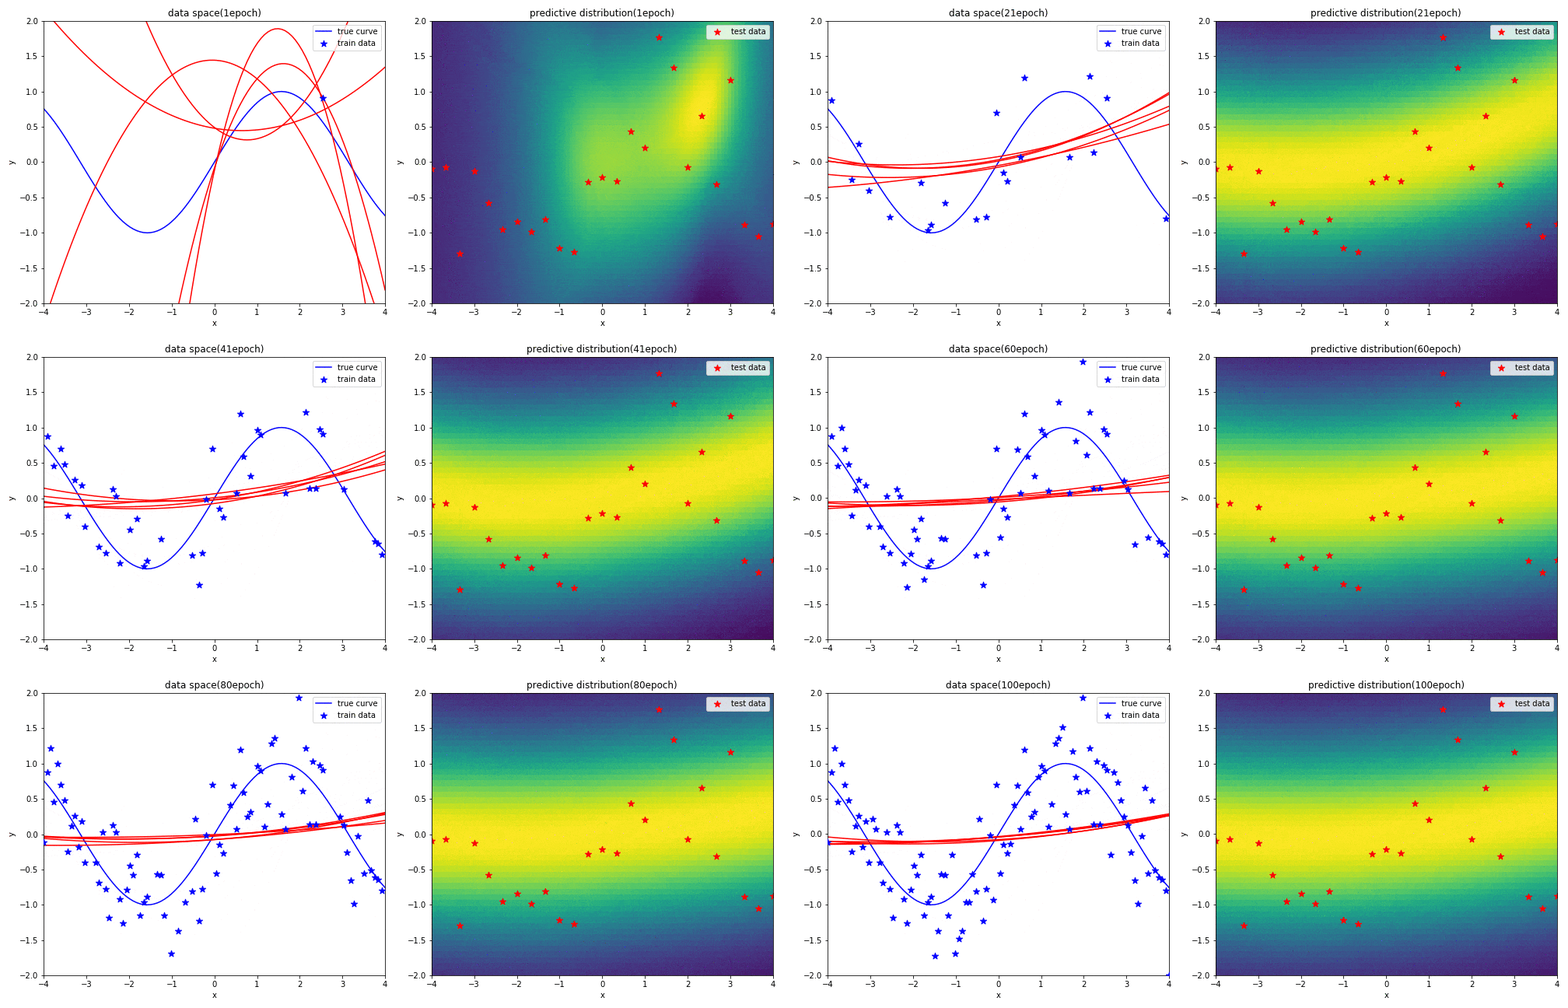
実験2-3 2次多項式による回帰
2次多項式の表現力がsin関数に対して足りていないため,上手く曲線フィッテングができていないことが分かります.予測分布の広がり(分散)も非常に大きくなっています.
感想
ベイズ推定の数式を導き,スクラッチで実装したことでベイズ推定や確率分布についての理解が深まりました.
