随時更新していくつもりです。
目的
pythonの開発環境をPoetryとDockerで構築し、データの可視化をmatplotlibで行えることを目指します。
- Dockerfileを作る
- Docker image をビルドする
- コンテナを起動する
- 動作を確認する
1.Dockerfileを作る
Dockerfile
FROM python:3.8.3-buster

ENV DISPLAY=host.docker.internal:0.0
ENV PATH $PATH:/root/.poetry/bin

RUN mkdir -p /workspace

RUN apt-get update \
    && apt-get install -y git \
    curl \
    && curl -sSL https://raw.githubusercontent.com/python-poetry/poetry/master/get-poetry.py | python

WORKDIR /workspace

CMD ["/bin/bash"]
2.Docker image をビルドする
Dockerfileがあるディレクトリで以下のコマンドを実行します。
sudo docker build -t python3.8 .
3.コンテナを起動
macosxとubuntuで挙動が違ったため、以下のように書きました。windowsは未確認です。
build.sh
# !/bin/bash

if [[ "$OSTYPE" == "darwin"* ]]; then
    xhost +localhost:
    docker run -it --rm \
        -v /tmp/.X11-unix:/tmp/.X11-unix \
        python3.8 \
        /bin/bash
    xhost -localhost:
else
    xhost +local:
    docker run -it --rm \
        -v /tmp/.X11-unix:/tmp/.X11-unix \
        -e DISPLAY=$DISPLAY \
        python3.8 \
        /bin/bash
    xhost -local:
fi
4.動作確認
poetry --version
Poetry version 1.0.5
プロジェクト作成
poetry new sample
Created package sample in sample
apt-get update && apt-get install tree
tree sample
sample
├── README.rst
├── pyproject.toml
├── sample
│   └── __init__.py
└── tests
    ├── __init__.py
    └── test_sample.py
ライブラリのインストール
cd sample
poetry add matplotlib
Using version ^3.2.1 for matplotlib

Updating dependencies
Resolving dependencies... (19.2s)

Writing lock file


Package operations: 14 installs, 0 updates, 0 removals

  - Installing pyparsing (2.4.7)
  - Installing six (1.15.0)
  - Installing attrs (19.3.0)
  - Installing cycler (0.10.0)
  - Installing kiwisolver (1.2.0)
  - Installing more-itertools (8.3.0)
  - Installing numpy (1.18.4)
  - Installing packaging (20.4)
  - Installing pluggy (0.13.1)
  - Installing py (1.8.1)
  - Installing python-dateutil (2.8.1)
  - Installing wcwidth (0.1.9)
  - Installing matplotlib (3.2.1)
  - Installing pytest (5.4.2)
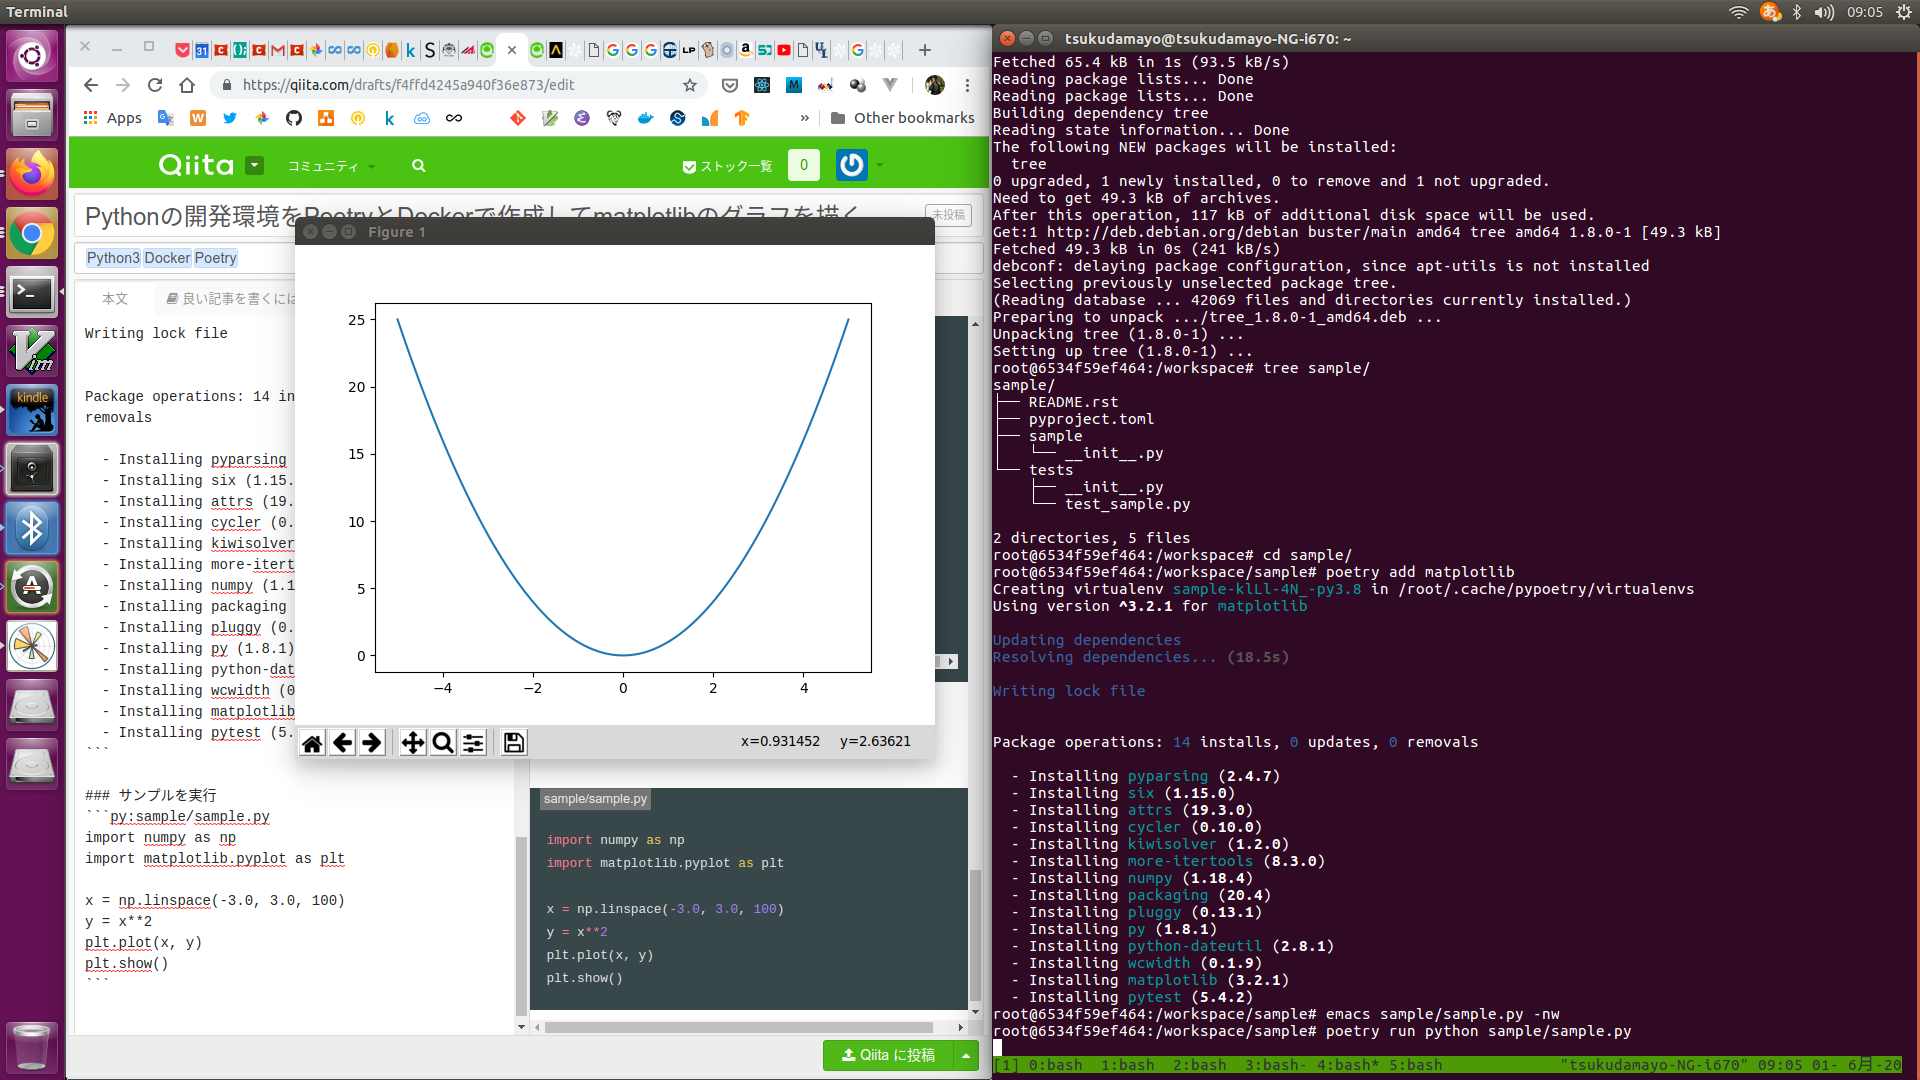
サンプルを実行
sample/sample.py
import numpy as np
import matplotlib.pyplot as plt

x = np.linspace(-3.0, 3.0, 100)
y = x**2
plt.plot(x, y)
plt.show()
結果