TL;DR
- Windows のイベント ログ以上の情報(トレース)を取得してトラブルシューティングしたい
- ETLトレースのデコードの方法を知る
- トレースの解析方法を知る
ETL トレースとは
こちらを参照してください。
Event Tracing for Windows (ETW)
https://blogs.msdn.microsoft.com/jpwdkblog/2011/12/27/event-tracing-for-windows-etw/
要は、ログ取得の制御や出力のフレームワーク的なものです。
記事にもあるように、ETLは、バイナリ形式で出力されるため、そのままのファイル形式では、読み取ることが出来ません。
そこで、以下で、テキストに変換する方法を説明します。
ETL トレースの取得方法
ETL トレースは、上記記事にあるように、logman.exe で取得する方法が簡単です。
Logman
https://technet.microsoft.com/en-us/library/bb490956.aspx
開始
以下は、AFD のトレースを取得する例です。
logman start afd -p {E53C6823-7BB8-44BB-90DC-3F86090D48A6} 0x800000000000003f 255 -ets -ft 1 -max 5000 -mode globalsequence -f bincirc
停止
C:\Users\tsunomur>logman stop -ets afd
コマンドは、正しく完了しました。
ETL トレースのデコード
まず、ETL トレースのデコードは、必ずできるとは限りません。
ソースコードがないために、正しい情報が出てこない場合があります。
※その場合は、Microsoft のサポートへ問い合わせる必要があります。
その結果デコードの結果を提供できない場合もありますが。。。
ひとまず、以下の方法で出来ないかをまずは試してみます。
1. netsh を使う方法
netsh trace を使用するとデコードが出来ます。
netsh trace convert input=<ETL ファイル> output=<出力先>

例)
netsh trace convert input=afd.etl output=afd.txt
2. 専用のデコードツールを使う方法
専用ツールを使ってトレースを取得する場合、デコード用のツールが用意されていることがあります。
以下に、よくあるコンポーネントのトレースの取得方法とデコード方法を紹介します。
(随時アップデート予定)
■ ボリューム シャドーサービス(VSS)
VSS のETLは、vsstrace.exe というツールでトレースの取得、デコードが出来ます。
以下のサイトが参考になります。
https://blogs.technet.microsoft.com/askcore/2012/04/29/how-to-vss-tracing/
https://msdn.microsoft.com/ja-jp/library/windows/desktop/dd765233(v=vs.85).aspx
以下に、VSS のトレースのデコード方法を紹介します。
1. Windows SDK のインストール
VSS のトレースの取得・デコードは、Windows SDK に含まれる、vsstrace.exe が必要です。
そのため、まずは、Windows SDK をインストールします。
Windows 10 SDK
https://developer.microsoft.com/ja-jp/windows/downloads/windows-10-sdk
※ISO をダウンロードします。
2. コンポーネントのインストール
赤枠のコンポーネントをインストールします。
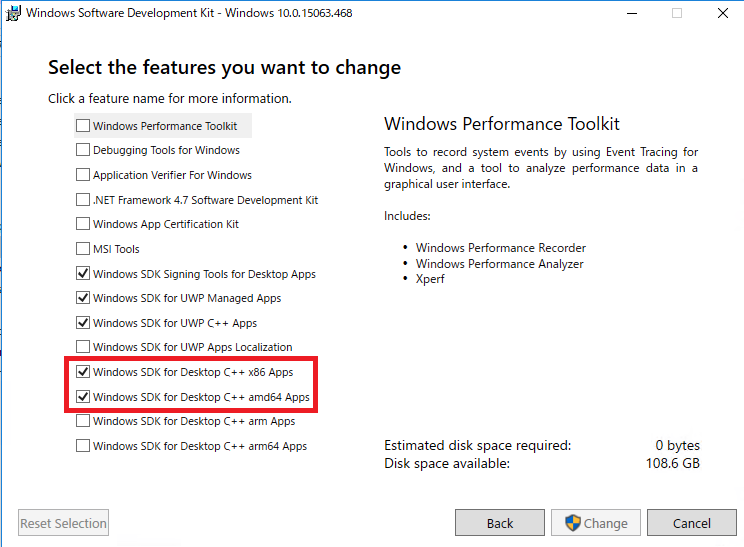
ツールは、以下のディレクトリにインストールされます。
C:\Program Files (x86)\Windows Kits\10\bin\10.0.15063.0\x64
3. デコード
デコードは、コマンドプロンプトから、以下の方法で行います。
※コマンドプロンプトは、必ず管理者権限で実行します
vsstrace.exe -etl <ETL ファイル> > output.txt

例)
vsstrace.exe -etl vsstrace.etl > output.txt
参考までに、vsstrace のヘルプです。
C:\Program Files (x86)\Windows Kits\10\bin\10.0.15063.0\x64>vsstrace.exe /?

Usage: vsstrace [-help <modules | levels | all>] [-l <level>] [-f <flags>]
                [-+<module>] [-+ident] [-+pid <process id>] [-+tid <thread id>]
                [-etl <input ETL file>] [-o <output TXT File>]

  -f and -+<module>: both effect which modules will be traced;
    the order in which they are specified will effect which modules are masked;
    you can mask all (-f 0) and then add specific modules by name (+coord +xml)

  -tid/-pid: by default all process IDs (pid) and thread IDs (tid) are enabled;
    asterisk (*) can be used as a wildcard for "any" process or thread;
    the order in which they are provided will effect which traces are included;
    you can mask all (-pid *) and then enable specific ones (+pid 0xe8c)

  -o: provides alternate output stream. If you want to exclude console
    output and just write to a file, redirect output to a file using > sign


    Examples:
        vsstrace -f 0 +coord +swprv
        vsstrace -f 0x6
        vsstrace -GEN
        vsstrace -etl vss.etl -o vss.log
        vsstrace -f 0xffff -pid * +pid 0xe8c -tid * +tid 0x31a
4. ログの解析
ログを取得するだけでは、トラブルシューティングはできません。
VSS の場合、以下のページで詳細なフローが書かれていますので、こちらを参考にします。
https://msdn.microsoft.com/en-us/library/aa384615(VS.85).aspx