概要
kibana 5.1.1ではYour profile never looked betterという項で紹介されているように、ProfilerのUIがつきました、と。
Now, for 5.1.1, the X-Pack basic (free) install includes a UI for the profiler. You can find it in the Dev Tools area of Kibana after installing X-Pack. The profiler UI gives you a tree structure of the query with timing associated with each branch, which allows you to dig into the most time consuming parts. It can also help you quickly iterate, easily enabling the viewing of new (and hopefully faster!) queries. It’s available in our Basic Edition, which is free for production or dev use with registration.
It’s available in our Basic Edition, which is free for production or dev use with registration.
BasicEditionで使えるよ、と。
新機能と聞くと試さずにはいられない性分、手元の環境で試してみた記録です。
手順
Dockerイメージの取得
ローカル環境が汚れるのがいやなので、この手の検証はDockerでやりたいのです。
elastic社の公式のDockerイメージを取得します。
docker pull docker.elastic.co/elasticsearch/elasticsearch:5.1.1

docker pull docker.elastic.co/kibana/kibana:5.1.1
Dockerのオフィシャルレポジトリはelasticの方がメンテされているものではないとのことなので、elasticさんの方を使いましょう。
docker search elasticsearch でOFFICIALが[OK]だからこれだーーーと
docker pull elasticsearch:latest などと飛びついてはいけません。大谷さんにつっこまれます・・・。
ぐっとこらえて、公式のマニュアルを確認すると良いですね。
再掲: elasticさんが配布しているイメージを使いましょう!
こちらのイメージではx-packが同梱されているところがポイントです。
起動直後に9200番にブラウザでアクセスすると認証を求められてびっくりすることになります。
コンテナの起動
こちらもマニュアルに従い起動します。
docker run -d --name es511 -p 9200:9200 -e "http.host=0.0.0.0" -e "transport.host=127.0.0.1" docker.elastic.co/elasticsearch/elasticsearch:5.1.1
docker run -d -p 5601:5601 --link es511:elasticsearch docker.elastic.co/kibana/kibana:5.1.1
kibanaでは、kibana.ymlを渡すことで設定情報を起動時に渡せるようです。
最低限、elasticsearchがどこに立っているか、デフォルトではhttp://elasticsearch:9200/になっているので、elasticsearchで先ほどたてたコンテナにアクセスできるよう --link で情報を渡しています。
なお、kibanaイメージで使われるデフォルト値はこちらになってます。
https://www.elastic.co/guide/en/kibana/current/_configuring_kibana_on_docker.html#_docker_defaults
| name | value |
|---|---|
| server.host | "0" |
| elasticsearch.url | http://elasticsearch:9200 |
| elasticsearch.username | elastic |
| elasticsearch.password | changeme |
ブラウザから確認
さて、ブラウザからkibanaにLet's ゲキガイン! まず、ログイン画面が表示されます。
http://xxxxxxxxx:5601/
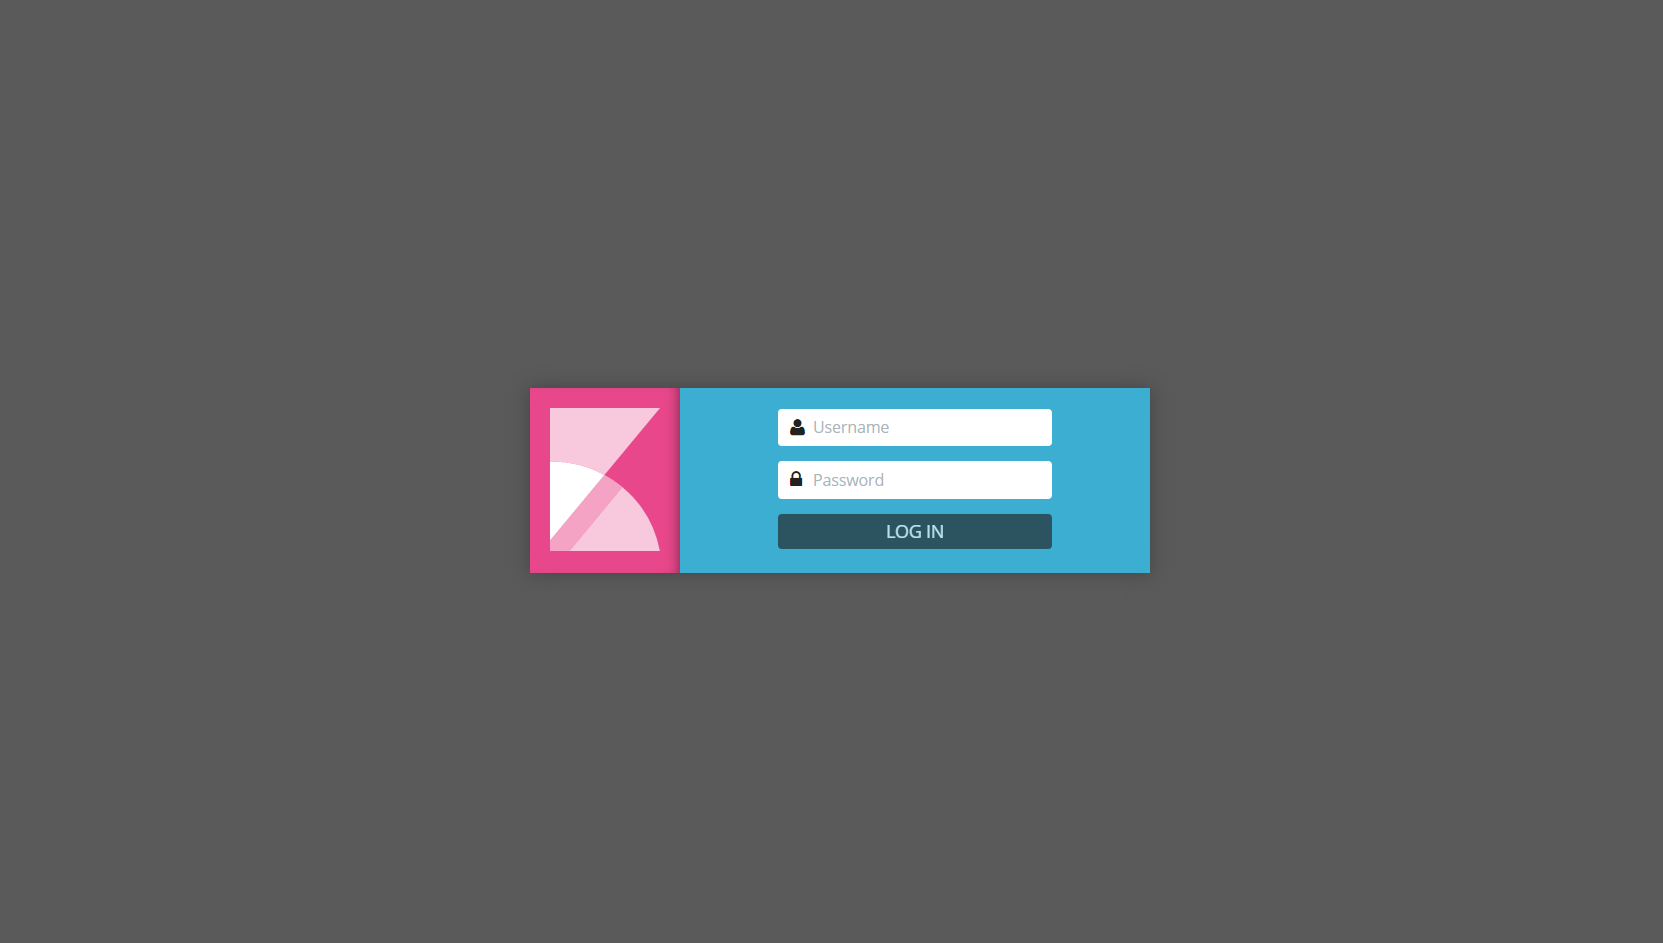
ユーザ名、パスワードはデフォルト値 elastic / changeme を入れます。
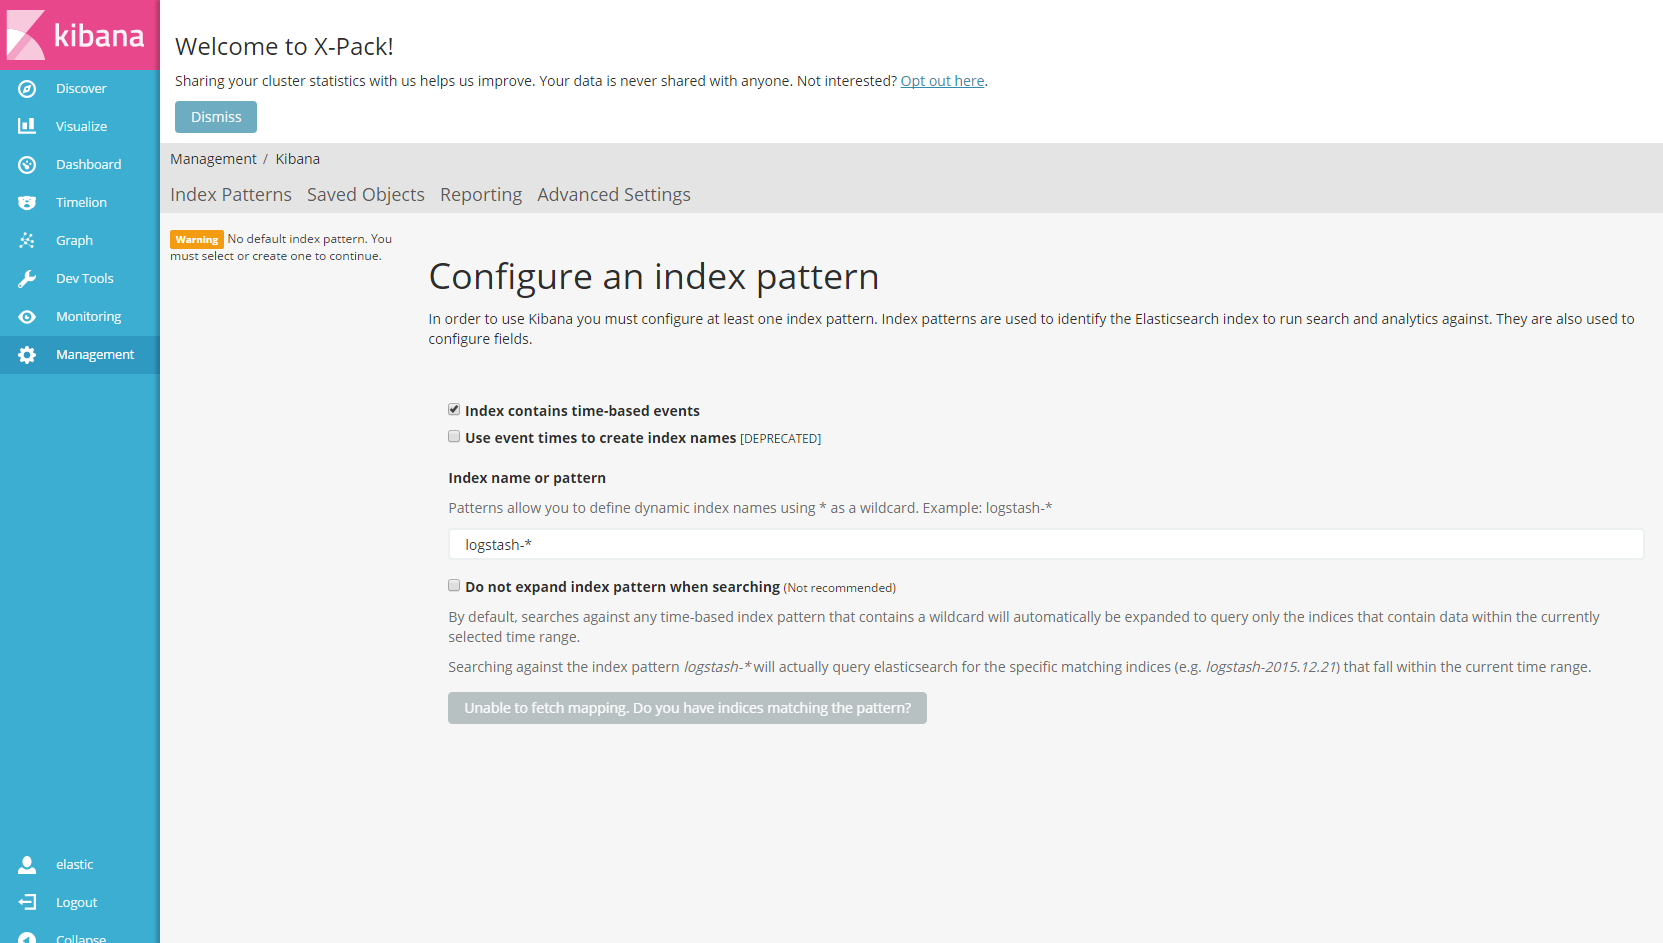
ログイン直後の画面はこちら
Profiler UI
適当にテストデータを1万件ぐらい入れて、kibanaの左の方のメニュー[Dev Tools」から昔で言うところのsense、今ならConsoleの画面を開くと、Consoleの横にProfilerが追加されていると思います。
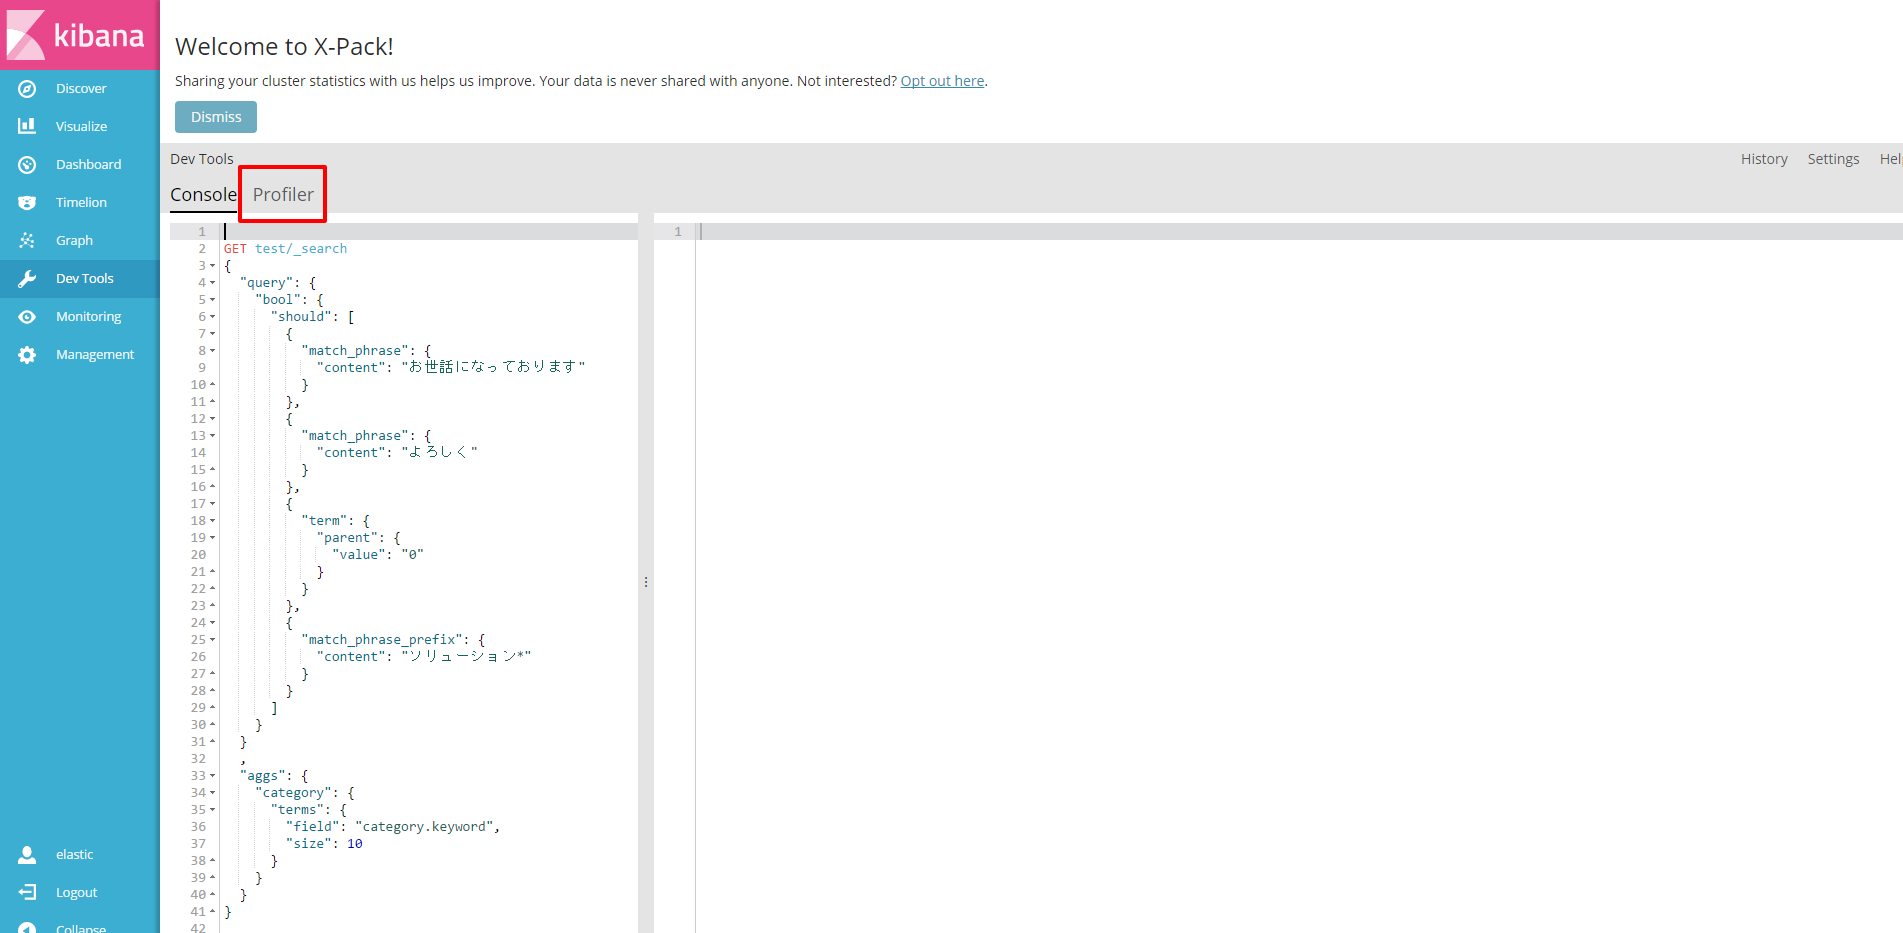
今回は、こんなクエリに検索結果が8000件ぐらい返る、とある掲示板の書き込みログを利用しました。
使用したクエリは検証用で、パフォーマンスが悪くなることを願って、意味もなく*を使ってみたりしています。
GET test/_search
{
  "query": {
    "bool": {
      "should": [
        {
          "match_phrase": {
            "content": "お世話になっております"
          }
        },
        {
          "match_phrase": {
            "content": "よろしく"
          }
        },
        {
          "term": {
            "parent": {
              "value": "0"
            }
          }
        },
        {
          "match_phrase_prefix": {
            "content": "ソリューション*"
          }
        }
      ]
    }
  }
  ,
  "aggs": {
    "category": {
      "terms": {
        "field": "category.keyword",
        "size": 10
      }
    }
  }
}
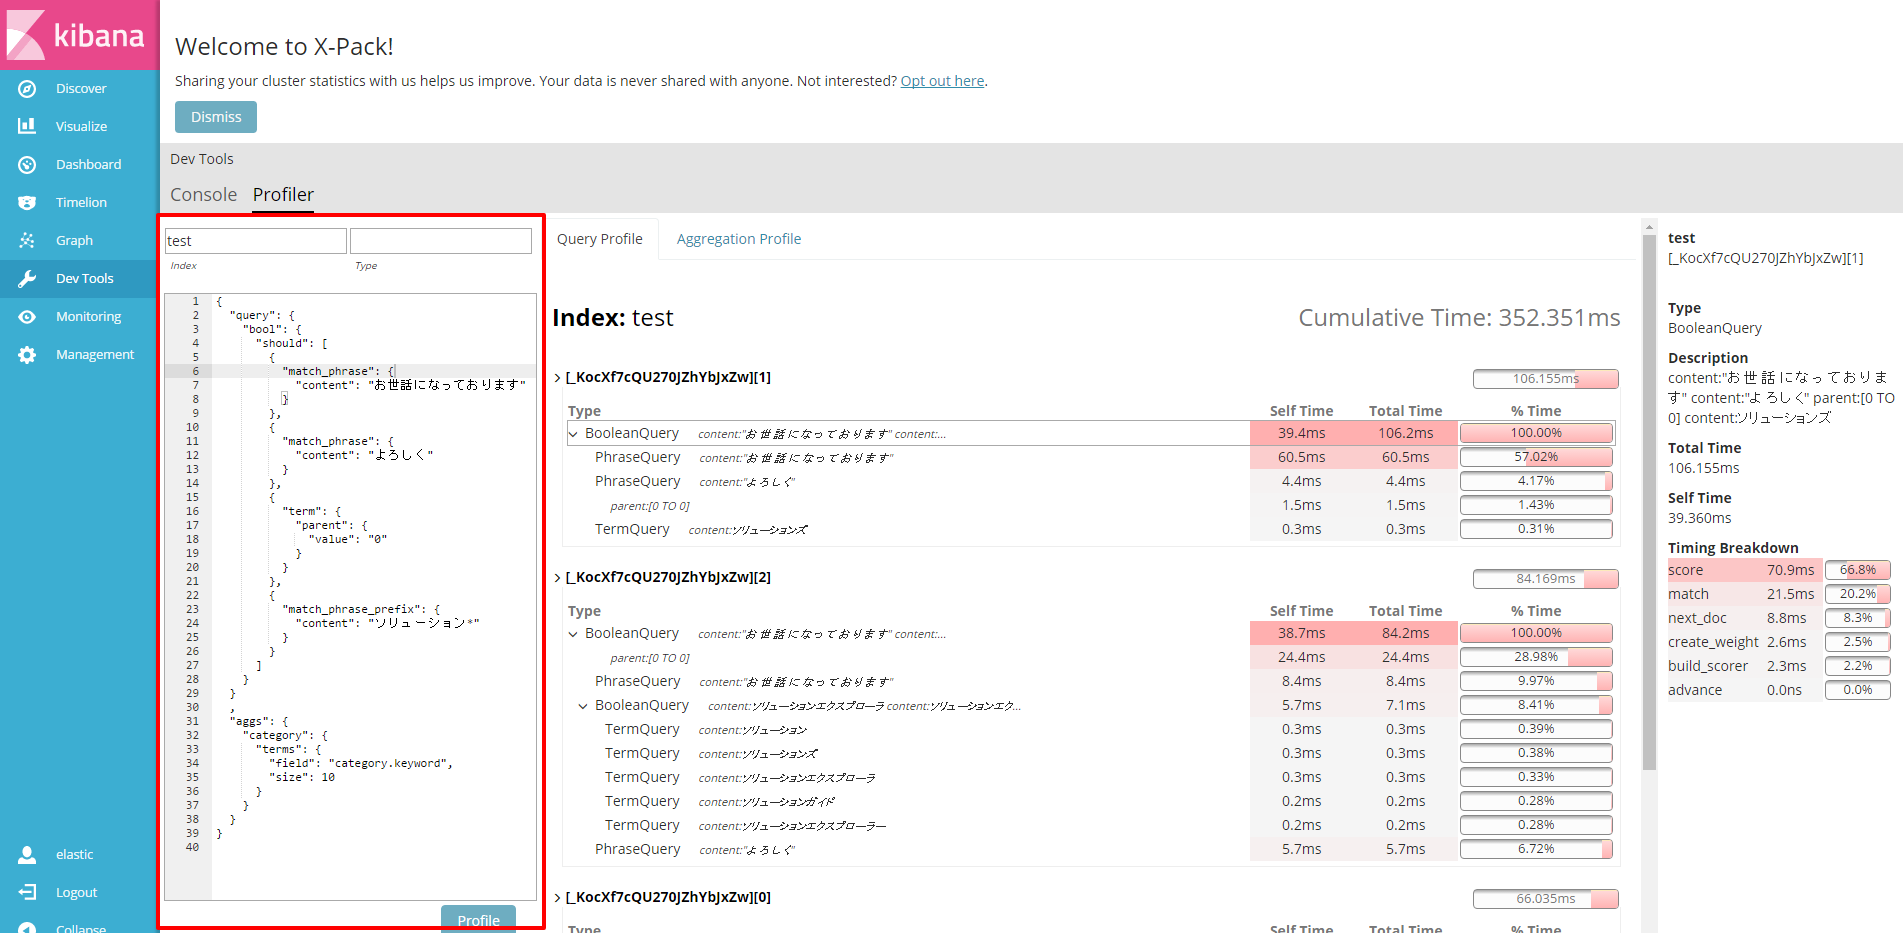
ProfilerのUIで、左の方にあるIndex, Type, Consoleみたいなところに条件を入れて「Profile」ボタンを押すと、右側にどんなクエリが発行されて、どこでどれだけ時間がかかっているかが表示されます。
IndexやTypeは任意項目で、入れてなければモニタリングやkibanaのインデックスも対象に含まれるようです。
画面はこんな感じです。
雑感
何か遅いぞ!と感じたときに、Analyzerの見直しや、クエリの投げ方の見直しの助けになりそう。
あと、Dockerの公式とelasticの公式は違うぞ、というところ。勉強になりました。