概要
Filebeatでは、setupコマンドを使うことで、kibanaのインデックスを作成することができます。
ここで、Kibanaのインデックスを作成しておけば、データを投入すればすぐに用意されたダッシュボードで見られます。
作成されるデータは、Kibanaで作成されるIndex Patternsの他、Visualization、Dashboard、Searchersなどで、
デフォルトでは、ApacheやMySQL、RedisといったDashboardや関連データが作成されます。
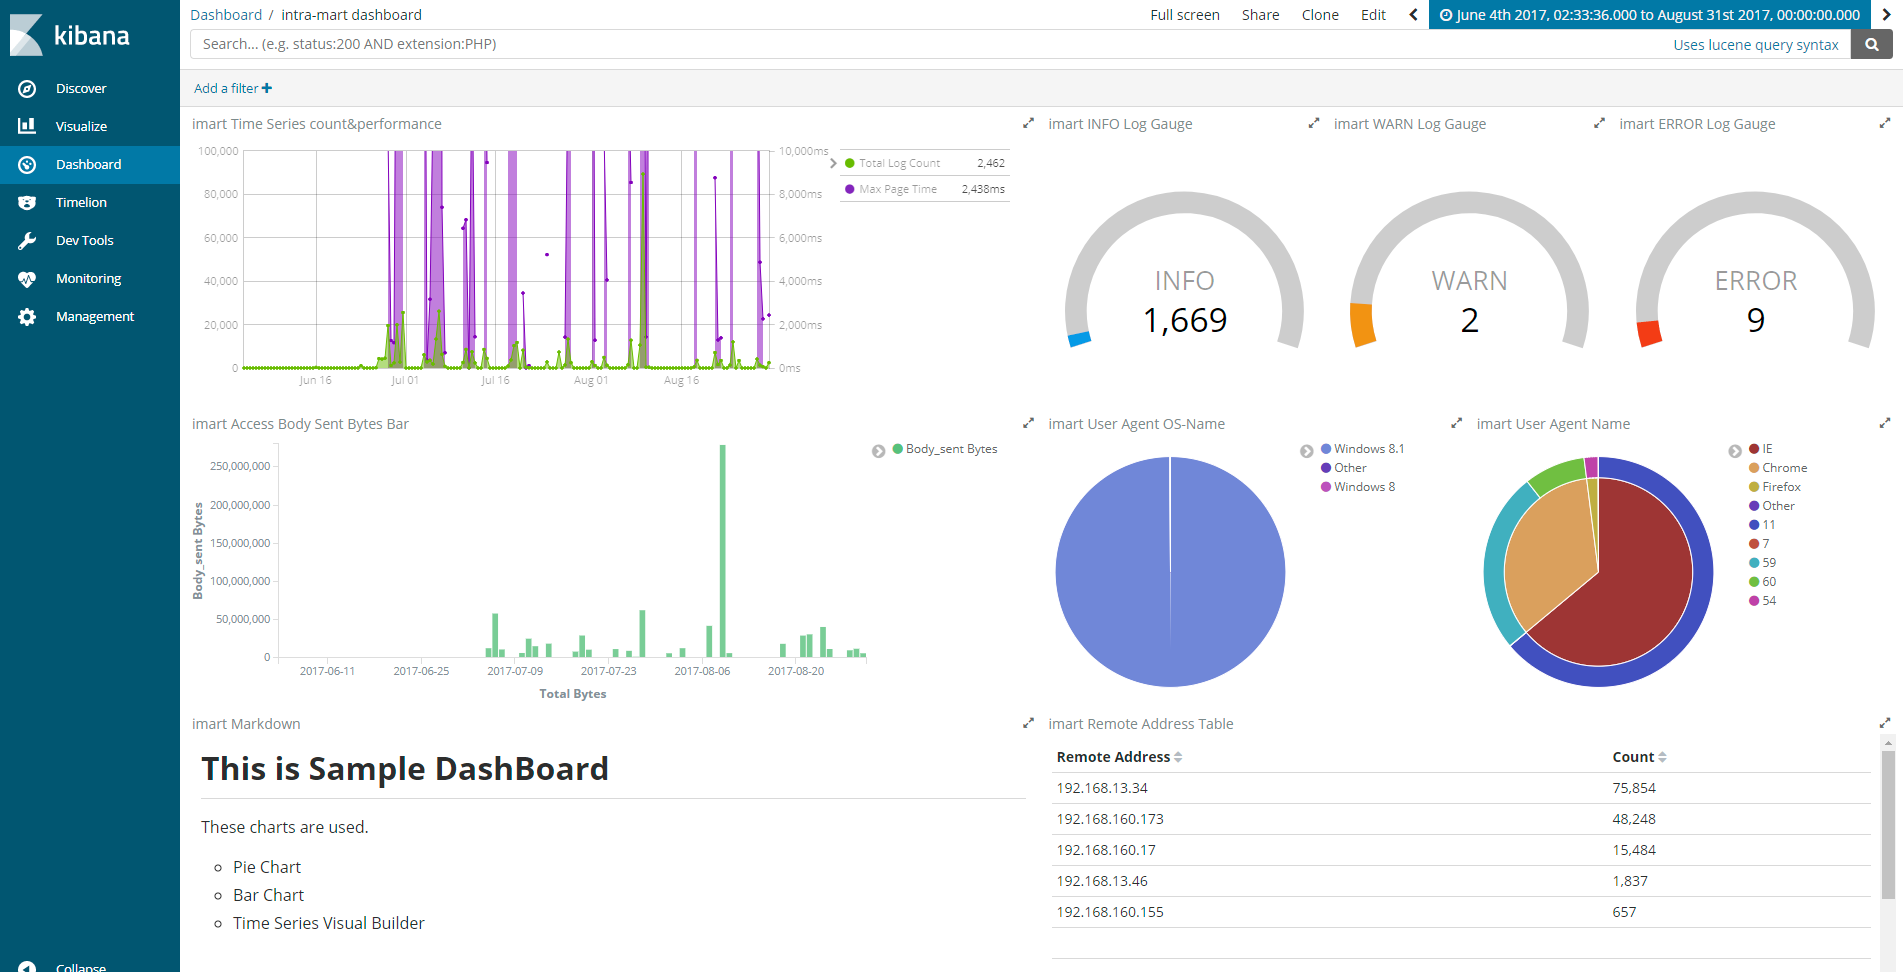
今回は、intra-martとかいう製品のログをFilebeatのModuleで処理してElasticsearchに送り、
ログに対応するDashboardもFilebeatでセットアップできるようにする場合に何をやったか、という話です。
確認環境
| products | version |
|---|---|
| Elasticsearch | 6.0.0-beta2 |
| Kibana | 6.0.0-beta2 |
| Filebeat | 6.0.0-beta2 |
5.x(今日、5.6が出ましたけども)でやるのが良いのでしょうけども、常に最新を使いたいというのが人情というものです。
作成するもの
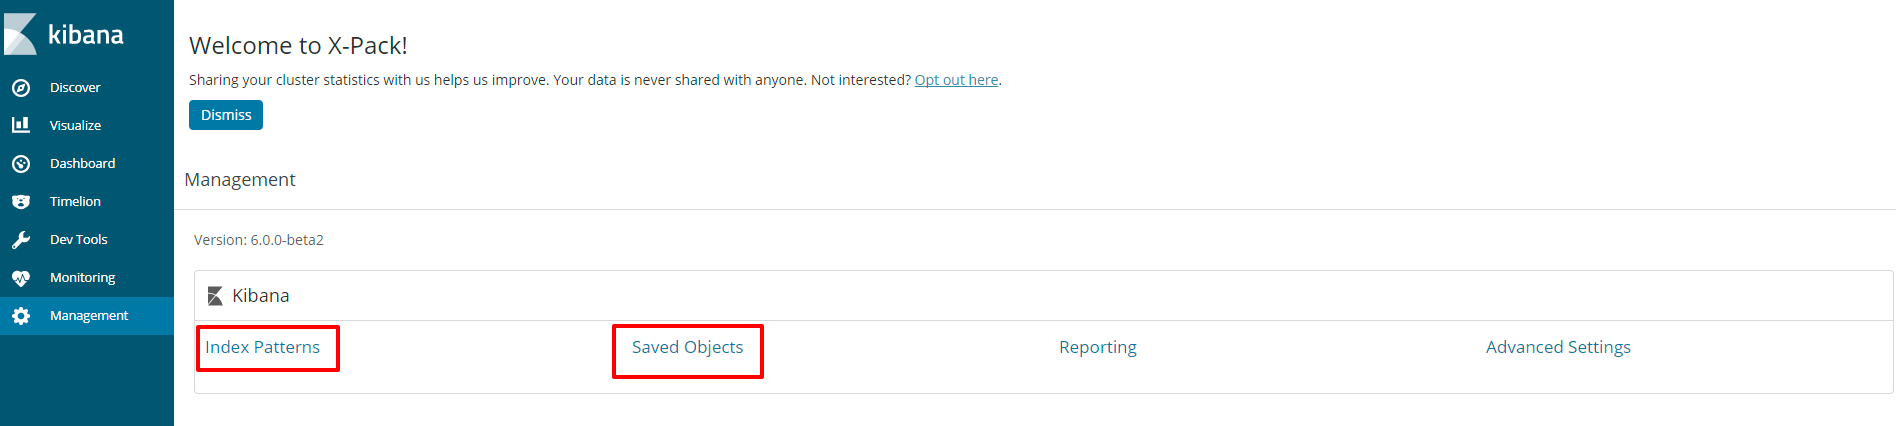
下記の「Index Patterns」と「Saved Objects」にデータを登録するインポート用のファイルを作成します。
Filebeatをダウンロードして解凍すると、カレントにkibanaというフォルダがあります。
{$Filebeat}/kibana/defaultの下を見てください。
dashboardフォルダ以下にあるjsonで、Dashboardやそこに必要なVisualizationなどが定義されています。
index-patternフォルダ以下にあるfilebeat.jsonで、Index Patternsに登録する内容が定義されています。
├─dashboard
│      Filebeat-apache2.json
│      Filebeat-auditd.json
│      Filebeat-auth-sudo-commands.json
│      Filebeat-icinga-debug-log.json
│      Filebeat-icinga-main-log.json
│      Filebeat-icinga-startup-errors.json
│      Filebeat-mysql.json
│      Filebeat-new-users-and-groups.json
│      Filebeat-nginx-overview.json
│      Filebeat-redis.json
│      Filebeat-ssh-login-attempts.json
│      Filebeat-syslog.json
│      ml-nginx-access-remote-ip-count-explorer.json
│      ml-nginx-remote-ip-url-explorer.json
│
└─index-pattern
       filebeat.json
自分で書いたモジュールの内容を追加したい場合は、大きく2つやることがありそうです。
- Dashboard以下に、Dashboard定義を書いたjsonファイルを追加する
- index-pattern/filebeat.jsonに自分が書いたモジュールのfields内容を追加する
作業の流れ
作業の大まかな流れは、以下の通りです。
一度、画面操作でデータをきれいに作成しておいて、Exportします。
- Kibanaの画面で、Index定義を完成させる
- Kibanaの画面で、Dashboardを完成させる
- Kibanaのデータを抽出してjsonファイルに反映させる
export用のスクリプトも公式に用意されていますが、pythonだったりGoだったり、6.0はまだ正式に出てないのでドキュメントもあまり無いようで、うまくできませんでした。
https://github.com/elastic/beats/tree/6.0/dev-tools
しかし、jsonファイルを手打ちするのは難しいです。
なので、KibanaのDevToolsのConsoleを中心に頑張りました。
Index定義
Index定義のfilebeat.jsonの確認
filebeat.jsonは、このような内容になっています。
{
  "version": "6.0.0-beta1",
  "objects": [
    {
      "attributes": {
        "fields": "[{\"count\": 0, すごく長いので割愛}]",
        "fieldFormatMap": "{\"@timestamp\": {\"id\": \"date\"}, \"nginx.access.body_sent.bytes\": {\"id\": \"bytes\"}, \"apache2.access.body_sent.bytes\": {\"id\": \"bytes\"}}",
        "timeFieldName": "@timestamp",
        "title": "filebeat-*"
      },
      "version": 1,
      "type": "index-pattern",
      "id": "filebeat-*"
    }
  ]
}
このファイルで変更されるべき箇所は、主にattribute要素以下です。
fieldsに、実際のフィールド定義が格納されており、メインの設定項目です。
モジュールによる単純な項目追加だけであれば、fieldsだけを変更すれば済むでしょう。
6.0.0-beta2のFilebeatのはずですが、versionは6.0.0-beta1です。気にせず進みます。
index-patternの取得と反映
KibanaのConsoleで、以下のように実行します。
GET .kibana/doc/index-pattern:filebeat-*
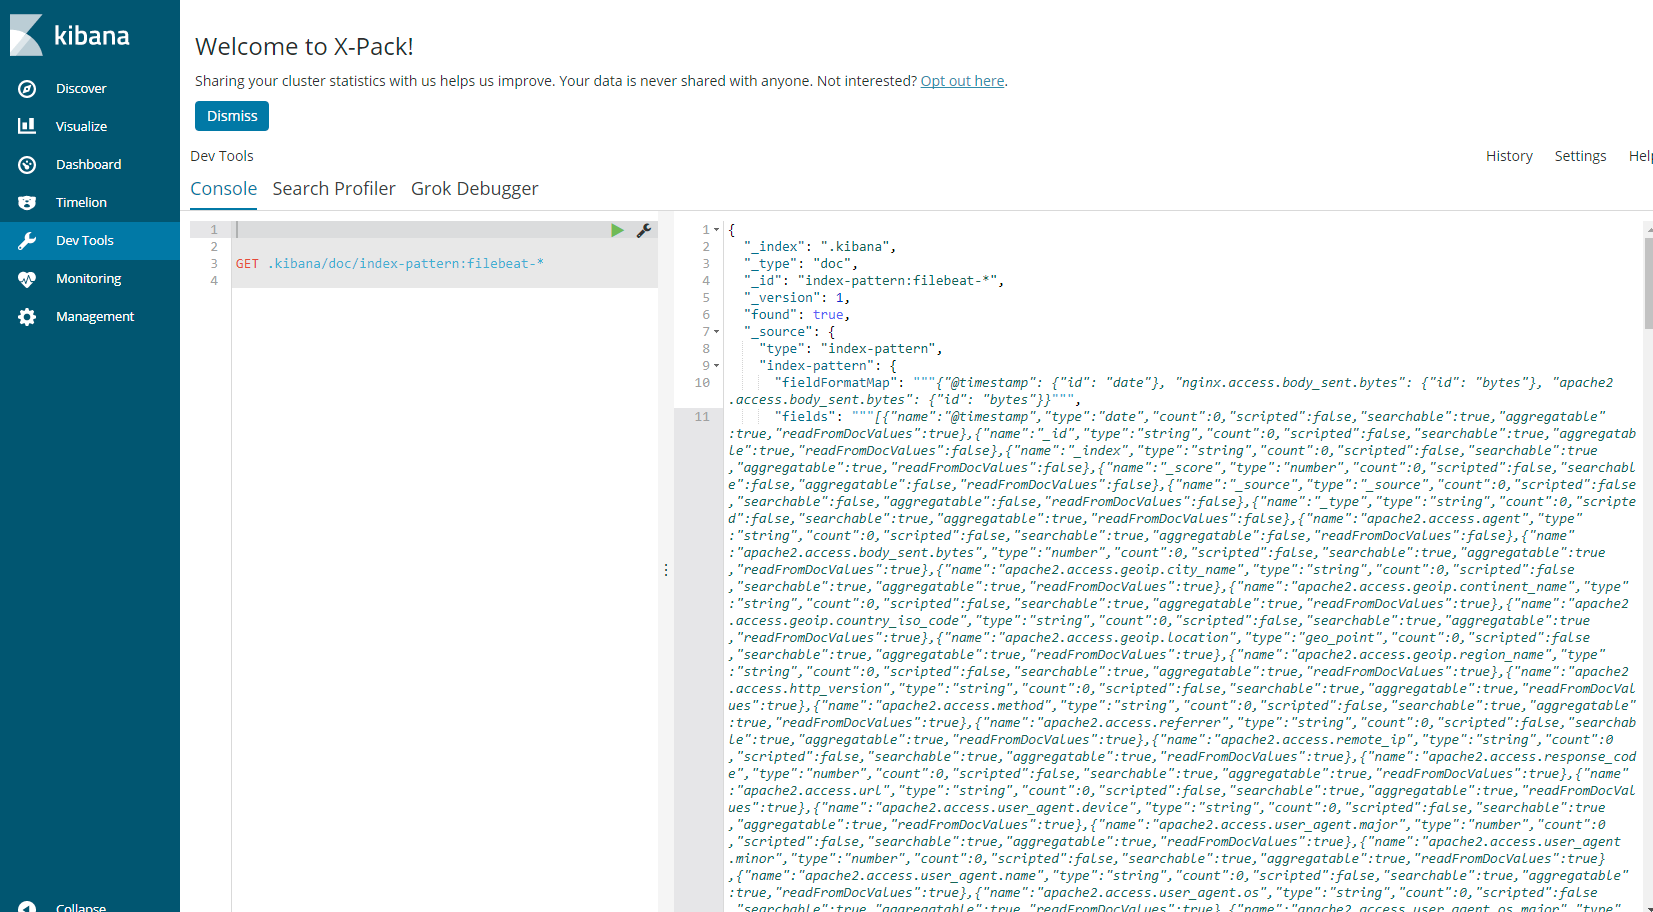
_source以下のfields, fieldFormatMapなどをfilebeat.jsonに反映させます。( " のエスケープが必要なことに注意)
Dashboard
Dashboardのjsonの確認
例えば、Filebeat-apache2.jsonだと、このような内容です
{
  "objects": [
    {
      "attributes": {
        "description": "",
        "kibanaSavedObjectMeta": {
          "searchSourceJSON": "{\n  \"filter\": []\n}"
        },
        "savedSearchId": "Apache2-access-logs",
        "title": "Unique IPs map [Filebeat Apache2]",
        "uiStateJSON": "{\n  \"mapCenter\": [\n    14.944784875088372,\n    5.09765625\n  ]\n}",
        "version": 1,
        "visState": "{\n  \"title\": \"Apache2 access unique IPs map\",\n  \"type\": \"tile_map\",\n  \"params\": {\n    \"mapType\": \"Scaled Circle Markers\",\n    \"isDesaturated\": true,\n    \"addTooltip\": true,\n    \"heatMaxZoom\": 16,\n    \"heatMinOpacity\": 0.1,\n    \"heatRadius\": 25,\n    \"heatBlur\": 15,\n    \"heatNormalizeData\": true,\n    \"legendPosition\": \"bottomright\",\n    \"mapZoom\": 2,\n    \"mapCenter\": [\n      15,\n      5\n    ],\n    \"wms\": {\n      \"enabled\": false,\n      \"url\": \"https://basemap.nationalmap.gov/arcgis/services/USGSTopo/MapServer/WMSServer\",\n      \"options\": {\n        \"version\": \"1.3.0\",\n        \"layers\": \"0\",\n        \"format\": \"image/png\",\n        \"transparent\": true,\n        \"attribution\": \"Maps provided by USGS\",\n        \"styles\": \"\"\n      }\n    }\n  },\n  \"aggs\": [\n    {\n      \"id\": \"1\",\n      \"enabled\": true,\n      \"type\": \"cardinality\",\n      \"schema\": \"metric\",\n      \"params\": {\n        \"field\": \"apache2.access.remote_ip\"\n      }\n    },\n    {\n      \"id\": \"2\",\n      \"enabled\": true,\n      \"type\": \"geohash_grid\",\n      \"schema\": \"segment\",\n      \"params\": {\n        \"field\": \"apache2.access.geoip.location\",\n        \"autoPrecision\": true\n      }\n    }\n  ],\n  \"listeners\": {}\n}"
      },
      "id": "Apache2-access-unique-IPs-map",
      "type": "visualization",
      "version": 1
    },
KibanaからVisualization、DashboardのExport
追加したいDashboardやVisializationを指定してKibanaの管理画面よりExportします。
export.jsonはこのような内容になっています。
[
  {
    "_id": "Filebeat-Apache2-Dashboard",
    "_type": "dashboard",
    "_source": {
      "description": "Filebeat Apache2 module dashboard",
      "hits": 0,
      "kibanaSavedObjectMeta": {
        "searchSourceJSON": "{\"filter\":[],\"query\":{\"language\":\"lucene\",\"query\":{\"query_string\":{\"analyze_wildcard\":true,\"default_field\":\"*\",\"query\":\"*\"}}},\"highlightAll\":true,\"version\":true}"
      },
      "optionsJSON": "{\"darkTheme\":false}",
      "panelsJSON": "[{\"col\":1,\"id\":\"Apache2-access-unique-IPs-map\",\"panelIndex\":1,\"row\":1,\"size_x\":12,\"size_y\":3,\"type\":\"visualization\"},{\"col\":1,\"id\":\"Apache2-response-codes-of-top-URLs\",\"panelIndex\":2,\"row\":6,\"size_x\":8,\"size_y\":3,\"type\":\"visualization\"},{\"col\":9,\"id\":\"Apache2-browsers\",\"panelIndex\":3,\"row\":6,\"size_x\":4,\"size_y\":3,\"type\":\"visualization\"},{\"col\":11,\"id\":\"Apache2-operating-systems\",\"panelIndex\":4,\"row\":4,\"size_x\":2,\"size_y\":2,\"type\":\"visualization\"},{\"col\":1,\"id\":\"Apache2-error-logs-over-time\",\"panelIndex\":5,\"row\":9,\"size_x\":12,\"size_y\":2,\"type\":\"visualization\"},{\"col\":1,\"id\":\"Apache2-response-codes-over-time\",\"panelIndex\":6,\"row\":4,\"size_x\":10,\"size_y\":2,\"type\":\"visualization\"},{\"col\":1,\"columns\":[\"apache2.error.client\",\"apache2.error.level\",\"apache2.error.module\",\"apache2.error.message\"],\"id\":\"Apache2-errors-log\",\"panelIndex\":7,\"row\":11,\"size_x\":12,\"size_y\":3,\"sort\":[\"@timestamp\",\"desc\"],\"type\":\"search\"}]",
      "timeRestore": false,
      "title": "[Filebeat Apache2] Access and error logs",
      "uiStateJSON": "{\"P-1\":{\"mapBounds\":{\"bottom_right\":{\"lat\":-3.864254615721396,\"lon\":205.3125},\"top_left\":{\"lat\":67.7427590666639,\"lon\":-205.6640625}},\"mapCenter\":[40.713955826286046,-0.17578125],\"mapCollar\":{\"top_left\":{\"lat\":90,\"lon\":-180},\"bottom_right\":{\"lat\":-39.667755,\"lon\":180},\"zoom\":2},\"mapZoom\":2}}",
      "version": 1
    },
    "_meta": {
      "savedObjectVersion": 2
    }
  },
Dashboardのjsonとスキーマが違いますね。
ExportされたjsonからDashboard用のjsonを求める
export.jsonの内容を以下のように読み替えてしまいます。
| export.jsonの要素 | Dashboardのjsonの要素 |
|---|---|
| _id | id |
| _type | type |
| _source | attributes |
[注意事項]
attributes -> kibanaSavedObjectMeta -> searchSourceJSON に検索対象となるindexが含まれている場合があります。
今回は、filebeat.jsonでindexを「filebeat-*」としているので、ある場合は置換しておきます。
例えばの例を以下においておきます。
import json

result = {}

with open("export.json") as f:
    data = json.load(f)

    obj = []
    for d in data:
        data = {}
        data['id'] = d['_id']
        data['type'] = d['_type']
        data['attributes'] = d['_source']

        if 'index' in data['attributes']['kibanaSavedObjectMeta']['searchSourceJSON']:
            data['attributes']['kibanaSavedObjectMeta']['searchSourceJSON'] = \
            data['attributes']['kibanaSavedObjectMeta']['searchSourceJSON'].replace('"index":"d65283d0-96ad-11e7-b90f-f76830956183",', '"index":"filebeat-*",')

        obj.append(data)

    result['objects'] = obj

with open('Filebeat-hogehoge.json', 'w') as fw:
    json.dump(result, fw)
できたjsonを kibana/default/dashboardの下に Filebeat-*****.jsonとしておいておきましょう。
いざ取込
filebeat.exe setup -c filebeat.yml

すぐにKibanaの画面で確認してみます。
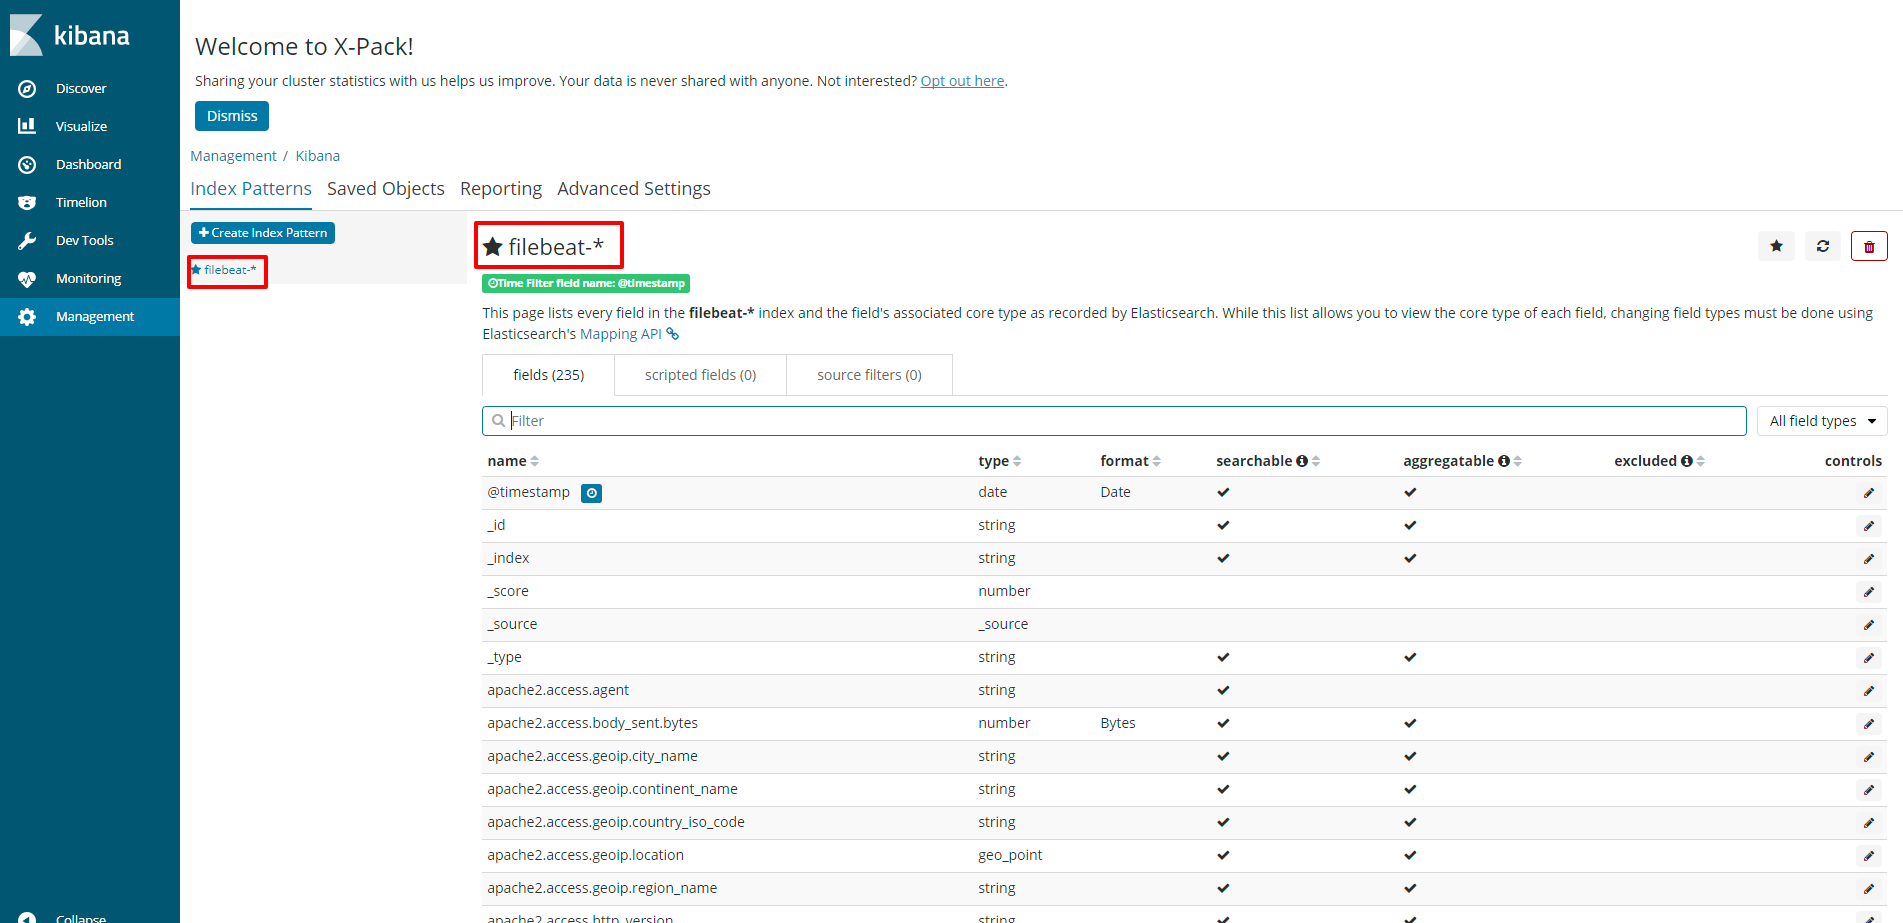
filebeat-*のIndex定義が作成されていることが確認できます。
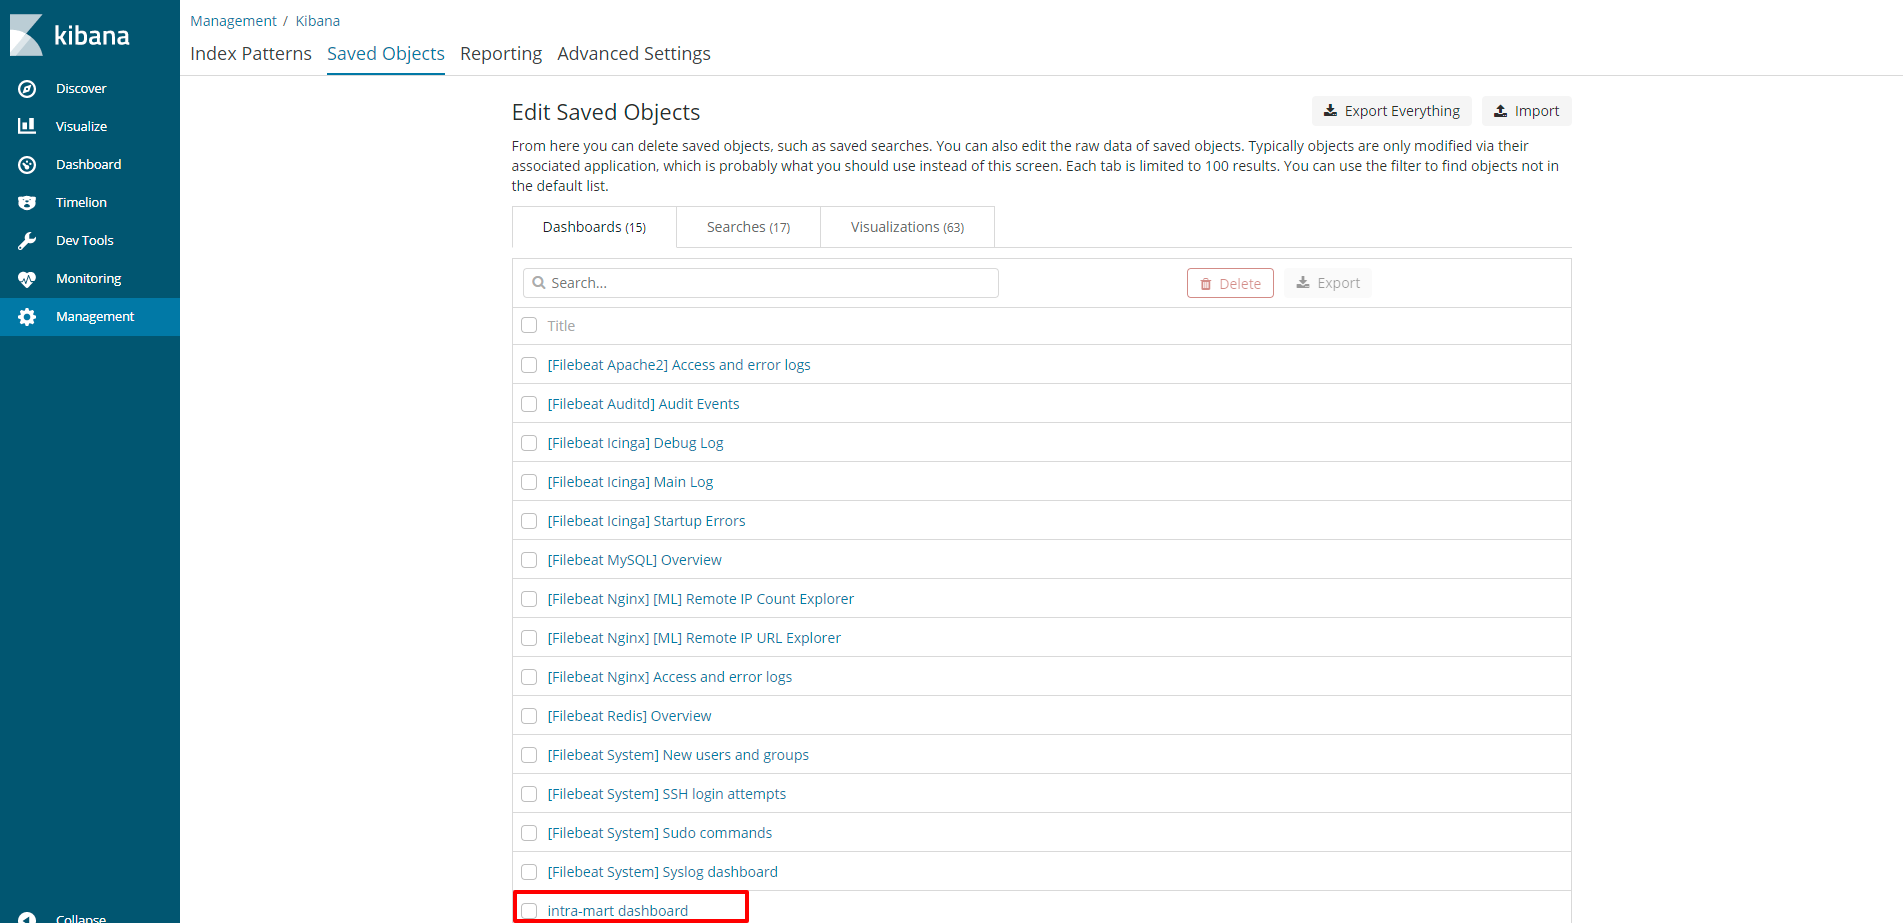
自分で追加したDashboardのデータも作成されていることが確認できました。
あとはデータ投入だけ
kibanaのデータを事前に作成できているので、あとはデータを投げ入れるだけダッシュボードが完成です。
まとめ
Filebeatで独自のモジュールを書いたときに、対応するDashboardなども配布できるというのは、
データを入れて、すぐに見たいという用途には適していると思います。
実際の運用では、FilebeatからKafkaに送ったりlogstashに送るのが多いのかもしれませんが、
Filebeatだけでやる場合にしても、これだけで実現できる、というのはとてもお手軽です。
上記のダッシュボードを作成するのに使用した資材は、以下にあります。
https://github.com/tsgkdt/filebeat-imart-module/tree/master/module/imart/_meta/kibana/default
モジュールの使用方法はこちら。
#=========================== Filebeat prospectors =============================
filebeat.modules:

- module: imart

  access:
    enabled: true
    var.pipeline: with_plugins

  master:
    enabled: true
    var.pipeline: with_plugins

  request:
    enabled: true
    var.pipeline: with_plugins

  transition:
    enabled: true
    var.pipeline: with_plugins

  system:
    enabled: true
    var.pipeline: with_plugins

  security:
    enabled: true
    var.pipeline: with_plugins

  exception:
    enabled: true
    var.pipeline: with_plugins
位置づけ的には、filebeatでmoduleを書いてみた話。intra-martのログをElasticsearchに入れるの続編です。