この動くグラフが面白かったので、JSで描画できるようにしてみた。
上記画像はRedditから引用(本物はgifアニメです)
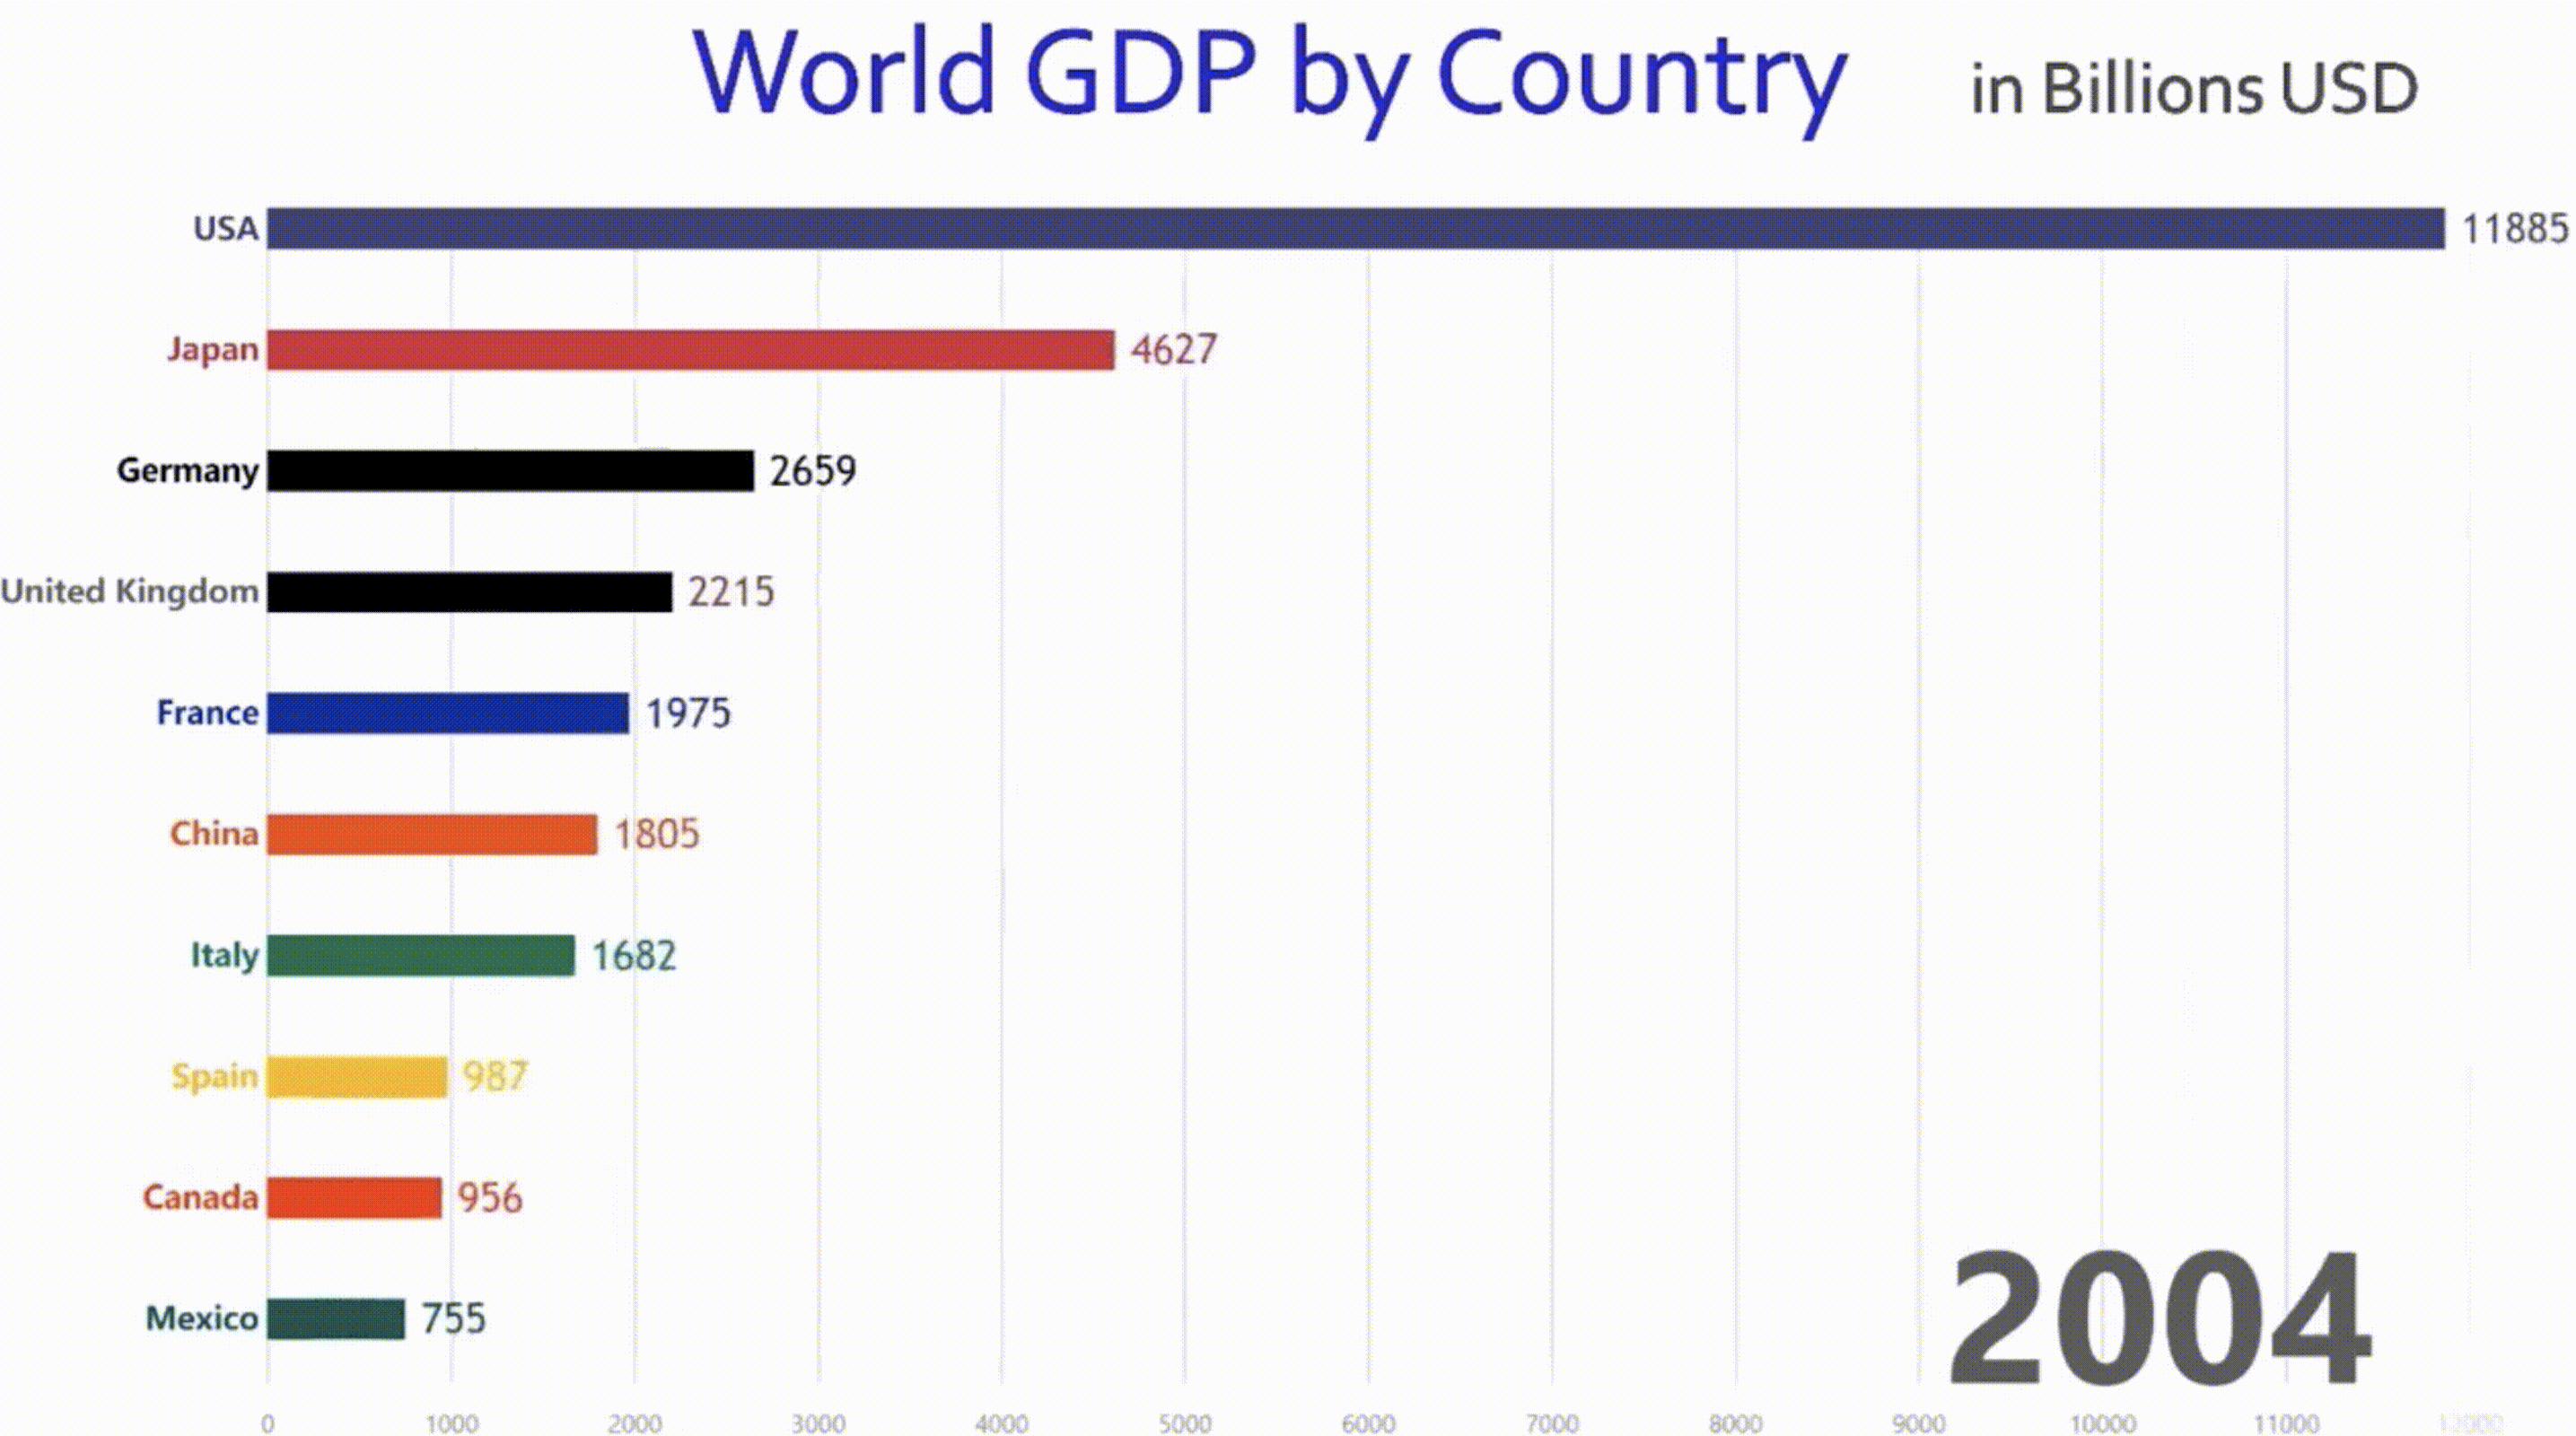
作ったデモ画像
Gross Domestic Product (GDP)
まずは元の画像と同じ内容を再現してみた。GDPの経年推移を描画している。

The number of tourists to Japan
こちらは、日本に来る観光客数の経年推移。

ruby-core
ruby-coreメーリングリストに投稿されるメール数の経年推移。

自分で動かす方法
ソースはすべてGithubで公開されており、ライブラリの簡単な使い方はREADMEに書いてある。
ざっくり下記のようなJSを書くと、これまでに見たグラフを描画できる。内部的にはHighchartsを利用している。
<script src="https://code.highcharts.com/highcharts.js"></script>
<script src="https://cdn.jsdelivr.net/npm/lodash@4.17.11/lodash.min.js"></script>
<script src="https://ts-3156.github.io/chasingchart/chasingchart-latest.js"></script>

<div id="container" style="min-width: 310px; max-width: 800px; height: 400px; margin: 0 auto"></div>
<button id="button">Start</button>

<script>
    var input = [...];

    var chart = Chasingchart.chart('container');
    chart.setData(input);

    document.getElementById('button').addEventListener("click", function (event) {
        chart.start();
    }, false);
</script>
入力データは一例として下記の形式であればOK。こちらも、JSFiddleで試せるようにしてある。
[{
    "data": {"cat1":  500, "cat2":  400, "cat3":  300, "cat4":  200, "cat5":  100},
    "options": {"title": {"text": "Something statistics"}, "subtitle": {"text": "1900"}}
}, {
    "data": {"cat1":  500, "cat2":  550, "cat3":  300, "cat4":  200, "cat5":  100},
    "options": {"title": {"text": "Something statistics"}, "subtitle": {"text": "2000"}}
}]
その他
描画してみたいデータがもしあれば、コメント欄でご連絡いただけるとありがたいです。時間があれば動くグラフを作ってみます。
参考リンク
- Chasingchart 今回作成したJSライブラリ
- The Major World Economies Over Time
- Highcharts