plotly のつかいかた
前回からつかってみてだいぶ慣れたのでつづき
trace にデータセットして Data でまとめるという感じ
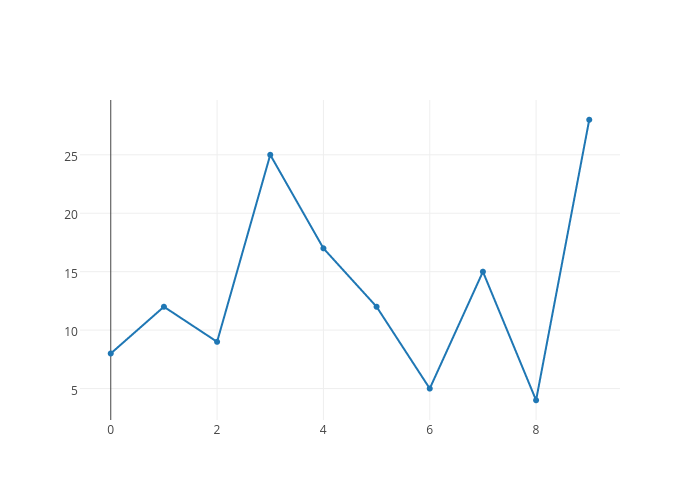
scatter
import plotly.plotly as py
from plotly.graph_objs import *

trace = Scatter(x=list(range(10)), y=list(np.random.randint(0,30,10)))
data = Data([trace])
py.image.save_as(data, filename='scatter.png')
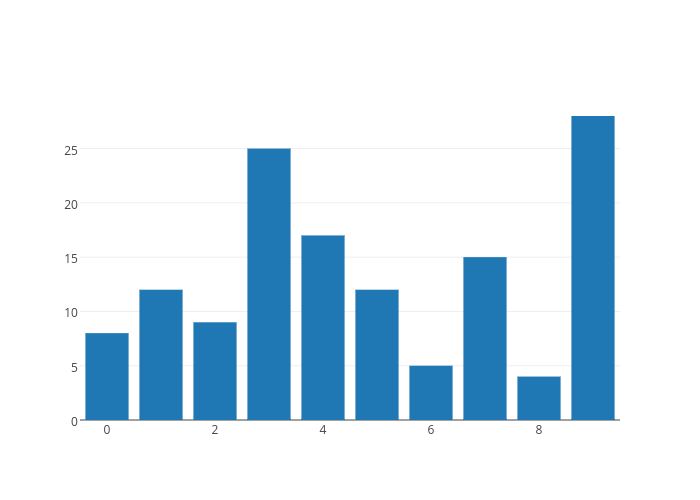
bar
trace = Bar(x=list(range(10)), y=list(np.random.randint(0,30,10)))
data = Data([trace])
py.image.save_as(data, filename='bar.png')
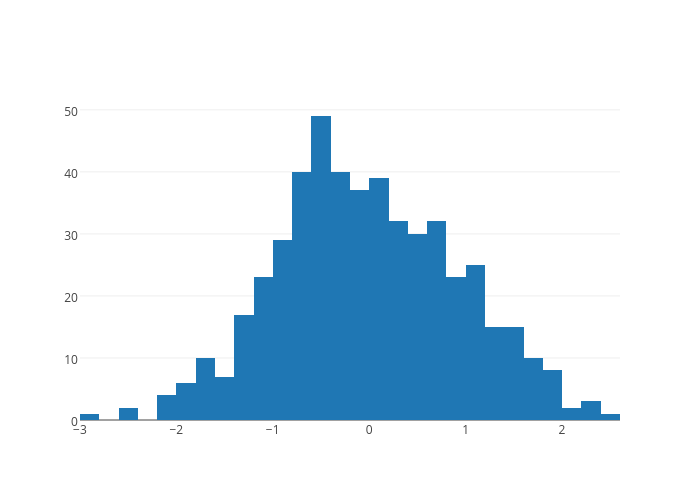
histogram
trace = Histgram(x=np.random.randn(500))
data = Data([trace])
py.image.save_as(data, filename='histogram.png')
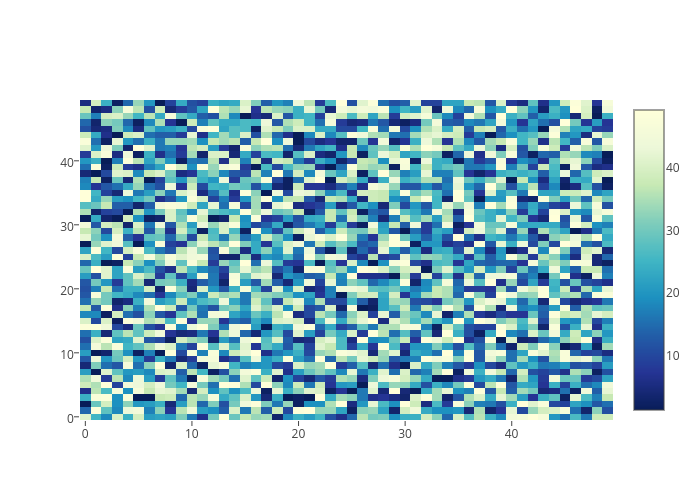
heatmap
trace = Heatmap(
    z=[np.random.randint(1,50,50) for _ in range(50)],
    colorscale='YIGnBu',
)
data = Data([trace])
py.image.save_as(data, filename='heatmap.png')
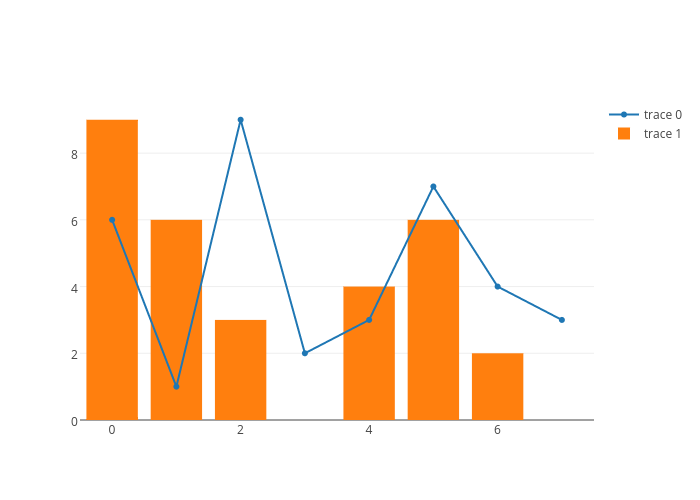
multiple_chart
trace = Bar(x=list(range(8)), y=list(np.random.randint(0,10,8)))
trace2 = Scatter(x=list(range(8)), y=list(np.random.randint(0,10,8)))
data = Data([trace, trace2])
py.image.save_as(data, filename='multiple.png')
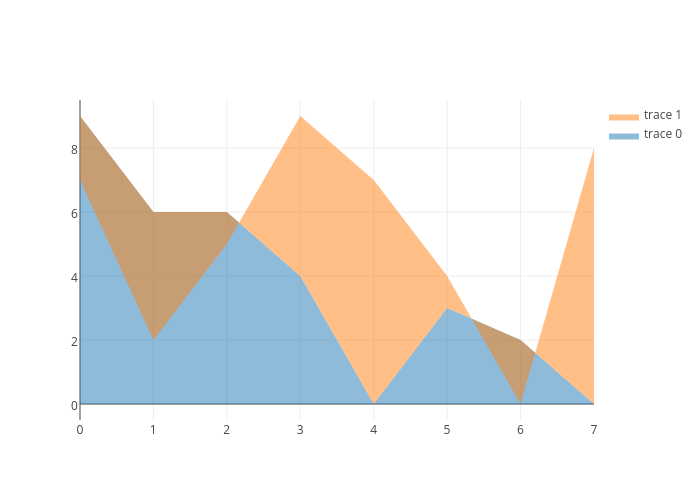
field_area_plots
trace = Scatter(
    x=list(range(8)),
    y=list(np.random.randint(0,10,8)),
    fill='tonexty',
    mode='none'
)
trace2 = Scatter(
    x=list(range(8)),
    y=list(np.random.randint(0,10,8)),
    fill='tonexty',
    mode='none'
)
data = Data([trace, trace2])
py.image.save_as(data, 'field_area_plots.png')