はじめに
この記事は前回の続きです。まだご覧になってない方はぜひ一読ください
Pythonで文字認識ニューラルネットワーク構築【Coursera Machine Learning】(1.概要)
ちょっと前に出た機械学習のゼミでCourseraの教材を扱っていたので復習がてらアウトプットしていこうと思います。Week5の課題であるex4は、もともとはOctaveで書かれているので自己流Pythonで記述します。当然処理にかかる時間は長〜くなるので実用目的ではなく勉強目的の人に向けて書いてますのであしからず。PyTorchやTensorFlowなどの機械学習ライブラリは使いません。
ということで今回は実際にPythonでのコーディングをしていきます。がんばりましょう。
ソースコードを見たい方はこちら
Mkamono/Letter_identify/letter_identify.py
とりあえず動かしたい方はこちら
Mkamono/Letter_identify
(よくわかんない方は「code」→「Download zip」でファイルごとダウンロードしてください)
世界一わかりやすいCourseraのスライドはこちら
Coursera-Machine-Learning-Stanford/ex4.pdf
環境
- windows 10 home
- VScode 1.6.0
- Python 3.8.11
概要
- データの前処理
- 関数解説
- 全体の流れの確認
の順番でやっていきます。関数は部分から全体へと進んでいきます。
データの前処理
準備
.
├── ex4data1.mat
└── letter_identify.py  #今回のコード
こうなってれば大丈夫です。ex4data1.matはcourseraから持ってきてもいいですし、上記のgithubからでもいいです。
処理
(outputs, lam, training_set_number) = (10, 0.1, 3000)
まずはパラメータの設定です。outputsは出力ノードの個数です。lamは正則化の影響の大きさ、training_set_numberはトレーニングに使うデータの個数です。
ex4data1.matにあるデータの総数は5000ですが、トレーニング用とテスト用で分けます。記述のとおりだと、トレーニング用が3000、テスト用が2000となります。
dir_path = os.path.dirname(__file__)
mat_path = os.path.join(dir_path, "ex4data1.mat")
os.path.dirname(__file__)で現在のディレクトリを取得し、mat_pathには現在のディレクトリ/ex4data1.matのパスが入ります。
X = (scipy.io.loadmat(mat_path)["X"])
y_label = (scipy.io.loadmat(mat_path)["y"])
y_label[np.where(y_label == 10)] = 0
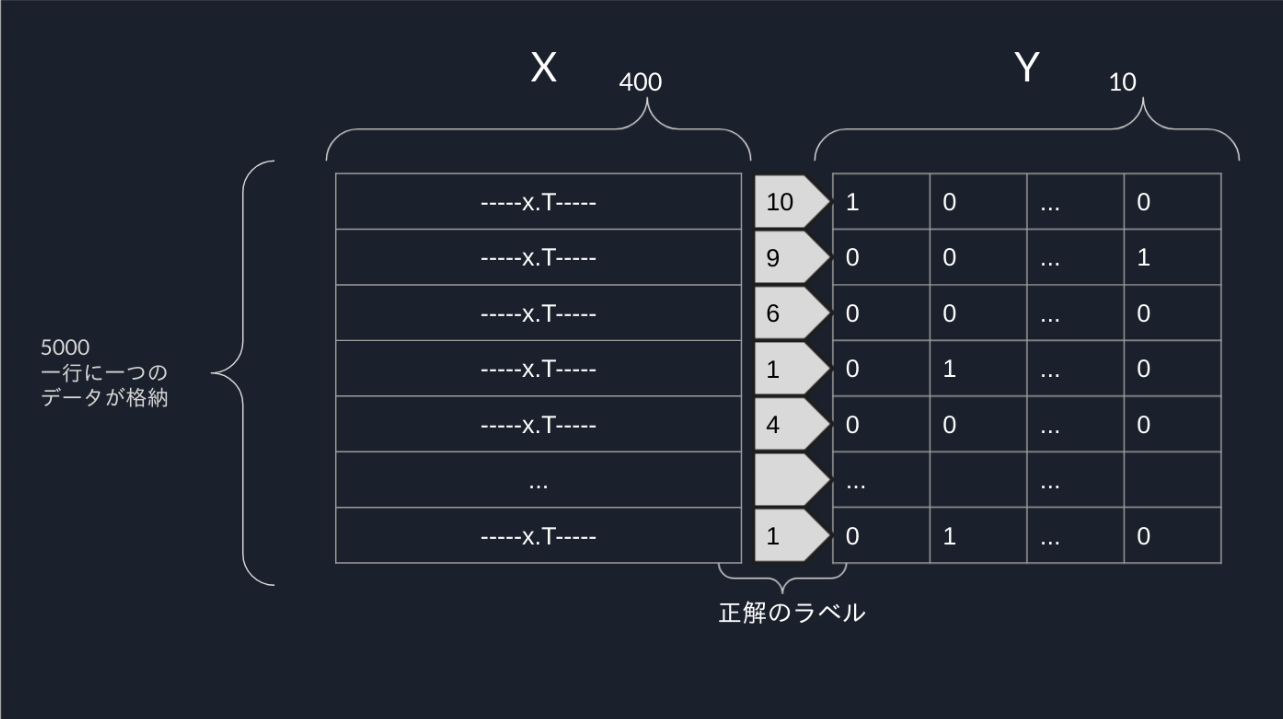
Y = np.zeros((y_label.shape[0], outputs))
Y = make_y_array(y_label, Y)
scipyを使ってmatファイルを読み込みます。最初y_labelには1から10までの数字が入っていますが、後の処理のため10を0に変更しています。
make_y_arrayは後述
p = np.random.permutation(X.shape[0])#シャッフル
X = X[p]
Y = Y[p]
このコードで順番をランダムにしています。
theta_list = make_theta(outputs) #theta 初期化
thetaの作成をして前準備は終了です。make_thetaは後述
確認
XとYの構造は画像のようになっています
関数解説
関数一覧
| 関数 | 概説 |
|---|---|
| make_theta(outputs) | thetaの初期化 |
| make_y_array(y_label, y) | y_labelから01でできた行列を生成 |
| sigmoid(array) | 行列の各要素にシグモイド関数を適用 |
| addBias(vector) | バイアスユニットを追加 |
| Predict(data_list, theta) | フォワードプロパゲーション |
| CostFunction(x,y,theta,lam) | コストを計算 |
| Backpropagation(x,y,theta,lam, training_set_number) | バックプロパゲーション |
| calculate_D(theta,DELTA,lam,m) | D行列を計算 |
| Refresh_theta(theta,D1,D2) | thetaを更新 |
| accuracy(x, y, theta) | 正答率を計算 |
解説
見ただけで作れそうなのが何個かあると思うのでわからなさそうなところだけ覗くのもいいと思います。
make_theta(outputs)
def make_theta(outputs):
    theta_list = []
    theta_0 = np.random.rand(25, 401) - 0.5
    theta_list.append(theta_0*0.24)
    theta_1 = np.random.rand(outputs, 26) - 0.5
    theta_list.append(theta_1*0.24)
    return theta_list
theta_listには、-0.12から0.12の間をランダムに取る値をもつ行列が入ります。値の根拠はCourseraを見てください。
theta_0には-0.5から0.5の間をランダムにとる行列を入れ、theta_listにはその.24倍を代入します。theta_1も同様です。
make_y_array(y_label, y)
def make_y_array(y_label, y):
    for i in range(y_label.shape[0]):
        j = int(y_label[i])
        y[i][j] = 1
    return y
ラベルの番号の列にのみ1を入れてほかはゼロの行列になります。
sigmoid(array)
def sigmoid(array):
    (hight, width) = array.shape
    answer = np.empty((hight, width))
    for row in range(hight):
        for column in range(width):
            if array[row][column] >500: #expがバグるので大きめのところで切ってる
                answer[row][column] = 1
            elif array[row][column] < -500: #速度向上のため
                answer[row][column] = 0
            else:
                answer[row][column] =1.0/(1.0 + math.exp((-1) * array[row][column]))
    return answer
すべての要素にsigmoid関数を適用します。exp関数を使うと、ある値でオーバーフローしてしまうので上限を決める必要があります。下限は任意です。対して速度も変わりませんが何となく書いてます。
addBias(vector)
def addBias(vector):
    vector = np.insert(vector, [0], 1)
    vector = vector[:, np.newaxis] #次元数が0しかないので追加
    return vector
index0, つまりは先頭に1を追加してバイアスとします。
次元数の操作が肝です。ベクトルのまま扱ってもいいのですが、やはり二次元配列同士の計算に持ち込むのでこの段階でいじっておいたほうがいいと思って足しました。
Predict(data_list, theta)
def Predict(data_list, theta):
    data_list = addBias(data_list) #バイアス追加
    a2 = addBias(sigmoid(np.dot(theta[0], data_list)))
    a3 = sigmoid(np.dot(theta[1], a2))
    return a2, a3
data_listはつまりa1です。バイアスを追加します。
thetaを左から掛け、シグモイド関数を適用した後バイアスを追加してa2を得ます。
a3はa2とほぼ同じやり方で、バイアスを追加しなかっただけですね。
返り値としてa2とa3の2つが帰ってくることに注意してください
CostFunction(x,y,theta,lam)
def CostFunction(x,y,theta,lam):
    num_data_list = x.shape[0]
    Cost = 0
    for m in range(num_data_list):
        y_m = (y[m])[:,np.newaxis]
        log1 = np.log(Predict(x[m],theta)[1])
        log2 = np.log(1-(Predict(x[m],theta)[1]))
        Cost += np.sum((-1)*y_m*log1)+np.sum((-1)*(1-y_m)*log2)
    Cost += (1/2)*lam*(np.sum(theta[0][:, : 400]**2) + np.sum(theta[1][:, : 25]**2))
    return Cost/num_data_list
コスト関数を求めます。コスト関数を求める式は
J(\theta)=\frac{1}{m} \sum_{i=1}^{m} \sum_{k=1}^{K}\left[-y_{k}^{(i)} \log \left(\left(h_{\theta}\left(x^{(i)}\right)\right)_{k}\right)-\left(1-y_{k}^{(i)}\right) \log \left(1-\left(h_{\theta}\left(x^{(i)}\right)\right)_{k}\right)\right]
ですが、今の状況に当てはめるなら

こういう理解をしてくれればオッケーです。結構複雑になってしまいましたが、一つ一つ積み上げていってください。
Backpropagation(x,y,theta,lam, training_set_number)
かな〜り長いので分割してかつ重要なところだけ解説します
def Backpropagation(x,y,theta,lam, training_set_number):
    test_x = x[training_set_number:]
    test_y = y[training_set_number:]

    training_x = x[:(training_set_number-1)]
    training_y = y[:(training_set_number-1)]
トレーニングとテストを分けてますね。
    #matplotlibの処理
    fig, ax1 = plt.subplots()
    ax2 = ax1.twinx()
    ax3 = ax1.twinx()
    ax2.set_ylim([0, 100])
    ax3.set_ylim([0, 100])

    plt_J = []
    plt_acc = []
    plt_test_acc = []
    iter_num = []
    #matplotlibの処理終わり
グラフいらない人は関係ないです
    num_data_list = training_x.shape[0]
    m = num_data_list
    iter = 1
    while True:
        try:
            DELTA_1 = []
            DELTA_2 = [] #初期化
            for M in range(num_data_list):
                x_m = training_x[M]
                y_m = training_y[M][:, np.newaxis]
                a1 = addBias(x_m)
                (a2, a3) = Predict(x_m,theta)
データの数だけ繰り返しです。while文なので、定数回の学習をしたい人はfor i in range(繰り返したい回数)に変えるといいです。
                delta_2 = []
                delta_3 = []

                delta_3 = a3 - y_m
                delta_2 = (np.dot(theta[1].T, delta_3))*((a2)*(1-a2))
                delta_2 = np.delete(delta_2,0,0) #delta[0]を除去
deltaの初期化から計算までしています。thetaを転置すること、delta_1をつくらないことは確実に理解しておいてほしいです。この辺からややこしくなるので前回のページを開きながらのほうが理解できると思います。
Pythonで文字認識ニューラルネットワーク構築【Coursera Machine Learning】(1.概要)
                if M == 0:
                    DELTA_2 = np.dot(delta_3,a2.T)
                    DELTA_1 = np.dot(delta_2,a1.T)
                else:
                    DELTA_2 += np.dot(delta_3,a2.T)
                    DELTA_1 += np.dot(delta_2,a1.T)
前回の解説
Courseraによる_DELTA_の定義は
\Delta^{(l)} = \Delta^{(l)} + \delta^{(l+1)}(a^{(l)})^Tとしてすべてのデータセットで足していくとなっていますが、これは結局
\Delta^{(l)} = \sum_{n=1}^m\delta^{(l+1)}_n(a^{(l)}_n)^Tと意味は同じです(_m_はデータセットの個数)
かなりCourseraの指示に従った計算をしています。おそらくもっと高速に解く方法はあります。
            D_1 = calculate_D(theta[0],DELTA_1,lam,m)
            D_2 = calculate_D(theta[1],DELTA_2,lam,m)
            Refresh_theta(theta, D_1, D_2)

            J = CostFunction(training_x, training_y, theta, lam)
            acc = accuracy(training_x, training_y, theta)
            test_acc = accuracy(test_x, test_y, theta)
Dの計算は後述です。
とにかく、Dを計算してthetaを更新します。
その後コスト、正答率を計算しています。
            #matplotlibの処理
            plt_J.append(J)
            plt_acc.append(acc)
            plt_test_acc.append(test_acc)
            iter_num.append(iter)
            #matplotlibの処理おわり
グラフがいらない人は不要です。
グラフのデータをリストに格納しています。
            print(f"{iter} th Cost = ", J)
            #print(f"{iter} th trainingaccurancy = ", acc, "%")
            #print(f"{iter} th test accurancy = ", test_acc, "%")
            if iter % 10 == 0:
                #print("Cost = ", J)
                print("trainingaccurancy = ", acc, "%")
                print("test accurancy = ", test_acc, "%")

                end = time.time()
                print("経過時間 = ", round((end-start), 2), "秒")
            iter += 1
更新毎に現在のコスト、トレーニングセットの正答率、テストセットの正答率を出せるようにしています。現在のコメントアウトの設定だと更新毎にコストを表示し、10更新毎にトレーニングセットの正答率、テストセットの正答率を表示するようにしています。さらに10更新毎には処理にかかった時間も表示しています。
1 th Cost =  3.4908510390858853
2 th Cost =  3.2411813018303155
3 th Cost =  3.225970125405239
4 th Cost =  3.216520578999215
5 th Cost =  3.207290393524195
6 th Cost =  3.197463432759209
7 th Cost =  3.18676202792359
8 th Cost =  3.1750111659099445
9 th Cost =  3.1620616566992283
10 th Cost =  3.147774076168419
trainingaccurancy =  39.3131 %
test accurancy =  36.4 %
経過時間 =  19.27 秒
特に監視したくないのであればコメントアウトによってスッキリします。またちょっといじって20回更新毎みたいなこともできます。
        except KeyboardInterrupt:
            break
これはキーボードのCrtl + Cを検知してループを抜ける処理です。while(またはfor)ループを抜けて、正しく次の処理に移ることができます。
    #matplotlibの処理
    ax1.plot(iter_num,plt_J ,"b-")
    ax2.plot(iter_num,plt_acc  ,"r-")
    ax3.plot(iter_num,plt_test_acc  ,"c-")
    plt.show()
    #matplotlibの処理おわり
    return
最後にグラフを表示して終わりです。
トレーニング:3000, テスト2000で100回更新したときのグラフ
これでBackpropagationは終わりです。お疲れ様でした。
calculate_D(theta,DELTA,lam,m)
def calculate_D(theta,DELTA,lam,m):
    D = np.zeros((theta.shape))
    for i in range(theta.shape[0]):
        if i == 0:
            D[0] = (1/m) * DELTA[0]
        else:
            D[i] = (1/m) * (DELTA[i] + (lam * theta[i]))
    return D
Dを計算していきます。
indexが0のときはバイアスユニットに関わるthetaなので正則化項を使いません。
Refresh_theta(theta,D1,D2)
def Refresh_theta(theta,D1,D2):
    theta[0] = theta[0] - D1
    theta[1] = theta[1] - D2
    return
計算したDをthetaから引くだけです。
accuracy(x, y, theta)
def accuracy(x, y, theta):
    correct_number = 0
    num_data_list = x.shape[0]
    m = num_data_list
    for i in range(m):
        pred = Predict(x[i], theta)[1]
        answer = y[i]
        if np.argmax(pred) == np.argmax(answer):
            correct_number += 1
    percent = round((correct_number/m)*100, 4)
    return percent
こちらは予測の正答率を計算します。
np.argmaxという聞き慣れないメソッドがありますが、単純に最大値を持つ要素のインデックスを返すだけです。答えは表示をきれいにするため四桁で四捨五入してます。
全体の流れの確認
今回のモデルは「学習をする」という目的なのでコードの本体は当然Backpropagationです。
データ前準備
X,y_labelをmatファイルから取り込む
y_labelからY行列を作り出す
thetaを初期化する
Backpropagation
入力データ、Predictからa1,a2,a3を得る
deltaを計算してDELTAを得る
DELTAからD行列を得る
thetaを更新する
繰り返し
序盤、終盤の解説
import numpy as np
import os
import math
import scipy.io
import time
from matplotlib import pyplot as plt
np.set_printoptions(suppress=True)
いつものnumpyとmatを読むためのscipy.io
そしてnp.set_printoptions(suppress=True)を記述すると表記が指数表記ではなく少数表記をしてくれます。指数表記がいいならFalseにしてください。
print("\nX_shape = ", X.shape)
print("y_shape = ", y_label.shape)
for i in range(2):
    print("theta_%s_shape = " % i, theta_list[i].shape)
print("training data set = ", training_set_number)
print("test data set = ", X.shape[0] - training_set_number)
print("Initial Cost = ", CostFunction(X, Y, theta_list, lam))
print("initial accuracy = ", accuracy(X, Y, theta_list), "%")

print("\nctrl + C を押した段階で学習を終了するよ!\n")

start = time.time()

Backpropagation(X, Y, theta_list, lam, training_set_number)

print("\nlast accuracy = ", accuracy(X, Y, theta_list), "%")
大体が確認のためのprint関数です。startはBackpropagation内にある経過時間表記のために使います。
X_shape =  (5000, 400)
y_shape =  (5000, 1)
theta_0_shape =  (25, 401)
theta_1_shape =  (10, 26)
training data set =  2000
test data set =  3000
Initial Cost =  6.839711021318157
initial accuracy =  10.22 %
こんな感じでコンソールに表示されます。
終わりに
記事としてはかなり長くなりました。コードばっかで構造がわかんなくなった人は前回の記事で解説をしていますし、Courseraでも解説しています。復習あるのみです。頑張ってください。
Pythonで文字認識ニューラルネットワーク構築【Coursera Machine Learning】(1.概要)
ソースコード
Mkamono/Letter_identify
参考
たくさんの先駆者がいます。かなり書き方が違うところがあるのでわかりやすい方を参考にしていただければとおもいます。
この記事を書いたあとに読んでわかりやすいと思った記事
@koshian2 さんの記事Coursera Machine LearningをPythonで実装 - [Week4]ニューラルネットワーク(1)
アンドリュー先生の愛が身にしみます
Coursera Machine Learning / Andrew Ng

